Page 1
1
Electrification Life Cycle of Incipient Thunderstorms 1
Enrique V. Mattos1, Luiz. A. T. Machado1, Earle R. Williams2, Steven J. Goodman3, 2
Richard J. Blakeslee4, Jeffrey Bailey5 3
4
1Instituto Nacional de Pesquisas Espaciais, Centro de Previsão de Tempo e Estudos 5
Climáticos, Rodovia Presidente Dutra, km 40, Cachoeira Paulista, SP, 12630000, Brasil 6
2Massachusetts Institute of Technology-Parsons Laboratory, Cambridge, MA, USA 7
3National Oceanic and Atmospheric Administration (NOAA/NESDIS/GSFC), 8
Greenbelt, MD, USA 9
4NASA George C. Marshall Space Flight Center/NSSTC, Huntsville, AL, USA 10
5The University of Alabama in Huntsville, Huntsville, AL, USA 11
12
Submitted to Journal of Geophysical Research (JGR-Atmospheres) 13
August 2016 14
15
Communicating author: Enrique V. Mattos ([email protected] ) 16
17
Key Points: 18
• The majority of first cloud-to-ground flashes are preceded by intracloud 19
lightning 20
• Initial positive differential reflectivity anomaly is present aloft, associated with 21
supercooled raindrops 22
• Reduced differential reflectivity is present before and during the time of the 23
initial lightning flash 24
25
Page 2
2
Index terms 26
3304 - Atmospheric Processes: Atmospheric electricity 27
3314 - Atmospheric Processes: Lightning 28
3324 - Atmospheric Processes: Convective processes 29
3360 - Atmospheric Processes: Remote sensing 30
31
Keywords 32
Polarimetric Radar; Lightning Localization System; First Cloud-to-Ground Lightning 33
Flash; First Radar Echo, Graupel; Supercooled Raindrops, Differential Reflectivity 34
35
36
37
38
39
40
41
42
43
44
45
46
47
48
49
50
Page 3
3
Abstract 51
This work evaluates how clouds evolve to thunderstorms in terms of microphysical 52
characteristics and produces the first intracloud (IC) and cloud-to-ground (CG) 53
lightning flashes. Observations of 46 compact isolated thunderstorms during the 54
2011/2012 spring-summer in Southeast Brazil with the X-band polarimetric radar and 55
two- and three-dimensional Lightning Location Systems demonstrated key parameters 56
in a cloud’s vertical structure that produce the initial electrification and lightning 57
activity. The majority (98 %) of the first CG flashes were preceded (by approximately 6 58
min) by intracloud (IC) lightning. The most important aspect of the observations going 59
into this paper, which came originally from the visual examination of a large number of 60
thunderstorms, is that an initial positive differential reflectivity (ZDR) (associated with 61
supercooled raindrops) evolved to reduced ZDR (and even negative values) in the cloud 62
layer between 0° and to -15°C before and during the time of the initial lightning, 63
suggesting evolution from supercooled raindrops to frozen particles promoting the 64
formation of the conical graupel. An enhanced negative specific differential phase (KDP) 65
(down to -0.5 ° km-1) in the glaciated layer (above -40 °C) was predominantly observed 66
at the time of the first CG flash, indicating that ice crystals, such as plates and columns, 67
were being aligned by a strong electric field. These results demonstrate that the 68
observations of ZDR evolution in the mixed layer and negative KDP in the upper levels of 69
convective cores may provide useful information on thunderstorm vigor and lightning 70
nowcasting. 71
72
73
74
75
Page 4
4
1 Introduction 76
Lightning is recognized as an important atmospheric component; however, the 77
knowledge about thunderstorms electrification process and its life cycle is still limited. 78
Understanding this process and the thunderstorm life cycle will help develop 79
nowcasting tools and lightning parameterization in numerical weather models. The 80
common aspect provided by experimental simulations and observational studies is that 81
collisions between graupel and small ice crystals inside an environment dominated by 82
supercooled water and strong updrafts is the primary process of thunderstorm 83
electrification [Reynolds et al., 1957; Takahashi, 1978]. Cloud microphysical 84
estimations from weather radar have provided a significant improvement in the 85
understanding of hydrometeors characteristics and the production of lightning in 86
thunderstorms [Workman and Reynolds, 1949; Reynolds and Brook, 1956; Goodman et 87
al., 1988; Buechler and Goodman, 1990; Hondl and Eilts, 1994; Jameson et al., 1996]. 88
Nevertheless, the understanding on how the clouds evolve, from the first cloud droplets 89
to full thunderstorms and how the first intracloud (IC) lightning and cloud-to-ground 90
(CG) lightning flashes are produced using an large sample of compact and isolated 91
thunderstorms is still lacking. 92
Observations provided by single and dual-polarization radar have shown an organized 93
progression from the first development of supercooled raindrops to the initial 94
electrification [Workman and Reynolds, 1949; Reynolds and Brook, 1956; Krehbiel, 95
1986; Goodman et al., 1988; Ramachandran et al., 1996; Jameson et al., 1996; Bringi et 96
al., 1997; Lopez and Aubagnac, 1997; Carey and Rutledge, 2000; Bruning et al., 2007; 97
MacGorman et al., 2008; Woodard et al., 2012; Mecikalski et al., 2015; Stolzenburg et 98
al., 2015]. Workman and Reynolds [1949] evaluated the initial electrification in twelve 99
summer storms in New Mexico and reported the occurrence of the first IC lightning 100
Page 5
5
approximately 13 min following the first radar echo and coincident with the time that 101
the radar echo begins to descend. Meanwhile, Reynolds and Brook [1956] showed that 102
initial electrification in thunderstorms is associated with a rapid vertical development of 103
the initial radar-precipitation echo. Goodman et al. [1988] used polarimetric radar and 104
documented the first IC lightning event approximately 4-6 min after water at the top of 105
a supercooled column froze and radar-inferred graupel particles had formed. On the 106
other hand, Ramachandran et al. [1996] analyzed several convective cells within two 107
Florida storms with in situ aircraft and polarimetric radar observations. They observed 108
the first CG lightning 15 min after the first radar echo and after the development of ice 109
phase precipitation via the freezing of supercooled rain within the upper portion of the 110
updraft region, followed by the appearance of an electric field of tens of kilovolts per 111
meter close to -6°C isotherm. Additionally, Jameson et al. [1996] showed that the onset 112
of electrification coincided with the appearance of significant volumes of differential 113
reflectivity (ZDR) above the -7 °C level. More recently, Stolzenburg et al. [2015] 114
examined the initial electrification of New Mexico thunderstorms and documented the 115
initiation of the first IC flash at temperatures between -10° and -20°C and 5-8.6 min 116
after of the earliest deflection of electric field at surface. The authors documented that 117
the initial electrification became evident at the surface after stronger reflectivity ZH (40 118
dBZ) developed above the -5°C isotherm, and a rapid growth of the surface electric 119
field was observed after this ZH extended above the -15°C isotherm. The results 120
suggested also that the radar data with higher time resolution could improve the lead 121
time by 2-7 min in detecting the onset of initial electrification compared with the 122
electric field measurements at the surface. 123
Indeed, the aforementioned studies show the importance of the regions with larger 124
raindrops above the melting layer (defined as +ZDR-columns) for the formation of 125
Page 6
6
graupel embryos, that in turn, such mixed-phase hydrometeors (graupel, ice crystals and 126
supercooled raindrops) are fundamental for the early cloud electrification. ZDR-columns 127
and their vertical extent are well correlated with the updraft intensity [Hall et al., 1980, 128
1984; Caylor and Illingworth, 1987; Illingworth et al., 1987; Bring et al., 1991; 129
Herzegh and Jameson, 1992; Conway and Zrnic, 1993; Ryzhkov et al., 1994; Hubbert et 130
al. 1998; Smith et al. 1999; Picca et al., 2010; Kumjian et al., 2012; Kumjian et al., 131
2014; Homeyer and Kumjian, 2015; Snyder et al., 2015]. The pioneering work 132
presented by Hall et al. [1984] documented a narrow column of strong ZH (~ 48 dBZ) 133
and positive ZDR (~ +2.5 dB) reaching 1.5 km above the melting layer, which was 134
interpreted as supercooled water carried upward by strong updraft. Illingworth et al. 135
[1987] also documented positive ZDR (~ +3 dB) and moderate ZH (~ 30 dBZ) extending 136
up to the -10°C level in developing convective clouds and attributed this observation to 137
a low concentration of large (> 4 mm diameter) supercooled raindrops. Their 138
observations suggested also that ZDR-columns persist for less than ten minutes with drop 139
diameters between 1 and 2 km. The authors argued that such a low concentration of 140
large raindrops could be efficient as hail embryos, growing to large hailstones after the 141
freezing process due to the lack of competition for cloud water. Hubbert et al. (1998) 142
evaluated polarimetric radar measurements and ground observations of hail in Colorado 143
and documented that 30-40 % of the hailstones contained frozen drop embryos. This 144
result showed the importance of mixed-phase particles in the upper portion of the ZDR-145
columns for the formation of hail. In addition, Smith et al. [1999] evaluated ZDR 146
signatures and linear depolarization ratio (LDR) using 3-cm radar and compared with in 147
situ photographs and shadowgraphs of precipitation particle observations by the T-28 148
aircraft in a Florida convective storm. ZDR-columns presented large positive ZDR (+2-3 149
Page 7
7
dB) and large LDR (-24 and -30 dB) close to -10°C level, possibly indicating the initial 150
freezing of rain. 151
More recently, Homeyer and Kumjian [2015] analyzed the behavior of the polarimetric 152
signature in three different overshooting convective thunderstorms: organized 153
convection, discrete ordinary convection, and discrete supercell convection. Their 154
results revealed deep columns of highly positive ZDR and specific differential phase 155
(KDP) representing the lofting of liquid hydrometeors within the convective updraft and 156
above the melting level. The formation of ZDR-columns is frequently attribute for the 157
condensation and coalescence process through of updrafts regions [Illingworth et al., 158
1987] and alternatively associated the existence of ultragiant nuclei serving to the 159
growth of large drops [Caylor and Illingworth, 1987]. These regions are a probable 160
source area for graupel embryos, produced by raindrops frozen inside those columns, 161
which are fundamental for early electrification and lightning [Conway and Zrnic´, 1993; 162
Carey and Rutledge, 1998]. Woodard et al. [2012] showed that the +ZDR-columns are a 163
useful parameter for radar-based operational forecasting algorithms for lightning 164
initiation. 165
Many works have demonstrated that electric fields in clouds can also influence the 166
orientation of ice crystals with oblate and prolate shapes [Weinheimer and Few, 1987; 167
Metcalf, 1993, 1995; Krehbiel et al., 1996; Caylor and Chandrasekar, 1996; Metcalf, 168
1997; Foster and Hallett, 2002; Ventura et al., 2013; Mattos et al., 2016]. In conditions 169
of strong electric field ice crystals are mostly vertically-oriented. When detected by 170
polarimetric radars these hydrometeors traditionally present negative values for 171
differential propagation phase (∅DP) [Caylor and Chandrasekar, 1996; Ryzhkov and 172
Zrnic, 2007; Carey et al., 2009] and negative KDP [Caylor and Chandrasekar, 1996; 173
Carey et al., 2009; Hubbert et al., 2014a; Mattos et al., 2016]. For example, Caylor and 174
Page 8
8
Chandrasekar [1996] found that ∅DP and KDP gradually decrease and then abruptly 175
increase after lightning. The authors documented changes of 5° in ∅DP and a systematic 176
minimum peak in KDP of approximately -0.9 °km-1 in the height range 7-14 km just 177
before lightning occurrences. More recently, Mattos et al. [2016] documented the 178
polarimetric behavior as a function of the lightning density and observed that negative 179
KDP is observable only in conditions with the strongest lightning frequency. However, 180
the larger unaligned graupel-ice crystals mixture could mask the electrical alignment of 181
ice crystals as indicated by the change in KDP measurements as discussed in previous 182
studies [Marshall et al., 2009; Carey et al., 2009]. Carey et al. [2009] evaluated the 183
polarimetric signatures of ice particles using a T-Matrix approach and found that in 184
regions with ZH > 40-45 dBZ, the |KDP| of graupel can be on the order of the |KDP| of 185
vertically-oriented plate ice crystals. These results suggested that in a graupel-plate 186
mixture, horizontally-oriented graupel can mask the electrical alignment signature that 187
would otherwise be present in the KDP of vertically-oriented plates alone. Recently, 188
Hubbert et al. [2014a] evaluated the nature of the ice crystals causing negative KDP in 189
polarimetric measurements from S-band polarimetric radar. The results suggested two 190
types of ice crystals: 1) smaller aligned ice crystals (columns or plates) with relatively 191
small ZH and 2) larger aggregates or graupel randomly oriented with larger ZH that 192
masks the ZDR of the smaller aligned ice crystals. The interpretation of these results has 193
been supported by satellite measurements. Satellite measurements at microwave 194
frequencies (85 GHz) have shown negative differences in brightness temperature (TB) 195
in the 85 GHz channel (TBV-TBH) associated with strong lightning frequency [Prigent 196
et al., 2005; Mattos and Machado, 2011]. Mattos and Machado [2011] documented that 197
CG lightning rate increases linearly with polarization reduction, suggesting that such 198
Page 9
9
polarization differences could be explained by relatively large and non-spherical 199
particles that are mostly vertically oriented. 200
Some works showed also that stratiform regions of summer squall lines can exhibit 201
strong electric fields sufficient for lightning initiation [Chauzy et al., 1980; Engholm et 202
al., 1990], which could promote negative ZDR. On the other hand, snowstorms with 203
moderate snowfall rates probably do not have strong electric fields. For example, 204
Williams et al. [2015] documented predominantly positive ZDR in snowstorms and warm 205
season stratiform systems, indicating that the vertical electric fields they contain are not 206
sufficient to reorient ice crystals and change the sign of ZDR. 207
Other works have documented that negative ZDR could be caused also by graupel 208
particles [Wiens et al., 2005; Dolan and Rutledge, 2009; Evaristo et al., 2013; Homeyer 209
and Kumjian et al., 2015; Stolzenburg et al., 2015; Oue et al., 2015; Bringi et al., 2016]. 210
For example, Dolan and Rutledge [2009], using a T-matrix scattering model for several 211
different hydrometeor types, suggested the presence of negative ZDR associated with 212
graupel particles. High-density graupel may have negative ZDR values with relatively 213
large reflectivity. Consistent with this picture, Evaristo et al. [2013] showed a linear 214
decrease in ZDR with the cone apex angle of conical graupel; for instance, a ZDR of 215
around -1.2 dB was obtained for 30°. Bringi et al. [2016] documented negative ZDR (~ 216
−0.3 to −0.7 dB) values along a vertical column in a winter storm at high plains region 217
of Colorado. The results suggested that conical graupel were more prevalent in the 3.5-218
4.0 km Mean Sea Level (MSL) height layer of the echo cores where ZDR tended to be 219
slightly more negative. More recently, Homeyer and Kumjian [2015] documented a 220
near-zero ZDR minima in organized and discrete supercells close to and at altitudes 221
higher than the updraft column features, indicating the presence of large hail. 222
Additionally, minimum ZDR and negative KDP was observed throughout the portion of 223
Page 10
10
the convective cores of organized convective systems that overshot the tropopause, 224
suggesting signatures from small hail and/or lump or conical graupel. 225
Understanding the relationships between the characteristics of polarimetric radar in the 226
early development of clouds and the production of the first lightning could be very 227
useful for lightning nowcasting and lightning parameterization. The basic aspects of 228
cloud electrification have been described in several studies; however, cloud evolution 229
during the electrification life cycle, from the first radar echo until the moment of the 230
first IC and CG flashes, has not been completely defined. What is different for this work 231
from prior studies is the extensive documentation of the first IC and CG lightning 232
flashes using two- and three-dimensional lightning location systems together with time-233
resolved polarimetric observations for a special subset of storms with lower attenuation. 234
The thunderstorms studied in this work are very compact clouds (~ 9 km of diameter) 235
and this procedure enabled a simpler physical interpretation of early thunderstorm 236
development and with reduced radar attenuation operating in the X-band. In addition, 237
this study aims to evaluate the signatures from conical graupel using X-band radar with 238
signatures strongly tied to the initial electrification of these thunderstorms. Therefore, 239
this study aims to cover these aspects based on case studies and a large statistical 240
analysis of 46 isolated compact thunderstorm life cycles. 241
Section 2 presents the general aspects of the CHUVA-Vale campaign and the radar and 242
lightning observations that were employed. Section 3 presents the methodology, in 243
section 4 are discussed in details three case studies and in section 5 the statistical 244
analysis of the 46 thunderstorms. The discussion and the main conclusions are presented 245
in section 6. 246
247
248
Page 11
11
2 The CHUVA-Vale Campaign 249
The CHUVA (Cloud Processes of the Main Precipitation Systems in Brazil: A 250
Contribution to Cloud Resolving Modeling and to the Global Precipitation 251
Measurement) project’s main scientific motivation was to contribute to the 252
understanding of cloud processes, which represent one of the least understood 253
components of the weather and climate system. During five years (from 2010 to 2014) 254
the CHUVA project has conducted several field campaigns in Brazil [see Machado et 255
al., 2014 for a detailed description]. The CHUVA-Vale campaign’s objective was to 256
understand the cloud processes that evolve when clouds transform into thunderstorms. 257
The CHUVA-Vale campaign took place during the Brazilian spring-summer (from 258
November 2011 to March 2012) in São José dos Campos, in Southeast Brazil. The 259
essential datasets used in this study were the polarimetric variables from the XPOL 260
radar, the return stroke information provided by the Brazilian Lightning Detection 261
Network (BrasilDAT) and the Very Low Frequency (VHF) radiation sources from the 262
São Paulo Lightning Mapper Array (SPLMA). Figure 1 shows the location of the XPOL 263
radar (gray diamond) and the lightning sensors from the BrasilDAT (blue stars) and 264
SPLMA (red filled circles) networks. Asterisks represent the locations of the 46 265
incipient thunderstorms at the time of the first CG lightning flash. 266
267
2.1. XPOL radar and Data Post-processing 268
To identify and track the polarimetric signatures in the thunderstorms we utilized all the 269
volume scans from the mobile XPOL (9.345 GHz) polarimetric radar. We evaluated the 270
horizontal reflectivity (ZH, dBZ), differential reflectivity (ZDR, dB), specific differential 271
phase (KDP, ° km-1) and the correlation coefficient (ρHV) [see Straka et al., 2000 for a 272
detailed description of these variables]. The XPOL strategy was consistently performed 273
Page 12
12
every 6 minutes, and included a 4 minute standard volumetric scan with 13 elevations 274
from 1.0 ° to 25.0 ° and radar samples resolved to 150 m in range and 1.0 ° in azimuth. 275
The strategy also included a scan at 89 ° elevation with full azimuthal rotation for 276
purposes of ZDR calibration (offset check) and specific Range Height Indicator (RHI) 277
scans. 278
The radar data were post-processed following several steps to correct the raw data for 279
attenuation and the ZDR offset. To correct the attenuation in ZH, the so-called Rain 280
Profiling Algorithm (ZPHI) proposed by Testud et al. [2000] was applied. The 281
reflectivity field was compared with a nearest S-band radar (distant 50 km far from 282
XPOL radar). The XPOL radar captured very well the storms structure in comparison 283
with the S-band radar. However, for higher XPOL reflectivity values (~ 40-60 dBZ) a 284
negative BIAS (around -5 dBZ) was found as well as for the comparison with the 285
reflectivity simulated through the T-matrix method using information from the 286
disdrometer. For higher reflectivity values the XPOL radar attenuation correction 287
scheme does not fully correct the reflectivity field. Section 3 discusses this effect in the 288
results and the limitations on the storm selection to reduce these uncertainties. 289
Differential attenuation in ZDR is experienced when radiation moves through 290
populations of oblate raindrops; this was corrected using the method of linear ∅DP, 291
which considers the total differential attenuation to be linearly proportional to ∅DP 292
[Bringi et al., 2007]. The ZDR average and median corrections were 0.3 and 0.2 dB, 293
respectively. The offset in ZDR due to the imbalance of the horizontal and vertical 294
channels was determined for three periods of the CHUVA-Vale campaign: -0.27 dB 295
(period before the exchange of the radome), -0.33 dB (period after the exchange of the 296
radome) and -0.59 dB (period after the calibration/substitution of components) 297
[Sakuragi and Biscaro, 2012]. 298
Page 13
13
To compute KDP an iterative finite impulse response (FIR) range filter developed by 299
Hubbert and Bringi [1995] was applied to the raw ∅DP data. This filter smoothes ∅DP 300
and an interactive methodology was performed to remove ∅DP deviations caused by 301
backscatter differential phase shift (δ) from large oblate particles. The KDP values were 302
derived by a least-squares regression of ∅DP over several range gates. The average δ 303
observed for the dataset was 0.3°. Comparisons between the polarimetric variables from 304
the T-matrix method using a Joss disdrometer and the variables estimated by the XPOL 305
radar showed average disagreements (radar-disdrometer) of -0.04 dB (ZDR) and of -0.07 306 ° km-1 (KDP). Further details of the data post-processing in the CHUVA experiment can 307
be found in Schneebeli et al. [2012]. In the foregoing analysis, these corrections were 308
included in the ZH and ZDR radar measurements. 309
310
2.2. Lightning Observations 311
Lightning information was provided by two independent Lightning Location Systems 312
(LLSs). The IC and CG return strokes were provided by the Brazilian Lightning 313
Detection Network (BrasilDAT) (Figure 1, blue stars). This lightning network employs 314
technology from Earth Networks and operates in a large frequency range (from 1 Hz to 315
12 MHz), and locates lightning using the time-of-arrival method. During this study, 56 316
sensors from BrasilDAT covered the southeastern, southern, central and a portion of the 317
northeastern regions of Brazil. Additional sensors from BrasilDAT were located close 318
to the CHUVA-Vale region to improve the data quality. The reprocessed data pertaining 319
to location, time of occurrence, and polarity of the IC and CG return strokes were used 320
in this study. A preliminary evaluation of BrasilDAT using high speed cameras showed 321
a detection efficiency of about 88 % for CG flashes [Naccarato et al., 2012]. More 322
recently, Williams et al. [2016] analyzed the same thunderstorms selected in this study 323
Page 14
14
and concluded that the majority of lightning flashes detected by BrasilDAT was also 324
detected by the Brazilian Integrated Lightning Detection Network (RINDAT) network. 325
A good agreement was found between the CG stroke-multiplicity and peak current 326
estimated by BrasilDAT and RINDAT lightning networks. Additionally, a second LLS, 327
operating in the VHF range, was used to determine the initiation region of the initial IC 328
and CG return strokes detected by BrasilDAT. Named the São Paulo Lightning Mapper 329
Array (SPLMA) (Figure 1, red filled circles), this network was developed by the New 330
Mexico Institute of Mining and Technology and installed in a collaborative effort 331
between NASA (National Aeronautics and Space Administration), the University of 332
Alabama in Huntsville, INPE (National Institute of Space Research), and USP 333
(University of São Paulo). During the CHUVA-Vale campaign, the SPLMA was 334
composed of 12 stations operating in the frequency band of TV channels 8 (180-186 335
MHz) and 10 (192-198 MHz) [Blakeslee et al., 2013; Bailey et al., 2014; Albrecht et al., 336
2014]. The dataset was reprocessed to provide the time, latitude, longitude and altitude 337
of the VHF radiation sources from all lightning detected during the campaign. The 338
mean chi-square χ2 and mean number of stations per solution were 1.3 and 7, 339
respectively. The SPLMA data were used for three thunderstorms for the analysis of 340
lightning initiation (section 4). These thunderstorms occurred very close to the SPLMA 341
center (less than 30 km distance), favoring a region with higher detection efficiency and 342
enabling the detection of the majority of lightning activity from these thunderstorms. 343
344
3 Identification of Thunderstorms and Co-location with Lightning Observations 345
In this study, thunderstorms were identified and tracked manually with observations 346
from the XPOL radar. These thunderstorms represent isolated precipitating cells and 347
were chosen for further study if no additional thunderstorms were obstructing the path 348
Page 15
15
between the radar and the respective thunderstorm cell. This procedure enabled a 349
simpler physical interpretation of early thunderstorm development and reduced radar 350
attenuation effects characteristic of radars operating in the X-band. A minimum distance 351
of 20 km from the radar was selected to avoid thunderstorm cases with limited-top due 352
to the lower beam height close to the radar. Based on the aforementioned 353
considerations, the life cycle of thunderstorms were typically sampled using a 6-minute 354
scan strategy and the azimuth angle and distance limits from the radar were used to 355
determine the thunderstorm’s boundaries. 356
From the radar perspective, we considered thunderstorm initiation to be when a radar 357
echo with any value of reflectivity above the reflectivity noise level was first detected in 358
any height in any Plan Position Indicator (PPI) scan. The majority of thunderstorms 359
were identified between 20 and 60 km range from radar, with minimum detectable radar 360
reflectivity of approximately -4 dBZ and 9 dBZ, respectively. This procedure aimed to 361
identify the initial development of the thunderstorms without restrictions. Based on 362
these constraints, 46 thunderstorm life cycles were selected for this study. 363
The lightning information was co-located to each time step of the 46 thunderstorm life 364
cycles. First the return stroke observations from BrasilDAT were grouped into flashes 365
using a temporal and spatial criterion of 0.5 seconds and 20 km, respectively. The 0.5 366
sec time threshold is close to that employed by McCaul Jr. et al. [2009] and Goodman 367
et al. [2005] (0.3 sec) and Nelson [2002] (0.5 sec). The criterion of 20 km corresponds 368
to the fact that the majority of the 46 storms had diameters smaller than 20 km (see 369
Figure 2 found in Williams et al., 2016). Williams et al. [2016] used this same data set 370
and spatial criterion and showed that the stroke-multiplicity and peak current from 371
BrasilDAT was very similar to that from RINDAT network. In fact, the 20 km spatial 372
criterion is a good choice for this study, because the storms are isolated and presents 373
Page 16
16
low flash rates; however for larger and more complex storms, other values for this 374
spatial criterion should be evaluated. Afterward, IC and CG flashes were accumulated 375
every 6-minutes and assigned to respective thunderstorms by using the area boundaries 376
as a constraint. Finally, to determine the initiation height of these flashes, VHF sources 377
from SPLMA were linked with the IC and CG flashes from BrasilDAT. The same 378
spatial-temporal criteria used to combine strokes into flashes (i.e., 0.5 s and 20 km) 379
were used to find the VHF sources associated with every IC and CG flash. In this way, a 380
dataset was created for the life cycle of each thunderstorm, from the polarimetric 381
variables of the initial radar echo through the time of the first IC and CG flashes. 382
383
4 Thunderstorms Case Studies 384
In order to follow the behavior of the polarimetric variables on a case-by-case basis and 385
evaluates the initiation region of the first lightning flashes, was selected and discussed 386
in detail three thunderstorms with different total (intracloud+cloud-to-ground) lightning 387
flash rate: i) relatively weak (1.5 flashes min-1), ii) relatively moderate (1.9 flashes min-388
1) and iii) relatively strong (2.3 flashes min-1) lightning flash rate. These thunderstorms 389
occurred close to the SPLMA center in a region with good coverage by the XPOL radar 390
which made it possible to evaluate the region of initiation of the first flashes in terms of 391
lightning and polarimetric radar signatures with good efficiency. Note that the 392
designations relatively weak, moderate and strong lightning flash rate are based on the 393
specific initial lighting flashes rate for the small storms used in this study; a procedure 394
that differs from many other published studies. These thunderstorms present lower 395
lightning flash rates likely due to their small size (< 20 km in diameter) and weaker 396
updraft. Moreover, these definitions are used in this study as a reference and only to 397
classify the lightning flash rates of these thunderstorms. In the context of the natural 398
Page 17
17
variability of the 46 selected thunderstorms, these three cases give a representative 399
description of the studied thunderstorm population. 400
401
4.1. Case #1: The Thunderstorm at 1800 UTC on 20 February 2012 402
Time-height plots of selected radar parameters were computed for the thunderstorms 403
life cycle based on the PPI-volume scans. For this purpose, the maximum ZH in each 404
PPI and the coincident value of ZDR, KDP and ρHV in the cell were selected. Each volume 405
scan of the thunderstorm was represented by single vertical profile with 13 altitude 406
levels, one for each PPI. Employing the methodology described above, the vertical 407
sampling cannot be considered perfectly vertically-aligned. However, a statistical 408
evaluation of the degree of verticality of each profile showed a median value of 250 m 409
offset between the vertical radar gates. This small effect is probably attributable to the 410
compact and isolated thunderstorms that were selected. This procedure aimed to 411
illustrate the dominant behavior of the polarimetric parameters. Figure 2 shows the 412
time-height plots of ZH, ZDR, KDP and ρHV from the first radar echo until the time of the 413
first CG flashes for the thunderstorm with relatively weaker total lightning flash rate 414
(1.5 total flashes min-1) observed on 20 February 2012. 415
The thunderstorm developed during late afternoon at 1800 UTC (1600 LT) and showed 416
the first radar echo (at time of 0 min) at 3 km height and with 15 dBZ. The first IC (CG) 417
flash was registered 28 (30) min after the first radar echo time. During this interval 418
(from 0 to 30 min), the reflectivity ZH (Figure 2a) evolves from weak (15 dBZ) to 419
strong (56 dBZ) value at 0 °C level, indicating the formation of large hydrometers. For 420
simplicity, the term ‘large hydrometers’ is referred to those hydrometers that are in the 421
Rayleigh regime (< 2 mm in diameter), hereafter. The time-height plot for ZDR (Figure 422
2b) indicates an initial concentration of raindrops close to melting layer which is shifted 423
Page 18
18
to higher altitudes when approaching to the time of the first IC flash (at 28 min). At the 424
time of the first CG flash (~ 30 min), a negative value of KDP (-0.3 ° km-1, Figure 2c) 425
and a strong value for ρHV (> 0.99, Figure 2d) were found in upper levels (13 km 426
altitude), indicating ice particles are being aligned by strong electric field. In fact, 427
polarimetric variables show important characteristics between 0° and -40°C levels. 428
Figure 3 shows the evolution of the minimum values for ZH, ZDR, KDP and ρHV observed 429
in the layer between 0° and -40°C. The reduction of ZDR and KDP before the first CG 430
flash, followed by the increase of ρHV in the mixed-layer (0° and -15°C), is the main 431
remarkable behavior. It probably corresponds to the signature of the freezing of ice 432
particles and the formation of graupel, fundamental conditions for the non-inductive 433
electrification mechanism and lightning production. 434
In order to evaluate the polarimetric behavior of the entire vertical structure of this 435
thunderstorm, vertical cross sections were computed following the centroid of the 436
thunderstorm (i.e., Lagrangian analysis) from the first radar echo until the time of the 437
first CG flash. Figure 4 shows the vertical cross section as well as the projected 438
locations of the flashes. The centroid location of the first 10 % of the total sources in a 439
flash was considered to be the origin location for the first IC and CG flashes, as in Lang 440
and Rutledge [2008] and Lund et al. [2009]. The thunderstorm initiated with the 441
formation of small raindrops with weaker ZH (20 dBZ) in the warm cloud layer (Figure 442
4a) at 10 and 20 km distance-range and after six minutes the supercooled raindrops 443
reach the -16 °C isotherm (Figure 4b) at 13 km distance-range. The weaker ZH (20 dBZ) 444
and the moderate ZDR (+1.5 dB) observed close to the -25 °C level suggest the initial 445
formation of ice crystals. In the following image (Figure 4c) strong ZH (50 dBZ) and 446
ZDR (+3.5 dB) is observed close to the -15 °C level at 13 km distance-range, indicating 447
the intensification of updrafts. Six min later (Figure 4d) this region intensifies and 448
Page 19
19
reaches higher levels and also reaches the ground, indicating the formation of large 449
precipitation particles near the ground. Note the existence of a deepened tower reaching 450
up to -16°C with strong ZH and including a narrow tower of positive ZDR above the 451
melting layer, indicating the lofting of supercooled raindrops by strong updraft. Ice 452
crystals and graupel particles are evident in the upper layers (> 8 km) of this column, 453
inferred by the negative ZDR and KDP in this region. In the following time step (Figure 454
4e) the ZH value above the -30 °C level centered at 13 km distance-range decreases by 455
5-10 dBZ and a large region with more negative ZDR and KDP is formed simultaneously 456
with the reduction of the +ZDR-column, promoting the occurrence of the first IC flash 457
close to the -20 °C level. The freezing of the supercooled raindrops aloft when the 458
+ZDR-column is collapsing is the probable causes for the diminished ZH, since the 459
dielectric constant for ice is smaller than for liquid water particles [Battan, 1973]. The 460
+ZDR-column collapse associated with the formation of graupel is evident in the image 461
of the first CG flash (Figure 4f), where large conical graupel is suggested close to the 462
melting level. In the follow image (Figure 4g), conical graupel particles are predominant 463
above the melting layer when the IC flashes rate increases. 464
465
4.2. Case #2: The Thunderstorm at 1536 UTC on 22 January 2012 466
The thunderstorm with relatively moderate total lightning flash rate (1.9 flashes min-1) 467
developed during the afternoon period at 1536 UTC (1336 LT), and 20 min after of the 468
first radar echo (Figure 5), it registered its first IC flash (indicated by the black arrow). 469
Three minutes after of the first IC flash, the first CG flash was registered (indicated by 470
the blue arrow). The first radar echo is observed at the 4.3 km altitude with weaker ZH 471
(Figure 5a, 15 dBZ), positive ZDR (Figure 5b, +2 dB) and strong ρHV (Figure 5d, 0.96) 472
suggesting initial raindrops. From the thunderstorm initiation time until the radar scan 473
Page 20
20
time (from 0 to 18 min) that marked the first IC and CG flashes, the radar observations 474
show an increase in ZH up to 51 dBZ, a decrease in ZDR down to -0.1 dB and an increase 475
in ρHV (0.99) at the 8 km altitude (-23 °C level), suggesting the formation of graupel 476
particles and ice crystals. Positives KDP values (Figure 5c, +0.2 ° km-1) at the 10 km 477
altitude (~ -34 °C) show the existence of large concentration of iced hydrometers. Note 478
that around 12 min after the first radar echo a deep column of ZDR (+2.7 dB) reached 6.5 479
km altitude (-13°C), suggesting a strong supply of supercooled raindrops before the first 480
IC and CG flashes times. Similar to the previously discussed thunderstorm, this feature 481
of supercooled liquid particles lofted by the thunderstorm’s updraft in the mixed phase 482
is now well recognized as a +ZDR-column [Hall et al., 1980, Caylor and Illingworth, 483
1987; Bring et al., 1991; Conway and Zrnic, 1993; Ryzhkov et al., 1994; Hubbert et al. 484
1998; Smith et al. 1999; Kumjian et al., 2012; Kumjian et al., 2014; Snyder et al., 2015]. 485
In fact, these changes are more conspicuous in the mixed-layer (between 0° and -15 °C). 486
Figure 6 shows an increase of KDP (up to +0.4 ° km-1), while ZDR decreases (down to 0 487
dB) prior to the IC flash time. 488
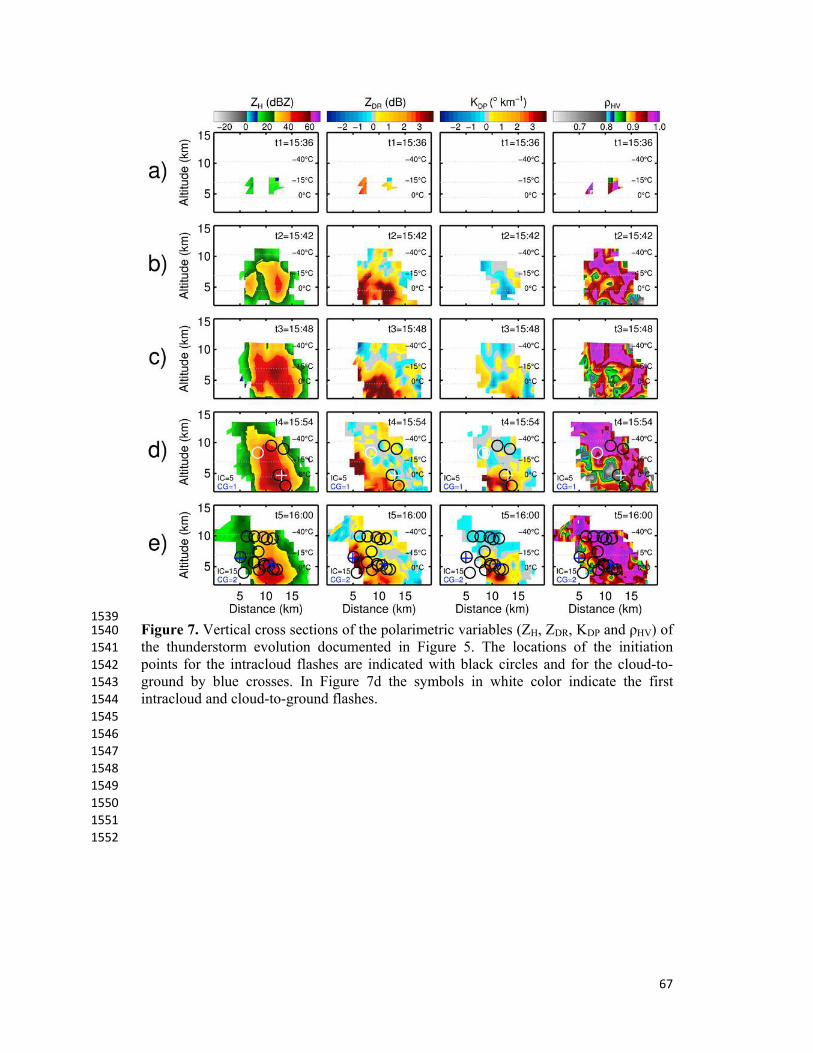
It is noted that the convective process was initiated by two adjacent +ZDR-columns 489
(Figure 7b, 1542 UTC) localized at ranges of 6 km and 11 km, likely associated with 490
two convective updraft regions. In this distance-range (6 km and 11 km) very small 491
pockets of low ρHV (0.85-0.90) are observed at the top of the +ZDR-columns. These 492
observations are qualitatively consistent with previous studies [Herzegh and Jameson, 493
1992; Conway and Zrnic´, 1993; Jameson et al., 1996; Bringi et al., 1997; Hubbert et 494
al., 1998] and are likely regions containing a mixed phase with supercooled drops, 495
partially freezing drops and frozen hydrometeors. The two +ZDR-columns merged into a 496
single column and descended close to the -10 °C isotherm in the 10 km distance-range 497
and negative KDP (-0.5 ° km-1) observed between 0° and -15°C suggest the formation of 498
Page 21
21
graupel particles (Figure 7c, at 1548 UTC). This demise of the +ZDR-column produced 499
mixed-phase hydrometeors such as graupel and supercooled raindrops as indicated by 500
the low ρHV (0.85) at the 12 km distance-range observed between the 0° and -15°C 501
level. In the following moments (Figure 7d, at 1554 UTC) a large heterogeneous 502
horizontal distribution of hydrometeors was observed from 5 to 17 km distance-range 503
more pronounced between 0°C and -15 °C levels and the first IC was recorded (white 504
circle); three minutes later (as described in Figure 5) the first CG flash (white cross) was 505
recorded. The first IC flash initiated near the -30 °C level at 8 km distance-range, close 506
to a region with vertically-oriented ice crystals, and the first CG flash was recorded over 507
the region close to the -3 °C level at 13 km distance-range, with strong reflectivity at the 508
top of region with near-to-zero ZDR with positive KDP (~ +0.5 ° km-1) and at transition 509
region with moderate-strong ρHV (~ 0.86-0.95), separated by a region with large 510
negative ZDR, which was likely dominated by rimed graupel. The notable region with 511
very low very ρHV (~0.80) between the 0 °C and -15 °C levels centered at 11 km 512
distance-range is likely associated with nonuniform beam filling (NBF) effects. 513
According to Ryzhkov [2007] large cross-beam gradients of ∅DP may cause noticeable 514
decrease of ρHV. Ryzhkov [2007] documented negative bias of approximately 0.2. 515
Although this bias exist, correcting ρHV for such biases is not practical because the 516
biases cannot be estimated with sufficient accuracy. 517
518
4.3. Case #3: The Thunderstorm at 1818 UTC on 7 February 2012 519
Figure 8 shows the time-height plots for the thunderstorm that showed a relatively 520
strong total lightning flash rate (2.5 flashes min-1) observed on 7 February 2012. This 521
thunderstorm developed during the late afternoon at 1818 UTC (1618 LT) and produced 522
its first IC (CG) flash 31 min (38 min) after the initial radar echo. Actually, one can note 523
Page 22
22
a rapid intensification of the thunderstorm between 9 and 20 min after the initial radar 524
echo with strong reflectivity (46 dBZ) and moderate ZDR (+2.3 dB) reaching up to the 8 525
km altitude (-23 °C level). The formation of the initial ice hydrometers is indicated by 526
the appearance of the negative ZDR (-0.1 dB) at 20 min close to the cloud top (10 km 527
altitude, -38 °C). When the first IC flash occurred (between 29-31 min after the first 528
radar echo) is observed a strong ZDR (+3.5 dB) and KDP (+3 ° km-1) close to 7 km 529
altitude (-16 °C), suggesting a rapid increase in the concentration of supercooled 530
raindrops, which have contributed for the initial formation of the ice crystals and 531
graupel in this layer. The ice crystals formation occurs through activation of ice nuclei 532
within the updraft or associated with ice multiplication processes. The Hallet-Mossop 533
(H-M) mechanism [Hallett and Mossop 1974] is largely accepted as a dominant ice 534
multiplication process and occurs as small ice splinter from graupel growing by riming 535
of supercooled droplets in temperature-range between -3oC and -8oC. 536
After that time, and leading up to the time of the first CG flash (at approximately 35 537
min), the IC flash rate increased. At 37 min time a column of negative KDP (Figure 8c, 538
minimum of -1.0 ° km-1 at 6 km altitude, ~ -9 °C) was observed in the altitude-range 539
between 6 and 14 km (between -9 ° and -64 °C), while the ρHV value (Figure 8d) close 540
to 10 km altitude decreased dramatically from 0.97 to 0.83, between the time of the first 541
IC flash (at 30 min) and the time of the first CG flash (at 35 min), indicating the 542
freezing of hydrometers and a mixture with supercooled raindrops. In fact, in the mixed-543
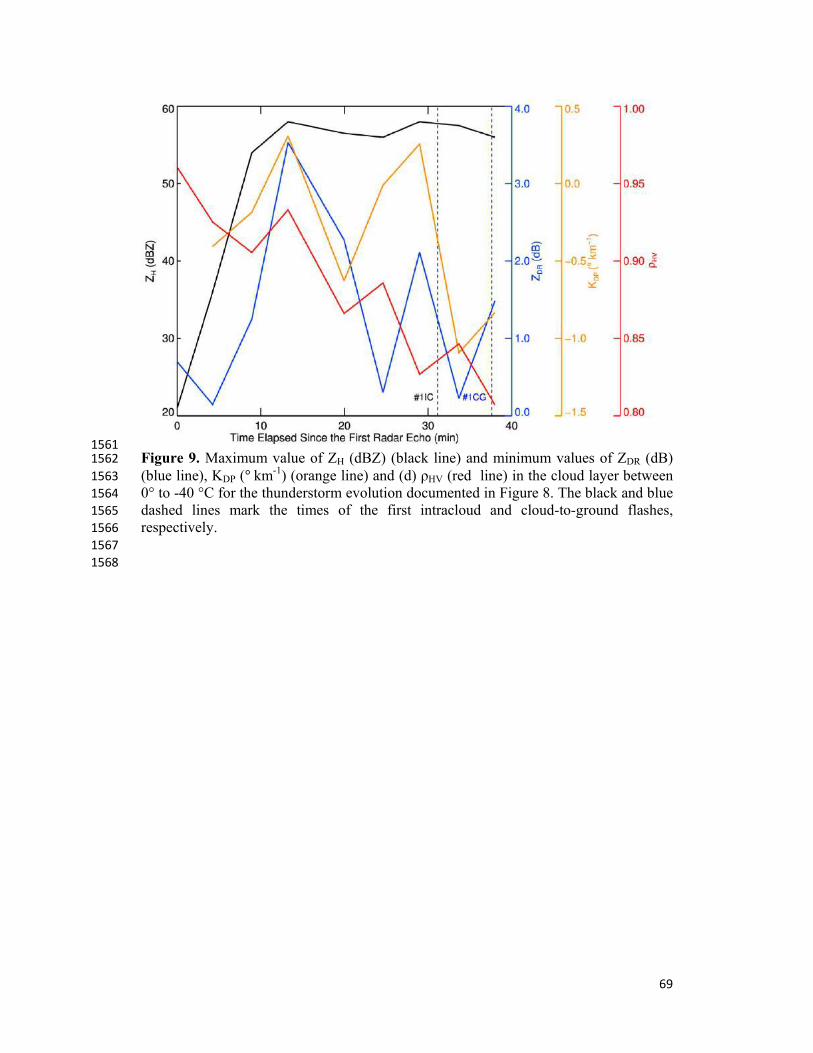
layer, ZDR and KDP reached their minimum values (+0.2 dB and -1.1 ° km-1) and strong 544
reflectivity (> 55 dBZ) prior to the CG flash time (Figure 9), probably associated with 545
signatures from conical graupel. 546
The aforementioned observations are more evidenced in the vertical cross sections 547
(Figure 10). We can note a slow increase in ZH in the thunderstorm during the first 13 548
Page 23
23
min (Figures 10a-d) before the convection became intense. Two convective towers with 549
large ZH and ZDR indicating strong updrafts were observed at distance-range 12 km and 550
17 km, respectively, extending up to approximately -15 °C (Figure 10e). At 1843 UTC 551
(Figure 10f), these convective towers began to merge, and a deep and narrow column 552
with positive ZDR (+3.5 dB) and moderate ρHV (~ 0.95) in the 14 km distance-range 553
formed, demonstrating the lofting of supercooled raindrops by strong updrafts. The first 554
IC flash was recorded in a radar image at 1847 UTC (Figure 10g) at approximately the -555
10 °C isotherm at time that the +ZDR-column decreased and the cells with strong ZH 556
completely merged. Additionally, the strong ZH (55-60 dBZ) up to the -40 °C level 557
suggested the existence of strong updrafts promoting the lofting of raindrops, which are 558
freezing on the graupel surface. 559
These regions with strong updrafts are inferred indirectly from observations of +ZDR-560
columns with strong ZH. At the time of the first CG flash, at 1852 UTC (Figure 10h), a 561
large region with negative ZDR and KDP down to the -15 °C level, suggests the freezing 562
of supercooled raindrops and the formation of conical graupel. Probably the graupel 563
grows to a size too large by be sustained by updrafts and then begin to fall and 564
ultimately melt, promoting the formation of large raindrops close to the surface. 565
Although the initiation regions of both IC and CG flashes show evidence for similar 566
microphysical conditions, one could suggest that a large region with strong negative 567
ZDR and KDP in the altitude range above the -15 °C isotherm is a predominant signature 568
at the time of the first CG flash. 569
Although the last two cases evidenced distinct and separate double reflectivity maxima 570
(which indicated the existence of two distinct updraft maxima regions), the merging of 571
two updrafts columns in this case seems not a physical requirement for lightning 572
occurrence. The majority (80 % of 46 cases) of the thunderstorms in this study showed 573
Page 24
24
only one reflectivity maximum (not shown). These results are consistent with Goodman 574
et al. [1988] that documented the first IC flash after that hail was initially indicated by 575
radar, during a period of rapid vertical development as the cloud top neared its 576
maximum height and the first CG flash when the maximum reflectivity core descended. 577
Instead, the pronounced positive ZDR in the layer between 0° and -15°C, followed by a 578
decrease in the ZDR in this region is the most consistent characteristic of the storm 579
evolution to lightning occurrence documented in this study. 580
581
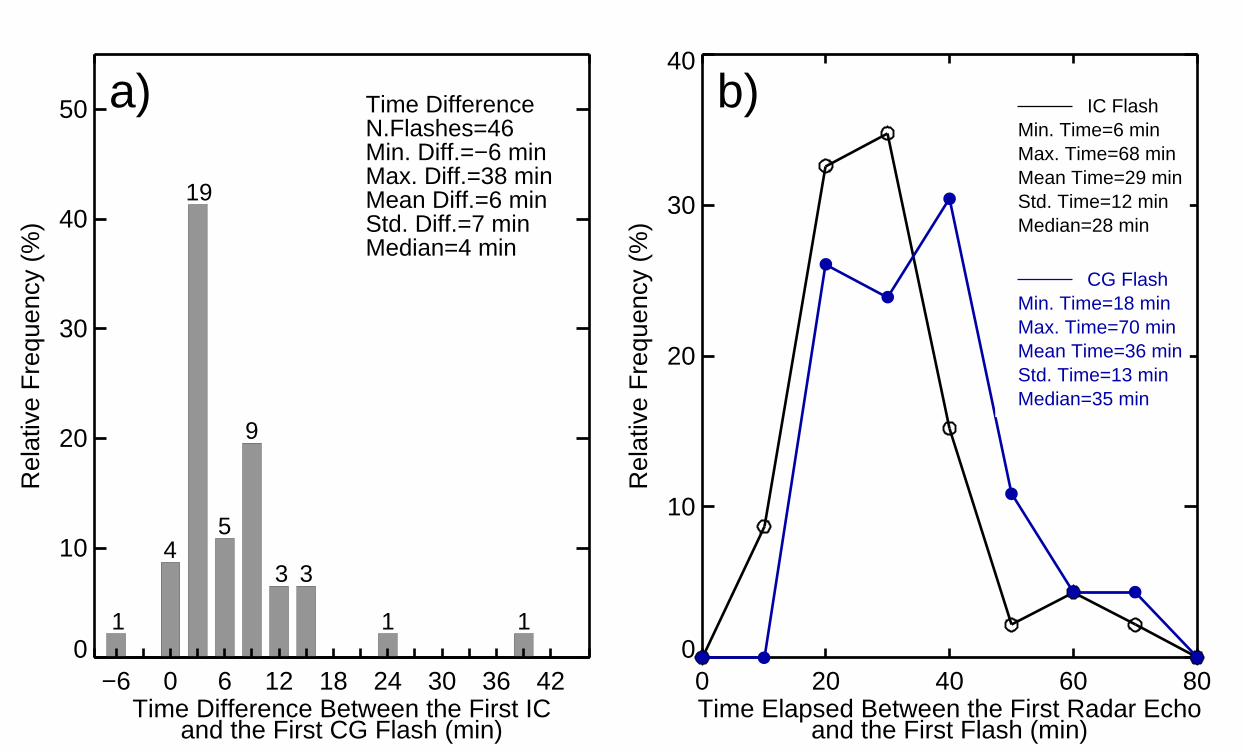
5 Statistical Evaluation of the 46 Thunderstorms 582
This section presents the general behavior of the 46 thunderstorm life cycles selected in 583
this study. Initially, the time lag between the first IC and the first CG flashes (Figure 584
11a) and the time lag between the first radar echo and the occurrence of the first IC and 585
CG flashes (Figure 11b) were computed. For the large majority (98 %) of the 586
thunderstorms, an IC flash preceded the first CG flash. Note that the mean time 587
difference between IC and CG flashes was approximately 6 min and the median time 588
difference was about 4 min. Only one thunderstorm exhibited a CG flash as its first 589
flash. This overall behavior bears a close similarity to the earlier results (considering the 590
mean values), particularly Workman and Reynolds [1949] (6 min), Goodman et al. 591
[1988] (5 min), Williams et al [1989] (6 min), Harris et al. [2010] (4.7-6.9 min), Seroka 592
et al. [2012] (2.4 min) and Stolzenburg et al. [2015] (4.6 min). These results suggest that 593
the predominance of the IC lightning in early stages is likely due to the vertical velocity 594
and growth of ice particles and radar reflectivity above the negatively charged center. 595
On the other hand, the occurrence of CG lightning has been documented in previous 596
studies close to regions with graupel and hail descending below the negative charge 597
center [Goodman et al., 1988; Carey and Rutledge, 1996; López and Aubagnac, 1997; 598
Page 25
25
Tessendorf et al., 2007]. The three case studies previously presented (i.e., Figures 4, 7 599
and 10) corroborate these findings, showing the first IC preceding the first CG flash at 600
the boundary of the negative ZDR layer. Figure 11b shows IC flashes occurring, on 601
average, approximately 29 min after the initial radar echo, while CG flashes were most 602
frequently delayed by approximately 36 min. For some thunderstorms, the first flash 603
occurs as much as 50 min later, or more. Studies using satellite only [Harris et al., 604
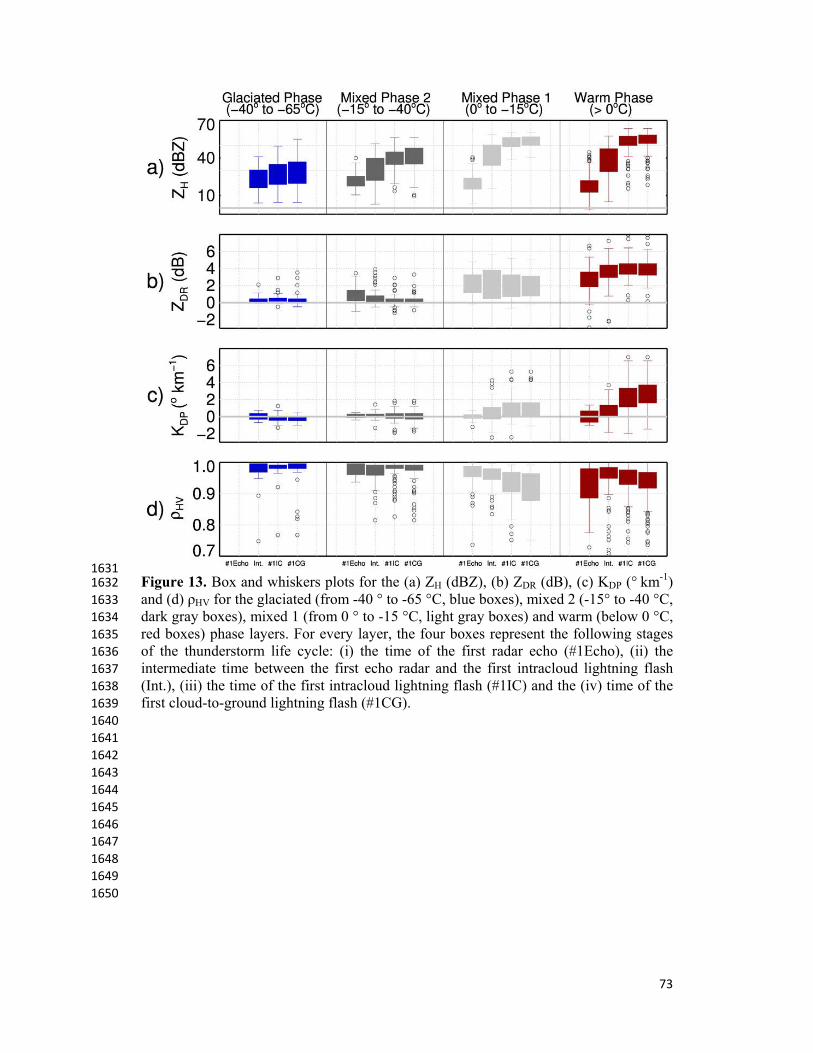
2010] or a combination of satellite and radar [Mecikalski et al., 2013] have documented 605
a time elapsed for the lightning initiation on the order of 30-60 min. Since sensors on 606
geostationary satellites detect clouds rather than precipitation, larger time differences 607
are expected in comparison to those values documented in our study. Other studies 608
employing radar reflectivity values at various heights have documented lead times for 609
lightning initiation of about 10-20 min [Dye et al., 1989; Buechler and Goodman, 1990; 610
Hondl and Eilts, 1994; Gremillion and Orville, 1999; Vincent et al., 2004; Yang and 611
King, 2010; Mosier et al., 2011]. The time elapsed to the lightning initiation depends on 612
the criterion used to define the first radar echo or cloud initiation and the environmental 613
instability conditions. In our case we have considered as the first radar echo any 614
reflectivity value (any value above the local noise floor of the radar), at any height. The 615
detection of this earlier first echo could be responsible for the long time observed. In 616
addition, the thunderstorms selected from CHUVA-Vale campaign are small compact 617
and isolated, and grew in an environmental with low-to-moderate Convective Available 618
Potential Energy (CAPE) and low wind shear, indicating a slow growth of precipitating 619
cells and hydrometers. Consistent with this approach, Mecikalski et al. [2013] have 620
compared two groups of storms, with smaller (1458 J kg-1) and greater (2512 J kg-1) 621
CAPE and found that the smaller CAPE storms are characterized by slower and steadier 622
or development rates. The storms with lower CAPE likely possess weaker updrafts and 623
Page 26
26
display earlier development of warm rain processes. We believe, when organized 624
mesoscale system is considered, we should expect a shorter time. This supports the idea 625
on the existence of the slower thunderstorm development associated with an early warm 626
rain phase in the developing cloud. As consequence of this slow process, the graupel 627
and ice crystals in the mixed-layer takes a longer time to grow and activate the lightning 628
initiation. Moderate CAPE supports the likely occurrence of moderate updrafts in these 629
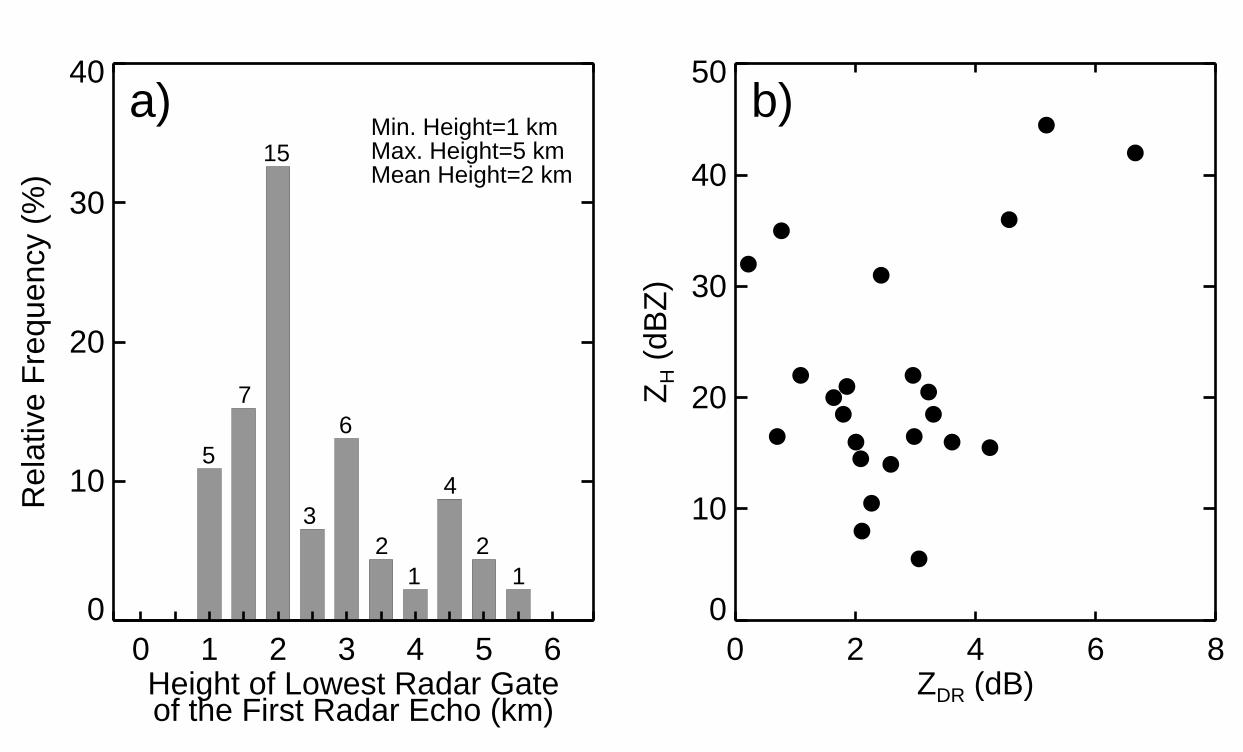
small thunderstorms, leading to a moderate incloud charging process. In fact, for the 630
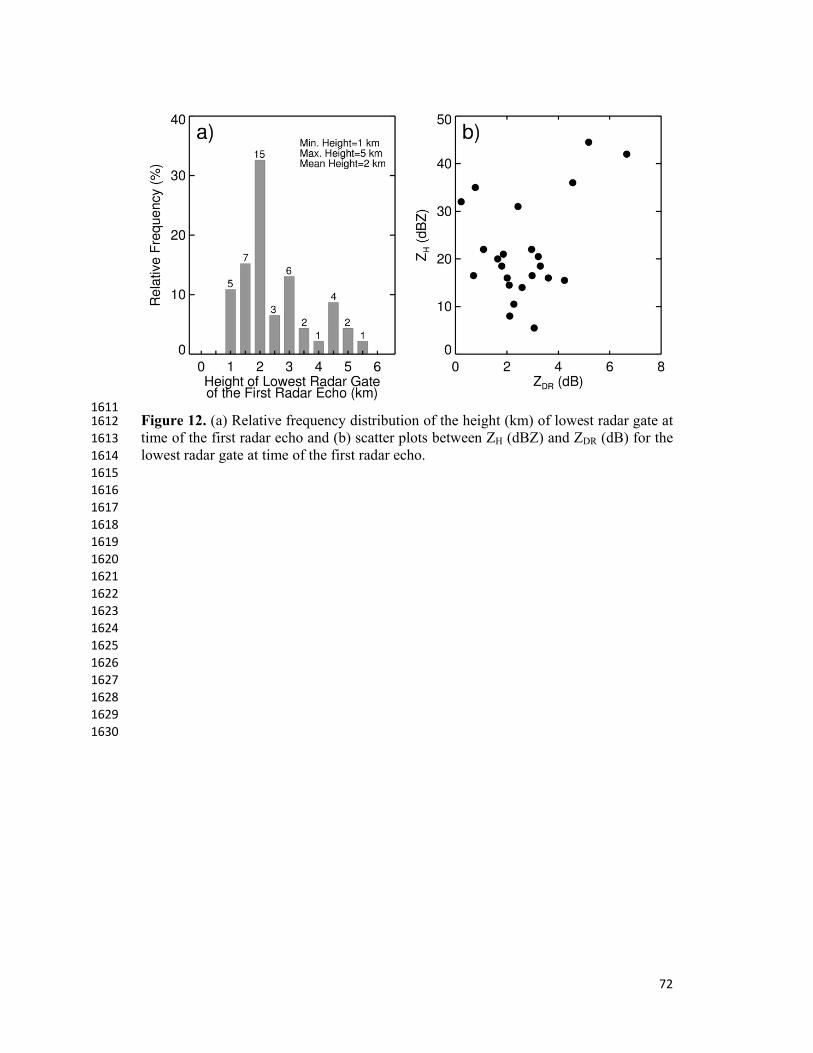
great majority (85%) of the thunderstorms, the first echoes are warm rain echoes (Figure 631
12a) with mean height around 2 km and have weaker ZH (25 dBZ) related to moderate 632
ZDR (up to +4 dB) (Figure 12b). These observations are consistent with the results 633
presented by Tuttle et al. [1989] that documented the storm’s first echo below the 634
melting level, suggesting precipitation development was through warm rain processes 635
(e.g., accretion and coalescence growth). In contrast for these results, Martinez [2001] 636
documented the first heights in the cold part of the clouds, and many at 7-8 km height in 637
a dry environmental during the STEPS at eastern Colorado. These results suggest that 638
the air in which the thunderstorms are growing is relatively moist and clean, or the 639
ascent speed close to the cloud base height is on the low side (to enable more time for 640
warm rain coalescence). 641
In order to evaluate the statistical distribution of the polarimetric variables, whisker 642
plots were compiled for all thunderstorms, for each cloud’s altitude range at different 643
life cycle times. The thunderstorm life cycle was studied at four specific times: i) the 644
time of the first radar echo, ii) the intermediate time between the first radar echo and the 645
first IC flash, iii) the time of the first IC flash and iv) the time of the first CG flash. 646
Hereafter the analysis will focus on these four times, which are named: #1Echo, Int., 647
#1IC and #1CG. Consistent with the procedure followed by Mattos et al. [2016], radar 648
Page 27
27
vertical profiles of the thunderstorm can be separated into four altitude layers: i) warm 649
(below 0 °C), ii) mixed 1 (from 0 ° to -15 °C), iii) mixed 2 (-15° to -40 °C) and iv) 650
glaciated phase (from -40 ° to -65 °C). These layers were chosen due to the different 651
physical behaviors related to the thunderstorm electrification process observed by 652
Mattos et al. [2016]. Figure 13 presents the whisker plots for all four thunderstorm 653
layers in the four different lifetimes. 654
Generally, the initial radar echo in the warm layer of thunderstorms shows ZH greater 655
than 10 dBZ, suggesting the cloud growth associated with initial updrafts in the life 656
cycle stages (Figure 13a, red boxes, #1Echo). We should remember that the maximum 657
ZH value was chosen by PPI in this study, and this certainly influences the higher ZH 658
values found in the analysis. We note that ZH in the warm layer (Figure 13a, red boxes) 659
exhibits the major differences among the polarimetric variables over the thunderstorm 660
life cycle (from #1Echo to #1CG). This result indicates that hydrometeors with different 661
sizes can be inferred prior to the first CG flash. Note that ρHV (Figure 13d, red boxes) in 662
the warm layer shows a certain variability; it is larger at the time of the first radar echo, 663
probably associated with the large differences in droplet sizes, and then decreases 664
slightly as the thunderstorm evolves to the first CG flash. Although, very large 665
raindrops (> 2 mm in diameter) represent a only a small percentage (< 4 %) of the 666
raindrops observed in the warm layer for this study (not shown), resonance effects and 667
non-Rayleigh regime produced by these raindrops could be contributing to the strong 668
positive ZDR (above +5 dB) and low ρhv (below 0.90) values observed in the warm layer 669
[Ryzhkov and Zrnic, 2005]. 670
The distribution of KDP (Figure 13c, red boxes) presents a spreading leading to the time 671
of the first CG flash in the warm layer, suggesting the formation of a strong 672
concentration of flattened raindrops. In part, it is possible that the dispersion observed in 673
Page 28
28
KDP in the warm layer is linked to nonuniform beam filling effects [NBF, Gosset, 2004; 674
Ryzhkov and Zrnic, 2005]. However, important to note that comparisons between the 675
polarimetric variables from the T-matrix method using a Joss disdrometer and the 676
variables estimated by the XPOL radar showed a median disagreement (radar-677
disdrometer) in KDP of -0.07 ° km-1, indicating that NBF effects likely has reduced 678
impact in this study. 679
The KDP distribution at the time of the first IC and CG flashes in the mixed 1 layer 680
(Figure 13c, light gray boxes) were similar; i.e., both distributions show large positive 681
KDP (up to +1.5 ° km-1). A large variability in the intermediate time in this layer was 682
also noted. This is possibly related to the +ZDR-column, which is better defined at the 683
intermediate stage, followed by the +ZDR-column collapse, resulting in an average 684
behavior for this layer. The spreading of the ρHV (Figure 13d, light gray boxes) for low 685
values is noteworthy and is only observed at the time of the first CG flash, indicating 686
that mixture between supercooled raindrops and freezing hydrometers is predominant at 687
this time. On the other hand, in the mixed 2 layer (Figures 13b-c, dark gray boxes), 688
there is evidence for the freezing of large concentrations of supercooled raindrops, 689
indicated by a narrowing of the ZDR distribution and by ZDR approaching near-to-zero 690
values, while the KDP distribution reached negative values before the time of the CG 691
flash. In the glaciated layer (Figures 13c, blue boxes) the KDP distribution was narrow 692
and predominantly negative (down to -0.6 ° km-1), and ZH was as strong as 55 dBZ at 693
time of the first IC and CG flashes. This demonstrates that large concentration of ice 694
crystals with different sizes, such as plates or columns, were oriented vertically by a 695
strong electric field. Indeed, the existence of columnar crystals between -40 ° to -70 °C 696
is the likely cause of the negative ZDR and KDP, which was suggested by an actual ice 697
habit diagram [Bailey and Hallett, 2009]. However, some large positive and outlier 698
Page 29
29
values (> +1.5 dB) for ZDR in the glaciated layer could in part is associated with cross 699
coupling effects of the horizontally and vertically transmitted waves caused by 700
vertically-oriented ice crystals in the mixed layer [Hubbert et al. 2014b]. The subtle 701
differences in terms of polarimetric variables between the time of the first IC and CG 702
flashes in the mixed and glaciated layers are often a result of the initial IC and CG 703
flashes belonging to the same radar volume scan. 704
To build a description of the average thunderstorm life cycle, the mean polarimetric 705
variables were computed for the different cloud altitude ranges (Figure 14). In the warm 706
layer (Figure 14a), an increase in ZH, ZDR and KDP was observed up to the time of the 707
first IC flash (from #1Echo to #1CG), suggesting the formation of large raindrops by 708
this time. The average ρHV in the warm layer decreased from the intermediate stage to 709
the time of the first CG flash, suggesting the existence of melting graupel or a mixture 710
of melting graupel and large raindrops in this layer. In the mixed 1 layer (Figure 14b), 711
KDP and ZH dramatically increased, indicating the intrusion of supercooled raindrops in 712
this layer, and at the same time ρHV decreased, indicating the mixing of hydrometeors as 713
the thunderstorms evolve to the time of the first CG flash. In this layer (mixed 1 layer, 714
Figure 14b), ZDR shows the most notable behavior, an increase up to the intermediate 715
stage, followed by a sharp decrease at the time of the first IC flash, indicating the 716
freezing of supercooled raindrops aloft. In the mixed 2 layer (Figure 14c), it is clear that 717
the formation of negative ZDR and KDP indicate that graupel is likely forming via the 718
accretion of supercooled cloud water in this layer. 719
In the glaciated layer, KDP (Figure 14d) shows a striking characteristic; i.e., KDP 720
dramatically decreased to negative values during thunderstorms evolution, suggesting 721
rapid formation of ice particles and an electric field capable of orienting these 722
hydrometeors vertically. Negative KDP was documented by several works, such as 723
Page 30
30
Caylor and Chandrasekar [1996], Tessendorf et al. [2007], Lang and Rutledge [2008], 724
Dolan and Rutledge [2009] and Ventura et al. [2013]. This result shows that the mean 725
polarimetric information has typical signatures for each lifetime step of the 726
thunderstorms electrification process. In the mixed 1 layer, both KDP and ZDR have 727
remarkable signatures, while in the glaciated layer the KDP behavior could be a good 728
indicator of the time of the first CG flash. 729
This general statistical analysis considered only the polarimetric variables separately. 730
Therefore, it is important to evaluate the relationships between the polarimetric 731
variables simultaneously in the layers. The joint interpretation of two or more 732
polarimetric variables from the same radar gate is much more effective and less prone to 733
uncertainty and non-uniqueness than single parameter analysis. This procedure often 734
provides the best clues for inferring cloud processes and precipitation properties. Figure 735
15 shows the scatter plots relating ZH and ZDR (left panels) and ZH and KDP (right 736
panels) for the four pre-defined altitude ranges (i.e., warm, mixed 1, mixed 2 and 737
glaciated layers) in the thunderstorms and for the four lifetime stages. The observations 738
in the warm phase layer (Figures 15a-b) provide a confident identification of the main 739
microphysical characteristics outlined in the previous analysis, indicating that the 740
largest ZH values (up to 67 dBZ) are associated with highly positive ZDR (up to +6 dB) 741
and KDP (up to +6.5 ° km-1), especially near the time of the first CG flash. This finding 742
demonstrates that the largest difference in the polarimetric fields remain confined to the 743
regions of deeper and larger updrafts. However, Figure 15b also reveals that the largest 744
ZH values may have a large range of KDP values from 0 to +6.5 ° km-1 in the warm layer, 745
which suggests in part a resonance effect [Ryzhkov and Zrnic, 2005] or nonuniform 746
beam filling effects [Gosset, 2004]. 747
Page 31
31
The mixed 1 layer (Figures 15c-d) revealed a slightly positive relationship between ZH, 748
ZDR and KDP. Notably, the initial stage of the mixed 1 layer was characterized by a ZH 749
above 20 dBZ with moderate ZDR (up to +4.5 dB) and Kdp (up to +1.0 ° km-1), indicating 750
the formation of initial supercooled drops. On the other hand, weaker differences are 751
noted between the time of the first IC and CG flash. However, we observed that the 752
largest positive KDP (+4.5 ° km-1) and ZH (60 dBZ) occurs at time of the first CG flash, 753
suggesting an evolution from supercooled liquid water to frozen drops. Additionally, it 754
is noted that a minimum in KDP (down to -1 ° km-1) was coincident with a near-to-zero 755
ZDR associated with strong ZH (up to 60 dBZ), which is consistent with the presence of 756
graupel and hail. The population of low ZDR observed in the mixed 1 layer could be 757
related to small hail, lump and/or conical graupel, or snow aggregates [Aydin and 758
Seliga, 1984; Evaristo et al., 2013]. As discussed by Kumjian et al. [2014], aggregates 759
are probably not the primary target because they are formed in weaker updrafts that 760
allow larger crystals to fall and collect smaller ice crystals. In this study, it is evident 761
that the first flash occurs in a region with deeper updrafts, which are favorable to the 762
formation of hail and graupel promoting the non-inductive cloud electrification 763
mechanism. 764
Notably, in the mixed 2 layer (Figures 15e-f), near-to-zero ZDR were predominant and 765
associated with ZH from 20 to 55 dBZ and negative KDP (down to -2 ° km-1) at the time 766
of the first CG flash. This demonstrates that hail and graupel are dominant signatures in 767
this layer. In contrast, negative KDP (down to -1 ° km-1) with moderate ZH (from 25 to 768
45 dBZ) are predominant signatures in the glaciated layer (Figures 15g-h). Larger ZH 769
(35-45 dBZ) values with negative KDP (down to -1 ° km-1) are consistent with signatures 770
from conical graupel [i.e., Evaristo et al., 2013; Bringi et al., 2016]. However, since 771
these reflectivity values represent the maximum ZH extracted in each elevation angle, 772
Page 32
32
this approach is masking some of the strongest negative KDP and ZDR values associated 773
with vertical ice crystals. Consistent with this picture, the vertical cross sections 774
(Figures 4, 7 and 10) showed that both negative KDP (-0.3°km-1) and ZDR (-2 dB) values 775
are more prevalent at low reflectivity (20-30 dBZ) than at higher values in the region 776
above the -40oC level in the cloud. Therefore, although conical graupel probably is 777
present (dominating the ZH signatures and which may is masking the signatures from 778
vertical ice crystals) the existence of vertically-aligned ice crystals by strong electric 779
field is prevalent and notable when considering the whole glaciated layer. As suggested 780
by Weinheimer and Few [1987] and by an actual ice habit diagram in Bailey and Hallett 781
[2009], these ice particles are likely plates or columns; although columnar crystals 782
between -40 ° to -70 °C are much more likely to align than plate-like crystals. 783
784
6 Discussion and Conclusions 785
This study describes the polarimetric characteristics as a function of the life cycle in 786
different cloud layers to estimate thunderstorm microphysical properties from the time 787
of the first radar echo until the production of the first IC and CG lightning flashes. 788
Observations of 46 thunderstorms during the 2011/2012 spring-summer in Southeast 789
Brazil with an XPOL radar and two- and three-dimensional Lightning Location Systems 790
demonstrated the key parameters in different layers related to the initial electrification 791
process in these thunderstorms. 792
A discussion of three case studies in details revealed the main characteristics of the 793
thunderstorms life cycle. Time-height plots and vertical cross sections of thunderstorms 794
lifecycle evolution were the basis for this analysis. The study cases showed highly 795
positive ZDR and KDP columns extending up to the -15 °C isotherm prior to the first IC 796
and CG flashes, suggesting a lofting of supercooled raindrops by strong updrafts 797
Page 33
33
feeding the production of hail or conical graupel. We observed that these +ZDR-columns 798
extended to higher levels, with a region aloft characterized by a negative ZDR signature, 799
indicating the likely existence of highly charged ice and graupel hydrometeors. The first 800
IC flash was observed at the top of the +ZDR-column in the central dipole region close to 801
the -16 °C (7 km) isotherm, followed by the first CG flash observed below of this layer. 802
The thunderstorm configuration at this time showed a strong heterogeneous horizontal 803
distribution of hydrometeors. These characteristics were clearly observed on a case-by-804
case basis as well as in the statistical analysis. There was notably a minimum ρHV on the 805
boundary of the positive ZDR and negative ZDR regions (Figures 4, 7 and 10) indicating a 806
freezing zone, as a result of the mixture of ice and liquid particles. This result is 807
consistent with other observations of reduced ρHV or even enhanced linear 808
depolarization ratio (LDR) near the tops of ZDR-columns [Bringi et al. 1997; Hubbert et 809
al. 1998; Smith et al. 1999; Kumjian et al. 2014; Snyder et al. 2015]. Hubbert et al 810
[1998] documented through polarimetric radar measurements that regions with low ρHV 811
(94-96) were coincident with regions of strong LDR (>= -22 dB) and strong Z (40–50 812
dBZ) at the top of the positive ZDR column, consistent with a mix of supercooled 813
drops, partially frozen drops, and asymmetric wet graupel. In addition, Smith et al. 814
[1999] presented comparisons between T-28 aircraft measurements and LDR in 3-cm 815
radar observations in mixed-phase regions that showed the presence of drops in the 816
process of freezing in regions with enhanced LDR signatures atop ZDR-columns. 817
The composite analysis considering all thunderstorms was largely consistent with the 818
aforementioned cases. The statistical analysis of the 46 cases showed contrasts in the 819
polarimetric signatures throughout the thunderstorm life cycle. The decrease of KDP to 820
negative values in the glaciated layer, from the time of the first development of the 821
glaciated layer up to the time of the first CG flash, was clearly observed. This is likely 822
Page 34
34
related to the high concentrations of ice crystals, such as like plates and columns, being 823
vertically-aligned by a strong electric field. The most important aspect of the 824
observations going into this paper, which came originally from the visual examination 825
of a large number of thunderstorms, is that an initial +ZDR (associated with supercooled 826
raindrops) evolved to reduced ZDR (and even negative values) in the mixed 1 layer 827
before and during the time of the initial lightning, suggesting an evolution from 828
supercooled raindrops to frozen particles, and the formation of graupel. 829
Based on the above description, it is possible to develop a conceptual model of earlier 830
electrification for isolated thunderstorms (Figure 16). The initial stage (Figure 16a) of 831
thunderstorms is dominated by small raindrops growing by coalescence in the updrafts 832
in the warm layer. If the upward air motion is sufficient, some of these raindrops may 833
reach a height above the melting level and start to grow rapidly through collection of 834
small droplets. The updraft intensifies and a well-defined +ZDR-column (with mean 835
value +1-2 dB) containing supercooled liquid raindrops is produced after a mean time of 836
15 min (Figure 16b). The eventual reduction in reflectivity of the +ZDR-column is 837
associated with the phase change in freezing raindrops and the attendant change in 838
dielectric constant, and is followed by the appearance of negative ZDR. The existence of 839
a mixture of supercooled drops and partially frozen drops, with a variety of shapes and 840
dielectric constant, is likely responsible for the low ρHV observed at the top of the ZDR-841
columns, and further supports the importance of mixed-phase hydrometeors in this 842
region. Atlas [1966] and Lhermitte and Williams [1985] recognized this location as the 843
“balance level” (6-7 km MSL), where the particle mean terminal velocity is equal in 844
magnitude to the upward air motion. This level is favorable to the formation of 845
relatively large precipitation particles (graupel and small hail, associated with radar 846
reflectivity in the range 45 and 50 dBZ) suspended in an updraft. By this time, the 847
Page 35
35
strong updrafts promotes strong collision rate between the graupel and ice particles 848
leading to an increase in the initial cloud electrification. After 29 min (Figure 16c), the 849
conical graupel atop the +ZDR-column in the updraft grow to sizes too large to be 850
suspended, and accordingly they begin to fall out. As they descend through the updrafts, 851
more supercooled raindrops are collected and they are dragged down through the 852
melting level. The descent of the conical graupel and the progressive freezing of the 853
suspended supercooled raindrops marks the demise of the +ZDR-column. The 854
gravitational separation of charged ice crystals at higher levels and the oppositely 855
charged graupel in lower levels promotes the formation of a strong electric field and the 856
first IC flash is registered. Therefore, the +ZDR-column shows a well-defined lifecycle 857
consistent with plausible microphysics and suggests a potential for lightning 858
nowcasting. The maximum intensity of the +ZDR-column is reached before the first IC 859
flash (~ 15 min before), followed by a weakening of the column at the moment of the 860
first IC flash. By the mean time around 36 min (Figure 16d) after the first radar echo, 861
the strong electric field is sufficient to align the ice crystals close to the cloud-top 862
(above the -40oC isotherm) and the conical graupel are dominant between the melting 863
layer up to -15 oC. Ice crystals of many kinds (i.e., like columns and plates) are likely 864
aligned vertically by the electric field in the glaciated layer, as suggested by Weinheimer 865
and Few [1987]. At this time the strong electric field is intensified and the first CG flash 866
is registered. The large negative KDP in the glaciated layer and the decrease of ZDR in 867
the mixed 1 layer are systematic signatures before and during the time of the first CG 868
flashes. The supercooled raindrop characteristic of the +ZDR-column is a systematic 869
feature observable before the first IC flash of a developing thunderstorm. 870
Despite the fact that ZDR-columns in the mixed phase and negative KDP in the glaciated 871
layer have been investigated in many studies in association with lightning occurrence, 872
Page 36
36
many of the details of their development and their relationship with initial lightning 873
were not previously investigated in detail. Differently from previous studies, this work 874
provides an extensive documentation of the first IC and CG lightning flashes (for 46 875
thunderstorms) using two- and three-dimensional Lightning Location Systems together 876
with the time-resolved polarimetric observations for a special subset of storms with 877
lower attenuation. These thunderstorms are very compact clouds (avoiding mesoscale 878
effects) and this procedure enabled a simpler physical interpretation of early 879
thunderstorm development and with reduced radar attenuation characteristic of radars 880
operating at X-band. In addition, this study was carried out in another geographical 881
location, in another hemisphere in the tropics and the results presented in this work 882
provide statistical confirmation of the previous studies but for isolated tropical clouds, 883
giving additional information about the thunderstorm electrification life cycle. 884
Important practical applications are highlighted here. This model can be used to design 885
a nowcasting tool. Changes in the size and height of the +ZDR-column provide the 886
potential for the formation of graupel and ice crystals; which are fundamental conditions 887
for the lightning occurrence. This feature can also be used to estimate thunderstorm 888
strength and maturity, increasing the lead-time used for lightning nowcasting. 889
Additionally, a systematic observation of conical graupel (negative ZDR) in the mixed 1 890
layer and vertically-oriented ice crystals (negative KDP) in the upper levels of 891
thunderstorms may provide helpful information concerning thunderstorm vigor and its 892
lightning diagnostic. The description of the thunderstorm life cycle could also open new 893
opportunities for microphysical and lightning parameterization in cloud resolving 894
models, as well as for the testing of numerical models that describe the life cycle. Future 895
analyses should consider different meteorological contexts, the degree of baroclinicity, 896
Page 37
37
the effect of seasons, and different thunderstorm sizes to evaluate this conceptual model 897
for isolated thunderstorms. 898
899
Acknowledgments 900
We would like to thank the CHUVA project supported by Fundação de Amparo à 901
Pesquisa do Estado de São Paulo (FAPESP) with grant 2009/15235-8 and 2015/14497-902
0. The first author was financed with a graduate fellowship from FAPESP during his 903
PhD in Atmospheric Sciences at INPE, grant 2011/18217-0, and was financed with a 904
fellowship at MIT supported by FAPESP grant 2013/04292-6. The third author has 905
participated in the CHUVA-Vale campaign through FAPESP grant 2011/13673-8. We 906
thank R. Albrecht for her support and discussions of the SPLMA data. In addition, we 907
would like to thank S. Heckman and K. Naccarato for providing the reprocessed 908
lightning data from BrasilDAT. The data used in this work are free access and are 909
available in CHUVA project website (http://chuvaproject.cptec.inpe.br). 910
911
References 912
Albrecht, R. I., C. A. Morales, C. M. N. Iwabe, M. F. Saba, and H. Höller (2014), Using 913
lightning mapper array to evaluate the lightning detection signatures at different 914
technologies, paper presented at XV International Conference on Atmospheric 915
Electricity, International Commission on Atmospheric Electricity, Norman, OK, USA. 916
917
Atlas, D. (1966), The balance level in convective storms, J. Atmos. Sci., 23, 635-918
651,doi:http://dx.doi.org/10.1175/1520-0469(1966)023<0635:TBLICS>2.0.CO;2. 919
920
Page 38
38
Aydin, K., and T. A. Seliga (1984), Radar polarimetric backscattering properties of 921
conical graupel, J. Atmos. Sci., 41, 1887-1892, doi:http://dx.doi.org/10.1175/1520-922
0469(1984)041<1887:RPBPOC>2.0.CO;2. 923
924
Bailey, M. P., and J. Hallett (2009), A comprehensive habit diagram for atmospheric ice 925
crystals: confirmation from the laboratory, AIRS II, and other field studies, J. Atmos. 926
Sci., 66, 2888-2899, doi:http://dx.doi.org/10.1175/2009JAS2883.1. 927
928
Bailey, J. C., R. J. Blakeslee, L. D. Carey, S. J. Goodman, S. D. Rudlosky, R. Albrecht, 929
C. A. Morales, E. M. Anselmo, J. R. Neves, and D. E. Buechler (2014), São Paulo 930
Lightning Mapping Array (SP-LMA): Network assessment and analyses for 931
intercomparison studies and GOES-R proxy activities, paper presented at XV 932
International Conference on Atmospheric Electricity, International Commission on 933
Atmospheric Electricity, Norman, OK, USA. 934
935
Battan, L. J. (1973), Radar observation of the atmosphere, University of Chicago Press, 936
Chicago, USA. 937
938
Blakeslee, R. J., J. C. Bailey, L. D. Carey, S. J. Goodman, S. D. Rudlosky, R. Albrecht, 939
C. A. Morales, E. M. Anselmo, and J. R. Neves (2013), São Paulo Lightning Mapping 940
Array (SP-LMA): Network assessment and analyses for intercomparison studies and 941
GOES-R proxy activities, paper presented at CHUVA International Workshop, São 942
Paulo, SP, Brazil. 943
944
Page 39
39
Bringi, V., P. Kennedy, G. Huang, C. Kleinkort, M. Thurai, and B. Notaros (2016), 945
Dual-polarized radar and surface observations of a winter graupel shower with negative 946
Zdr column, J. Appl. Meteor. Climatol., doi:10.1175/JAMC-D-16-0197.1. 947
948
Bringi, V. N., D. A. Burrows, and S. M. Menon (1991), Multiparameter radar and 949
aircraft study of raindrop spectral evolution in warmbased clouds, J. Appl. Meteor., 30, 950
853-880, doi:10.1175/1520-0450(1991)030,0853:MRAASO.2.0.CO;2. 951
952
Bringi L. Liu, P. C. Kennedy, V. Chandrasekar, and S. A. Rutledge (1996), Dual 953
multiparameter radar observations of intense convective storms: The 24 June 1992 case 954
study, Meteor. Atmos. Phys., 59, 3-31, doi:10.1007/BF01031999. 955
956
Bringi, V. N., K. Knupp, A. Detwiler, L. Liu, I. J. Caylor, and R. A. Black (1997), 957
Evolution of a Florida thunderstorm during the Convection and 958
Precipitation/Electrification Experiment: The case of 9 August 1991, Mon. Wea. Rev., 959
125, 2131-2160, doi:10.1175/1520-0493(1997)125,2131:EOAFTD.2.0.CO;2. 960
Bringi, V. N., M. Thurai, and R. Hannesen (2007), Correcting the measured ZDR for 961
differential attenuation due to rain, in Dual-Polarization Weather Radar Handbook, 962
Selex-SI Gematronik, Neuss, Germany. 963
964
Bruning, E. C., W. D. Rust, T. J. Schuur, D. R. MacGorman, P. R. Krehbiel, and W. 965
Rison (2007), Electrical and polarimetric radar observations of a multicell storm in 966
TELEX, Mon. Wea. Rev., 135, 2525-2544, doi: http://dx.doi.org/10.1175/MWR3421.1 967
968
Page 40
40
Buechler, D. E., and S. J. Goodman (1990), Echo size and asymmetry: Impact on 969
NEXRAD storm identification, J. Appl. Meteor., 29, 962-969, doi: 970
http://dx.doi.org/10.1175/1520-0450(1990)029<0962:ESAAIO>2.0.CO;2. 971
972
Carey, L. D., and S. A. Rutledge (1996), A multiparameter radar case study of the 973
microphysical and kinematic evolution of a lightning producing storm, Meteorol. 974
Atmos. Phys., 59, 33-64, doi:10.1007/BF01032000. 975
976
Carey, L. D., and S. A. Rutledge (1998), Electrical and multiparameter radar 977
observations of a severe hailstorm, J. Geophys. Res., 103, 13979-14000, 978
doi:10.1029/97JD02626. 979
980
Carey, L. D., and S. A. Rutledge (2000), The Relationship between precipitation and 981
lightning in tropical island convection: A C-Band polarimetric radar study, Mon. Wea. 982
Rev., 128, 2687-2710, doi: http://dx.doi.org/10.1175/1520-983
0493(2000)128<2687:TRBPAL>2.0.CO;2 984
985
Carey, L. D., W. A. Petersen, and W. K. Deierling (2009), Radar differential phase 986
signatures of ice orientation for the prediction of lightning initiation and cessation, 987
paper presented at 34th Conference on Radar Meteorology, Amer. Meteor. Soc., 988
Williamsburg, VA, USA. 989
990
Caylor, I. J., and A. J. Illingworth (1987), Radar observations and modelling of warm 991
rain initiation, Q. J. R. Meteorol. Soc., 113, 1171-1191, doi: 10.1002/qj.49711347806. 992
Page 41
41
Caylor, I. F., and V. Chandrasekar (1996), Time-varying ice crystal orientation in 993
thunderstorms observed with multiparameter radar, IEEE Trans. Geosci. Electron., 34, 994
847-858, doi:10.1109/36.508402. 995
996
Chauzy, S., D. Raisonville, D. Hauser, and F. Roux (1980), Electrical and dynamical 997
description of a frontal storm deduced from the LANDES 79 experiment, paper 998
presented at Proc. Eighth Int. Conf. on Cloud Physics, Amer. Meteor. Soc, Clermont-999
Ferrand, France. 1000
1001
Conway, J. W., and D. S. Zrnic´ (1993), A study of embryo production and hail growth 1002
using dual-doppler and multiparameter radars, Mon. Wea. Rev., 121, 2512-2528, 1003
doi:http://dx.doi.org/10.1175/1520-0493(1993)121<2511:ASOEPA>2.0.CO;2. 1004
Dolan, B., and S. A. Rutledge (2009), A theory-based hydrometeor identification 1005
algorithm for X-band polarimetric radars, J. Atmos. Oceanic Technol., 26, 2071-2088, 1006
doi:http://dx.doi.org/10.1175/2009JTECHA1208.1. 1007
1008
Dye, J. E., J. J. Jones, W. P. Winn, T. A. Cerni, B. Gardiner, D. Lamb, R. L. Pitter, J. 1009
Hallett, and C. P. R. Saunders (1986), Early electrification and precipitation 1010
development in a small, isolated Montana cumulonimbus, J. Geophys. Res., 1231-1247, 1011
10.1029/JD091iD01p01231. 1012
1013
Dye, J. E., J. J. Jones, A. J. Weinheimer, and W. P. Winn (1988), Observations of two 1014
regions of charge during initial thunderstorm electrification, Q. J. R. Meteorol. Soc., 1015
114, 1271-1290, . 1016
1017
Page 42
42
Dye, J. E., W. P. Winn, J. J. Jones, and D. W. Breed (1989), The electrification of New 1018
Mexico thunderstorms. Part 1: Relationship between precipitation development and the 1019
onset of electrification, J. Geophys. Res., 94, 8643-8656, doi: 1020
10.1029/JD094iD06p08643. 1021
1022
Engholm, C. D., E. R. Williams, and R. M. Dole (1990), Meteorological and electrical 1023
conditions associated with positive cloud-to-ground lightning, Mon. Wea. Rev., 118, 1024
470-487, doi:10.1175/1520-0493(1990)118,0470:MAECAW.2.0.CO;2. 1025
1026
Evaristo, R., T. M. Bals-Elsholz, E. R. Williams, D. J. Smalley, M. F. Donovan, and A. 1027
Fenn (2013), Relationship of graupel shape to differential reflectivity: Theory and 1028
observations, paper presented at 93rd Amer. Meteor. Soc. Annual Meeting, Amer. 1029
Meteor. Soc., Austin, TX, USA. 1030
1031
Foster, T. C., and J. Hallett (2002), The alignment of ice crystals in changing electric 1032
fields, Atmos. Res., 62, 149-169, doi:10.1016/S0169-8095(02)00008-X. 1033
1034
Goodman, S. J., D. E. Buechler, P. D. Wright, W. D. Rust (1988), Lightning and 1035
precipitation history of a microburst-producing storm, 15, 1185-1188, Geophys. Res. 1036
Lett., doi: 10.1029/GL015i011p01185. 1037
1038
Goodman, S. J., R. Blakeslee, H. Christian, W. Koshak, J. Bailey, J. Hall, E. McCaul, 1039
D. Buechler, C. Darden, J. Burks, T. Bradshaw, and P. Gatlin (2005), The North 1040
Alabama Lightning Mapping Array: Recent severe storm observations and future 1041
prospects, Atmos. Res., 76 (1-4), 423-437, doi:10.1016/j.atmosres.2004.11.035. 1042
Page 43
43
Gosset, M. (2004), Effect of nonuniform beam filling on the propagation of radar 1043
signals at X-band frequencies. Part II: Examination of differential phase shift, J. Atmos. 1044
Oceanic Technol., 21, 358-367, doi: http://dx.doi.org/10.1175/1520-1045
0426(2004)021<0358:EONBFO>2.0.CO;2. 1046
1047
Gremillion, M. S., and R. E. Orville (1999), Thunderstorm characteristics of cloud-to-1048
ground lightning at the Kennedy Space Center, Florida: A study of lightning initiation 1049
signatures as indicated by the WSR-88D, Wea. Forecasting, 14, 640-649, doi: 1050
http://dx.doi.org/10.1175/1520-0434(1999)014<0640:TCOCTG>2.0.CO;2. 1051
1052
Hall, M. P. M., S. M. Cherry, J. W. F. Goddard, and G. R. Kennedy (1980), Rain drop 1053
sizes and rainfall rate measured by dualpolarization radar, Nature, 285, 195–198, 1054
doi:10.1038/285195a0. 1055
1056
Hall, M. P. M., Goddard, J. W. F., and S. M. Cherry (1984), Identification of 1057
hydrometeors and other targets by dual-polarization radar, Radio Science, 19, 32-140, 1058
doi: 10.1029/RS019i001p00132. 1059
1060
Hallett, J., and S. C. Mossop (1974), Production of secondary ice particles during the 1061
riming process, Nature, 249, 26-28, doi:10.1038/249026a0. 1062
1063
Harris, R. J., J. R. Mecikalski, W. M. Mackenzie Jr., P. A. Durkee, and K. E. Nielsen 1064
(2010), The definition of GOES infrared lightning initiation interest fields, J. Appl. 1065
Meteor. Climatol., 49, 2527-2543, doi: http://dx.doi.org/10.1175/2010JAMC2575.1. 1066
1067
Page 44
44
Herzegh, P. H., and A. R. Jameson (1992), Observing precipitation through dual-1068
polarization radar measurements, Bull. Am. Meteorol. Soc., 73, 1365-1374, 1069
doi: http://dx.doi.org/10.1175/1520-0477(1992)073<1365:OPTDPR>2.0.CO;2. 1070
1071
Homeyer C. R., and M. R. Kumjian (2015), Microphysical characteristics of 1072
overshooting convection from polarimetric radar observations, J. Atmos. Sci., 72, 870-1073
891, doi:http://dx.doi.org/10.1175/JAS-D-13-0388.1. 1074
1075
Hondl, K. D., and M. D. Eilts (1994), Doppler radar signatures of developing 1076
thunderstorms and their potential to indicate the onset of cloud-to-ground lightning, 1077
Mon. Wea. Rev., 122, 1818-1836, doi:http://dx.doi.org/10.1175/1520-1078
0493(1994)122<1818:DRSODT>2.0.CO;2. 1079
1080
Hubbert, J. C., V. N. Bringi, L. D. Carey, and S. Bolen (1998), CSUCHILL polarimetric 1081
radar measurements from a severe hail storm in eastern Colorado, J. Appl. Meteor., 37, 1082
749–775, doi:10.1175/1520-0450(1998)037,0749:CCPRMF.2.0.CO;2. 1083
1084
Hubbert, J. C., S. M. Ellis, W. -Y. Chang, and M. Dixon (2014), Modeling and 1085
interpretation of S-band ice crystal depolarization signatures from data obtained by 1086
simultaneously transmitting horizontally and vertically polarized fields, J. Appl. Meteor. 1087
Climatol., 53, 1659-1677, doi: http://dx.doi.org/10.1175/JAMC-D-13-0158.1. 1088
1089
Hubbert, J. C., S. M. Ellis, W.-Y. Chang, and Y.-C. Liou (2014), X-band polarimetric 1090
observations of cross coupling in the ice phase of convective storms in Taiwan, J. Appl. 1091
Meteor., 53, 1678-1695, doi: http://dx.doi.org/10.1175/JAMC-D-13-0360.1. 1092
Page 45
45
1093
Hubbert, J., and V. N. Bringi (1995), An iterative filtering technique for the analysis of 1094
copolar differential phase and dual-frequency radar measurements, J. Atmos. Oceanic 1095
Technol., 12, 643-648, doi:http://dx.doi.org/10.1175/1520-1096
0426(1995)012<0643:AIFTFT>2.0.CO;2. 1097
1098
Hubbert, J., V. N. Bringi, L. D. Carey, and S. Bolen (1998), CSU-CHILL polarimetric 1099
radar measurements from a severe hail storm in eastern Colorado, J. Appl. Meteor., 37, 1100
749-775,doi: http://dx.doi.org/10.1175/1520-450(1998)037<0749:CCPRMF>2.0.CO;2. 1101
1102
Illingworth, A. J., J. W. F. Goddard, and S. M. Cherry (1987), Polarization radar studies 1103
of precipitation development in convective storms, Q. J. R. Meteorol. Soc., 113, 469-1104
489, doi: 10.1002/qj.49711347604. 1105
Jameson, A. R., M. J. Murphy, and E. P. Krider (1996), Multiple-parameter radar 1106
observations of isolated Florida thunderstorms during the onset of electrification, J. 1107
Appl. Meteor., 35, 343-354, doi:http://dx.doi.org/10.1175/1520-1108
0450(1996)035<0343:MPROOI>2.0.CO;2. 1109
1110
Kennedy, P. C., S. A. Rutledge, W. A. Petersen, and V. N. Bringi (2001), Polarimetric 1111
radar observations of hail formation, J. Appl. Meteor., 40, 1347-1366, 1112
doi:10.1175/1520-0450(2001)040,1347:PROOHF.2.0.CO;2. 1113
1114
Krehbiel, P., T. Chen, S. McCrary, W. Rison, G. Gray, and M. Brook (1996), The use of 1115
dual channel circular-polarization radar observations for remotely sensing storm 1116
electrification, Meteor. Atmos. Phys., 59, 65-82, doi:10.1007/BF01032001. 1117
Page 46
46
1118
Krehbiel, P. R. (1986), The electrical structure of thunderstorms, The Earth's Electrical 1119
Environment, National Academy Press, Washington, DC, 90-113. 1120
1121
Kumjian, M. R., A. P. Khain, N. Benmoshe, E. Ilotoviz, A. V. Ryzhkov, and V. T. J. 1122
Phillips (2014), The anatomy and physics of ZDR columns: Investigating a polarimetric 1123
radar signature with a spectral bin microphysical model, J. Appl. Meteor. Climatol., 53, 1124
1820-1843, doi:http://dx.doi.org/10.1175/JAMC-D-13-0354.1. 1125
1126
Kumjian, M. R., and A. V. Ryzhkov (2008), Polarimetric signatures in supercell 1127
thunderstorms, J. Appl. Meteor. Climatol., 47, 1940-1961, 1128
doi:10.1175/2007JAMC1874.1. 1129
1130
Kumjian, M. R., S. M. Ganson, and A. V. Ryzhkov (2012), Freezing of raindrops in 1131
deep convective updrafts: A microphysical and polarimetric model, J. Atmos. Sci., 69, 1132
3471-3490, doi: http://dx.doi.org/10.1175/JAS-D-12-067.1. 1133
1134
Lang, T. J., and S. A. Rutledge (2008), Kinematic, microphysical, and electrical aspects 1135
of an asymmetric bow-echo Mesoscale Convective System observed during STEPS 1136
2000, J. Geophys. Res., 113, doi:10.1029/2006JD007709. 1137
1138
Lhermitte, R., and E. Williams (1985), Thunderstorm electrification: A case study, J. 1139
Geophys. Res., 90, 6071-6078, doi:10.1029/JD090iD04p06071. 1140
1141
Page 47
47
López, R. E., and J-P. Aubagnac (1997), The lightning activity of a hailstorm as a 1142
function of changes in its microphysical characteristics inferred from polarimetric radar 1143
observations, J. Geophys. Res., 102, 16799-16813, doi:10.1029/97JD00645. 1144
1145
Lund, N. R., D. R. MacGorman, T. J. Schuur, M. I. Biggerstaff, and W. D. Rust (2009), 1146
Relationships between lightning location and polarimetric radar signatures in a small 1147
Mesoscale Convective System, Mon. Weather Rev., 137, 4151-4170, 1148
doi:http://dx.doi.org/10.1175/2009MWR2860.1. 1149
1150
MacGorman, D. R., and Coauthors (2008), TELEX: The Thunderstorm Electrification 1151
and Lightning Experiment, Bull. Amer. Meteor. Soc., 89, 997-1013, 1152
doi:10.1175/2007BAMS2352.1. 1153
1154
Machado, L. A. T., M. A. F. Silva Dias, C. Morales, G. Fisch, D. Vila, R. Albrecht, S. J. 1155
Goodman, A. Calheiros, T. Biscaro, C. Kummerow, J. Cohen, D. Fitzjarrald, E. 1156
Nascimento, M. Sakamoto, C. Cunningham, J-P. Chaboureau, W. A. Petersen, D. 1157
Adams, L. Baldini, C. F. Angelis, L. F. Sapucci, P. Salio, H. M. J. Barbosa, E. 1158
Landulfo, R. F. Souza, R. Blakeslee, J. Bailey, S. Freitas, W. F. A. Lima, and A. Tokay 1159
(2014), The CHUVA Project - how does convection vary across the Brazil?, Bull. Am. 1160
Meteorol. Soc., doi: http://dx.doi.org/10.1175/BAMS-D-13-00084.1. 1161
1162
Marshall, T. C., M. Stolzenburg, P. R. Krehbiel, N. R. Lund, and C. R. Maggio (2009), 1163
Electrical evolution during the decay stage of New Mexico Thunderstorms, J. Geophys. 1164
Res., 114, D02209, doi:10.1029/2008JD010637. 1165
1166
Page 48
48
Martinez, M. (2001), The relationship between radar reflectivity and lightning activity 1167
at initial stages of convective storms, unpublished manuscript. 1168
1169
Mattos, E. V., and L. A. T., Machado (2011), Cloud-to-ground lightning and Mesoscale 1170
Convective Systems, Atmos. Res., 99, 377-390, doi:10.1016/j.atmosres.2010.11.007. 1171
1172
Mattos, E. V., L. A. T. Machado, E. R. Williams, and R. I. Albrecht (2016), 1173
Polarimetric radar characteristics of storms with and without lightning activity, J. 1174
Geophys. Res. Atmos., 121, doi:10.1002/2016JD025142. 1175
1176
McCaul Jr, E. W., S. J. Goodman, K. M. LaCasse, and D. J. Cecil (2009), Forecasting 1177
lightning threat using cloud-resolving model simulations, Wea. Forecasting, 24, 709-1178
729, doi: http://dx.doi.org/10.1175/2008WAF2222152.1. 1179
1180
Mecikalski, J. R., X. LI, L. D. Carey, E. W. Mccaul Jr., and T. A. Coleman (2013), 1181
Regional comparison of GOES cloud-top properties and radar characteristics in advance 1182
of first-flash lightning initiation, Mon. Wea. Rev., 141, 55-74, doi: 1183
http://dx.doi.org/10.1175/MWR-D-12-00120.1. 1184
1185
Mecikalski, R. M., A. L. Bain, and L. D. Carey (2015), Radar and lightning 1186
observations of deep moist convection across Northern Alabama during DC3: 21 May 1187
2012, Mon. Wea. Rev., 143, 2774- 2794, doi: http://dx.doi.org/10.1175/MWR-D-14-1188
00250.1. 1189
1190
Page 49
49
Metcalf, J. I. (1993), Radar observations of the effects of changing electric fields of 1191
thunderstorms, Bull. Amer. Meteor. Soc., 74, 1080-1083. 1192
1193
Metcalf, J. I. (1995), Radar observations of changing orientations of hydrometeors in 1194
thunderstorms, J. Appl. Meteor., 34, 757-772, doi:10.1175/1520-1195
0450(1995)034,0757:ROOCOO.2.0.CO;2. 1196
1197
Metcalf, J. I. (1997), Temporal and spatial variations of hydrometeor orientations in 1198
thunderstorms, J. Appl. Meteor., 36, 315-321, doi:10.1175/1520-1199
0450(1997)036,0315:TASVOH.2.0.CO;2. 1200
1201
Mosier, R. M., C. Schumacher, R. E. Orville, and L. D. Carey (2011), Radar nowcasting 1202
of cloud-to-ground lightning over Houston, Texas. Wea. Forecasting, 26, 199-212, doi: 1203
http://dx.doi.org/10.1175/2010WAF2222431.1. 1204
1205
Naccarato, K., A. C. V. Saraiva, M. M. F. Sabo, and C. Schumann (2012), First 1206
performance analysis of BrasilDat total lightning network in southeastern Brazil, paper 1207
presented at International Conference on Grounding and Earthing and 5th International 1208
Conference on Lightning Physics and Effects, Bonito, MS, Brazil. 1209
1210
Nelson, L. A. (2002), Synthesis of 3-dimensional lightning data and weather radar data 1211
to determine the distance that naturally occurring lightning travels from thunderstorms, 1212
M.S. thesis, Dept. of Engineering Physics, Air Force Institute of Technology, Ohio, 1213
USA. 1214
1215
Page 50
50
Oue, M., M. R. Kumjian, Y. Lu, Z. Jiang, E. Clothiaux, J. Verlinde, and K. Aydin 1216
(2015), X-band polarimetric and Ka-band observations of a graupel-producing Artic 1217
mixed-phase cloud, J. Appl. Meteor., 54, 1335-1351, doi: 1218
http://dx.doi.org/10.1175/JAMC-D-14-0315.1. 1219
1220
Picca, J. C., and A. V. Ryzhkov (2012), A dual-wavelength polarimetric analysis of the 1221
16 May 2010 Oklahoma City extreme hailstorm, Mon. Wea. Rev., 140, 1385-1403, 1222
doi:10.1175/MWR-D-11-00112.1. 1223
1224
Picca, J. C., M. R. Kumjian, and A. V. Ryzhkov (2010), ZDR columns as a predictive 1225
tool for hail growth and storm evolution, paper presented at 25th Conf. on Severe Local 1226
torms, Amer. Meteor. Soc., Denver, CO, USA. 1227
1228
Prigent, C., E. Defer, J. R. Pardo, C. Pearl, W. B. Rossow, and J. P. Pinty (2005), 1229
Relations of polarized scattering signatures observed by the TRMM Microwave 1230
instrument with electrical processes in cloud systems, Geophys. Res. Lett., 32, L04810, 1231
doi:10.1029/2004GL022225. 1232
1233
Ramachandran, R., A. Detwiler, J. Helsdon Jr., P. L. Smith, and V. N. Bringi (1996), 1234
Precipitation development and electrification in Florida thunderstorm cells during 1235
Convection and Precipitation/Electrification Project, J. Geophys. Res., 101, 1599-1619, 1236
doi: 10.1029/95JD02931. 1237
1238
Page 51
51
Reynolds, S. E., M. Brook, and M. F. Gourley (1957), Thunderstorm charge separation, 1239
J. Meteor., 14, 426-436, doi:http://dx.doi.org/10.1175/1520-1240
0469(1957)014<0426:TCS>2.0.CO;2. 1241
1242
Reynolds, S. E., and M. Brook (1956), Correlation of the initial electric field and the 1243
radar echo in thunderstorms, J. Meteorol., 13, 376-380. 1244
1245
Ryzhkov, A. V. (2007), The Impact of beam broadening on the quality of radar 1246
polarimetric data, J. Atmos. Oceanic Technol., 24, 729-744, doi: 1247
http://dx.doi.org/10.1175/JTECH2003.1 1248
1249
Ryzhkov, A. V., V. B. Zhuravlyov, and N. A. Rybakova (1994), Preliminary results of 1250
X-band polarization radar studies of clouds and precipitation, J. Atmos. Oceanic 1251
Technol., 11, 132-139, doi:10.1175/1520-0426(1994)011,0132:PROXBP.2.0.CO;2. 1252
1253
Ryzhkov, A. V., and D. S. Zrnic (2005), Radar polarimetry at S, C, and X bands: 1254
Comparative analysis and operational implications, paper presented at 32nd Conference 1255
on Radar Meteorology, Amer. Meteor. Soc., Norman, OK, USA. 1256
1257
Ryzhkov, A. V., and D. S. Zrnic (2007), Depolarization in ice crystals and its effect on 1258
radar polarimetric measurements, J. Atmos. Oceanic Technol., 24, 1256-1267, doi: 1259
http://dx.doi.org/10.1175/JTECH2034.1. 1260
1261
1262
Page 52
52
Sakuragi, J., and T. Biscaro (2012), Determination of ZDR offset and their impact in the 1263
hydrometeor classification, paper presented at XVII Brazilian Meteorological 1264
Conference, Brazilian Meteorological Society, Gramado, RS, Brazil. 1265
1266
Schneebeli, M., J. Sakuragi, T. Biscaro, C. F. Angelis, I. C. da Costa, C. Morales, 1267
L. Baldini, and L. A. T. Machado (2012), Polarimetric X-band weather radar 1268
measurements in the tropics: Radome and rain attenuation correction, Atmos. Meas. 1269
Tech., 5, 2183-2199, doi: 10.5194/amt-5-2183-2012. 1270
1271
Seroka, G. N., R. E. Orville, and C. Schumacher (2012), Radar nowcasting of total 1272
lightning over the Kennedy Space Center, Wea. Forecasting, 27, 189-204, 1273
doi:http://dx.doi.org/10.1175/WAF-D-11-00035.1. 1274
1275
Smith, P. L., D. J. Musil, A. G. Detwiler, and R. Ramachandran (1999), Observations of 1276
mixed-phase precipitation within a CaPE thunderstorm, J. Appl. Meteor., 38, 145–155, 1277
doi:10.1175/1520-0450(1999)038,0145:OOMPPW.2.0.CO;2. 1278
1279
Snyder, J. C., A. V. Ryzhkov, M. R. Kumjian, A. P. Khain, and J. Picca (2015), A ZDR 1280
column detection algorithm to examine convective storm updrafts, Wea. Forecasting, 1281
30, 1819-1844, doi: http://dx.doi.org/10.1175/WAF-D-15-0068.1. 1282
1283
Stolzenburg, M., T. C. Marshall, P. R. Krehbiel (2015), Initial electrification to the first 1284
lightning flash in New Mexico thunderstorms, J. Geophys. Res., 120, 11,253-11,276, 1285
doi: 10.1002/2015JD023988. 1286
1287
Page 53
53
Straka, J. M., D. S. Zrnic´, and A. V. Ryzhkov (2000), Bulk hydrometeor classification 1288
and quantification using polarimetric radar data: Synthesis of relations, J. Appl. 1289
Meteor., 39, 1341-1372, doi:http://dx.doi.org/10.1175/1520-1290
0450(2000)039<1341:BHCAQU>2.0.CO;2. 1291
1292
Takahashi, T. (1978), Riming electrification as a charge generation mechanism in 1293
thunderstorms, J. Atmos. Sci., 35, 1536-1548, doi:http://dx.doi.org/10.1175/1520-1294
0469(1978)035<1536:REAACG>2.0.CO;2. 1295
1296
Tessendorf, S. A., S. A. Rutledge, and K. C. Wiens (2007), Radar and lightning 1297
observations of normal and inverted polarity multicellular storms from STEPS, Mon. 1298
Weather Rev., 135, 3682-3706, doi: http://dx.doi.org/10.1175/2007MWR1954.1. 1299
1300
Testud, J., E. L. Erwan, E. Obligis, and M. Ali-Mehenni (2000), The rain profiling 1301
algorithm applied to polarimetric weather radar, J. Atmos. Oceanic Technol., 17, 332-1302
356, doi: http://dx.doi.org/10.1175/1520-0426(2000)017<0332:TRPAAT>2.0.CO;2. 1303
1304
Tuttle, J. D., V. N. Bringi, H. D. Orville, and F. J. Kopp (1989), Multiparameter radar 1305
study of a microburst: Comparison with model results, J. Atmos. Sci., 46, 601-620, 1306
doi:10.1175/1520-0469(1989)046,0601:MRSOAM.2.0.CO;2. 1307
1308
Ventura, J. F., F. Honoré, and P. Tabary (2013), X-band polarimetric weather radar 1309
observations of a hailstorm, J. Atmos. Oceanic Technol., 30, 2143-2151, doi: 1310
http://dx.doi.org/10.1175/JTECH-D-12-00243.1. 1311
1312
Page 54
54
Vincent, B. R., L. D. Carey, D. Schneider, K. Keeter, and R. Gonski (2004), Using 1313
WSR-88D reflectivity for the prediction of cloudto-ground lightning: A central North 1314
Carolina study. Natl.Wea. Dig., 27, 35-44. 1315
1316
Weber, M. E., E. R. Williams, M. M. Wolfson, and S. J. Goodman (1998), An 1317
assessment of the operational utility of a GOES Lightning Mapping Sensor, Report 1318
Project NOAA-18 MIT Lincoln Laboratory, Lexington, MA, USA. 1319
1320
Weinheimer, A. J., and A. A. Few (1987), The electric field alignment of ice particles in 1321
thunderstorms, J. Geophys. Res., 92, 14 833-14 844, doi:10.1029/JD092iD12p14833. 1322
1323
Wiens, K. C., S. A. Rutledge, and S. A. Tessendorf (2005), The 29 June 2000 supercell 1324
observed during STEPS. Part II: Lightning and charge structure, J. Atmos. Sci., 62, 1325
4151-4177, doi: http://dx.doi.org/10.1175/JAS3615.1. 1326
1327
Williams E. R., D. J. Smalley, M. F. Donovan, R. G. Hallowell, K. T. Hood, B. J. 1328
Bennett, R. Evaristo, A. Stepanek, T. Bals-Elsholz, J. Cobb, J. Ritzman 1329
A. Korolev, and M. Wolde (2015), Measurements of differential reflectivity in 1330
snowstorms and warm season stratiform systems, J. Appl. Meteor. Climatol., 54, 573-1331
595, doi:http://dx.doi.org/10.1175/JAMC-D-14-0020.1. 1332
1333
Williams, E., D. Rosenfeld, S. Goodman, and D. Boccippio (2005), Thermodynamic 1334
conditions favorable to superlative thunderstorm updraft, mixed phase microphysics and 1335
lightning flash rate, Atmos. Res., 76, 288-306, doi:10.1016/j.atmosres.2004.11.009. 1336
1337
Page 55
55
Williams, E. R., E. V. Mattos, and L. A. T. Machado (2016), Stroke multiplicity and 1338
horizontal scale of negative charge regions in thunderclouds, Geophys. Res. Lett., 43, 1339
doi:10.1002/2016GL068924. 1340
1341
Williams, E. R., M. E. Weber, and R. E. Orville (1989), The relationship between 1342
lightning type and convective state of thunderclouds, J. Geophys. Res., 94 (D11), 1343
13213-13220, doi:10.1029/JD094iD11p13213. 1344
1345
Woodard, C. J., L. D. Carey, W. A. Petersen, and W. P. Roeder (2012), Operational 1346
utility of dual-polarization variables in lightning initiation forecasting, Electron. J. Oper. 1347
Meteor., 13, 79-102. 1348
1349
Workman, E. J., and S. E. Reynolds (1949), Electrical activity as related to 1350
thunderstorm cell growth, Bull. Am. Meteorol. Soc., 30, 142-144, 1949. 1351
1352
Yang, Y. H., and P. King (2010), Investigating the potential of using radar echo 1353
reflectivity to nowcast cloud-to-ground lightning initiation over Southern Ontario, Wea. 1354
Forecasting, 25, 1235-1248, doi: 10.1175/2010WAF2222387.1. 1355
1356
1357
1358
1359
1360
1361
1362
Page 56
56
FIGURE CAPTIONS LIST 1363
1364
Figure 1. Region of the CHUVA-Vale campaign with the localization of the X-band 1365
radar (gray shaded region), and the SPLMA (red filled circles) and BrasilDAT (blue 1366
stars) lightning sensors. Asterisks represent the locations of the 46 thunderstorms at the 1367
time of the first cloud-to-ground (CG) lightning flash. The gray dashed lines represent 1368
the distance rings (20, 60 and 100 km) from the radar. The minimum detectable radar 1369
reflectivity at 20 km and 60 km range were -4 dBZ and 9 dBZ, respectively. 1370
1371
Figure 2. Time-height plot of (a) ZH (dBZ), (b) ZDR (dB), (c) KDP (° km-1) and (d) ρHV 1372
for the thunderstorm observed at 1800 UTC on 20 February 2012. The horizontal 1373
dashed line marks the 0°C level as determined by the sounding data. The black vertical 1374
lines in the figures represent the times of the intracloud lightning flashes and the blue 1375
lines represent the cloud-to-ground lightning flashes. Arrows indicate the first 1376
intracloud (black) and the first cloud-to-ground (blue) flashes. 1377
1378
Figure 3. Maximum value of ZH (dBZ) (black line) and minimum values of ZDR (dB) 1379
(blue line), KDP (° km-1) (orange line) and (d) ρHV (red line) in the cloud layer between 1380
0° to -40 °C for the thunderstorm evolution documented in Figure 2. The black and blue 1381
dashed lines mark the times of the first intracloud and cloud-to-ground flashes, 1382
respectively. 1383
1384
Figure 4. Vertical cross sections of the polarimetric variables (ZH, ZDR, KDP and ρHV) of 1385
the thunderstorm evolution documented in Figure 2. The locations of the initiation 1386
points for the intracloud flashes are indicated with black circles and for the cloud-to-1387
Page 57
57
ground flashes by blue crosses. Symbols in white color indicate the first intracloud 1388
(Figure 4e) and cloud-to-ground flashes (Figure 4f). 1389
1390
Figure 5. Time-height plot of (a) ZH (dBZ), (b) ZDR (dB), (c) KDP (° km-1) and (d) ρHV 1391
for the thunderstorm observed at 1536 UTC on 22 January 2012. The horizontal dashed 1392
line marks the 0°C level as determined by the sounding data. The black vertical lines in 1393
the figures represent the times of the intracloud lightning flashes and the blue lines 1394
represent the cloud-to-ground lightning flashes. Arrows indicate the first intracloud 1395
(black) and the first cloud-to-ground (blue) flashes. 1396
1397
Figure 6. Maximum value of ZH (dBZ) (black line) and minimum values of ZDR (dB) 1398
(blue line), KDP (° km-1) (orange line) and (d) ρHV (red line) in the cloud layer between 1399
0° to -40 °C for the thunderstorm evolution documented in Figure 5. The black and blue 1400
dashed lines mark the times of the first intracloud and cloud-to-ground flashes, 1401
respectively. 1402
1403
Figure 7. Vertical cross sections of the polarimetric variables (ZH, ZDR, KDP and ρHV) of 1404
the thunderstorm evolution documented in Figure 5. The locations of the initiation 1405
points for the intracloud flashes are indicated with black circles and for the cloud-to-1406
ground by blue crosses. In Figure 7d the symbols in white color indicate the first 1407
intracloud and cloud-to-ground flashes. 1408
1409
Figure 8. Time-height plot of (a) ZH (dBZ), (b) ZDR (dB), (c) KDP (° km-1) and (d) ρHV 1410
for the thunderstorm observed at 1818 UTC on 7 February 2012. The horizontal dashed 1411
line marks the 0°C level as determined by the sounding data. The black vertical lines in 1412
Page 58
58
the figures represent the times of the intracloud lightning flashes, and the blue lines 1413
represent the cloud-to-ground lightning flashes. Arrows indicate the first intracloud 1414
(black) and the first cloud-to-ground (blue) flashes. 1415
1416
Figure 9. Maximum value of ZH (dBZ) (black line) and minimum values of ZDR (dB) 1417
(blue line), KDP (° km-1) (orange line) and (d) ρHV (red line) in the cloud layer between 1418
0° to -40 °C for the thunderstorm evolution documented in Figure 8. The black and blue 1419
dashed lines mark the times of the first intracloud and cloud-to-ground flashes, 1420
respectively. 1421
1422
Figure 10. Vertical cross sections of the polarimetric variables (ZH, ZDR, KDP and ρHV) 1423
of the thunderstorm evolution documented in Figure 8. The locations of the initiation 1424
points for the intracloud flashes are indicated with black circles and for the cloud-to-1425
ground by blue crosses. Symbols in white color indicate the first intracloud (Figure 10g) 1426
and cloud-to-ground flashes (Figure 10h). 1427
1428
Figure 11. Relative frequency distribution of the (a) time difference in minutes between 1429
the first intracloud (IC) and the first cloud-to-ground (CG) lightning flash and (b) 1430
elapsed time between the first radar echo and the first intracloud (black line) and the 1431
first cloud-to-ground (blue line) lightning flash for the 46 thunderstorms. 1432
1433
Figure 12. (a) Relative frequency distribution of the height (km) of lowest radar gate at 1434
time of the first radar echo and (b) scatter plots between ZH (dBZ) and ZDR (dB) for the 1435
lowest radar gate at time of the first radar echo. 1436
1437
Page 59
59
Figure 13. Box and whiskers plots for the (a) ZH (dBZ), (b) ZDR (dB), (c) KDP (° km-1) 1438
and (d) ρHV for the glaciated (from -40 ° to -65 °C, blue boxes), mixed 2 (-15° to -40 °C, 1439
dark gray boxes), mixed 1 (from 0 ° to -15 °C, light gray boxes) and warm (below 0 °C, 1440
red boxes) phase layers. For every layer, the four boxes represent the following stages 1441
of the thunderstorm life cycle: (i) the time of the first radar echo (#1Echo), (ii) the 1442
intermediate time between the first echo radar and the first intracloud lightning flash 1443
(Int.), (iii) the time of the first intracloud lightning flash (#1IC) and the (iv) time of the 1444
first cloud-to-ground lightning flash (#1CG). 1445
1446
Figure 14. Mean values of ZH (dBZ) (black line), ZDR (dB) (blue line), KDP (° km-1) 1447
(orange line) and ρHV (red line) for the (a) warm, (b) mixed 1, (c) mixed 2 and (d) 1448
glaciated phase layers as a function of the four life cycle stages of thunderstorms: (i) 1449
#1Echo, (ii) Int.,(iii) #1CG and (iv) #1CG. 1450
1451
Figure 15. Scatter plots between ZH (dBZ) and ZDR (dB) (left panels) and between ZH 1452
(dBZ) and KDP (° km-1) (right panels) for the (a-b) warm, (c-d) mixed 1, (e-f) mixed 2 1453
and (g-h) glaciated phase layers for the four life cycle stages of thunderstorms: (i) 1454
#1Echo (black dots), (ii) Int. (green dots), (iii) #1CG (blue dots) and (iv) #1CG (red 1455
dots). 1456
1457
Figure 16. Conceptual model of the thunderstorm electrification life cycle. It is showed 1458
the evolution from the first radar echo up to the time of the first cloud-to-ground flash: 1459
(a) the time of the first radar echo (#1Echo, t1=0 min), (b) the intermediate time between 1460
the first echo radar and the first intracloud lightning flash (Int., t2=15 min), (c) the time 1461
Page 60
60
of the first intracloud lightning flash (#1IC, t3=29 min) and the (d) time of the first 1462
cloud-to-ground lightning flash (#1CG, t4=36 min). 1463
1464
1465
1466
1467
1468
1469
1470
1471
1472
1473
Page 61
61
1474
Figure 1. Region of the CHUVA-Vale campaign with the localization of the X-band 1475 radar (gray shaded region), and the SPLMA (red filled circles) and BrasilDAT (blue 1476 stars) lightning sensors. Asterisks represent the locations of the 46 thunderstorms at the 1477 time of the first cloud-to-ground (CG) lightning flash. The gray dashed lines represent 1478 the distance rings (20, 60 and 100 km) from the radar. The minimum detectable radar 1479 reflectivity at 20 km and 60 km range were -4 dBZ and 9 dBZ, respectively. 1480 1481 1482 1483
Page 62
62
1484 Figure 2. Time-height plot of (a) ZH (dBZ), (b) ZDR (dB), (c) KDP (° km-1) and (d) ρHV 1485 for the thunderstorm observed at 1800 UTC on 20 February 2012. The horizontal 1486 dashed line marks the 0°C level as determined by the sounding data. The black vertical 1487 lines in the figures represent the times of the intracloud lightning flashes and the blue 1488 lines represent the cloud-to-ground lightning flashes. Arrows indicate the first 1489 intracloud (black) and the first cloud-to-ground (blue) flashes. 1490 1491 1492 1493 1494 1495
Page 63
63
1496
1497 Figure 3. Maximum value of ZH (dBZ) (black line) and minimum values of ZDR (dB) 1498 (blue line), KDP (° km-1) (orange line) and (d) ρHV (red line) in the cloud layer between 1499 0° to -40 °C for the thunderstorm evolution documented in Figure 2. The black and blue 1500 dashed lines mark the times of the first intracloud and cloud-to-ground flashes, 1501 respectively. 1502
1503
Page 64
64
1504 Figure 4. Vertical cross sections of the polarimetric variables (ZH, ZDR, KDP and ρHV) of 1505 the thunderstorm evolution documented in Figure 2. The locations of the initiation 1506 points for the intracloud flashes are indicated with black circles and for the cloud-to-1507 ground flashes by blue crosses. Symbols in white color indicate the first intracloud 1508 (Figure 4e) and cloud-to-ground flashes (Figure 4f). 1509 1510 1511 1512 1513
Page 65
65
1514 Figure 5. Time-height plot of (a) ZH (dBZ), (b) ZDR (dB), (c) KDP (° km-1) and (d) ρHV 1515 for the thunderstorm observed at 1536 UTC on 22 January 2012. The horizontal dashed 1516 line marks the 0°C level as determined by the sounding data. The black vertical lines in 1517 the figures represent the times of the intracloud lightning flashes and the blue lines 1518 represent the cloud-to-ground lightning flashes. Arrows indicate the first intracloud 1519 (black) and the first cloud-to-ground (blue) flashes. 1520 1521 1522 1523 1524 1525
Page 66
66
1526
1527 1528 Figure 6. Maximum value of ZH (dBZ) (black line) and minimum values of ZDR (dB) 1529 (blue line), KDP (° km-1) (orange line) and (d) ρHV (red line) in the cloud layer between 1530 0° to -40 °C for the thunderstorm evolution documented in Figure 5. The black and blue 1531 dashed lines mark the times of the first intracloud and cloud-to-ground flashes, 1532 respectively. 1533 1534 1535 1536 1537 1538
Page 67
67
1539 Figure 7. Vertical cross sections of the polarimetric variables (ZH, ZDR, KDP and ρHV) of 1540 the thunderstorm evolution documented in Figure 5. The locations of the initiation 1541 points for the intracloud flashes are indicated with black circles and for the cloud-to-1542 ground by blue crosses. In Figure 7d the symbols in white color indicate the first 1543 intracloud and cloud-to-ground flashes. 1544 1545 1546 1547 1548 1549 1550 1551 1552
Page 68
68
1553 Figure 8. Time-height plot of (a) ZH (dBZ), (b) ZDR (dB), (c) KDP (° km-1) and (d) ρHV 1554 for the thunderstorm observed at 1818 UTC on 7 February 2012. The horizontal dashed 1555 line marks the 0°C level as determined by the sounding data. The black vertical lines in 1556 the figures represent the times of the intracloud lightning flashes, and the blue lines 1557 represent the cloud-to-ground lightning flashes. Arrows indicate the first intracloud 1558 (black) and the first cloud-to-ground (blue) flashes. 1559 1560
Page 69
69
1561 Figure 9. Maximum value of ZH (dBZ) (black line) and minimum values of ZDR (dB) 1562 (blue line), KDP (° km-1) (orange line) and (d) ρHV (red line) in the cloud layer between 1563 0° to -40 °C for the thunderstorm evolution documented in Figure 8. The black and blue 1564 dashed lines mark the times of the first intracloud and cloud-to-ground flashes, 1565 respectively. 1566 1567 1568
Page 70
70
1569 Figure 10. Vertical cross sections of the polarimetric variables (ZH, ZDR, KDP and ρHV) 1570 of the thunderstorm evolution documented in Figure 8. The locations of the initiation 1571 points for the intracloud flashes are indicated with black circles and for the cloud-to-1572 ground by blue crosses. Symbols in white color indicate the first intracloud (Figure 10g) 1573 and cloud-to-ground flashes (Figure 10h). 1574 1575 1576 1577 1578
Page 71
71
1579 Figure 11. Relative frequency distribution of the (a) time difference in minutes between 1580 the first intracloud (IC) and the first cloud-to-ground (CG) lightning flash and (b) 1581 elapsed time between the first radar echo and the first intracloud (black line) and the 1582 first cloud-to-ground (blue line) lightning flash for the 46 thunderstorms. 1583 1584 1585 1586 1587 1588 1589 1590 1591 1592 1593 1594 1595 1596 1597 1598 1599 1600 1601 1602 1603 1604 1605 1606 1607 1608 1609 1610
Page 72
72
1611 Figure 12. (a) Relative frequency distribution of the height (km) of lowest radar gate at 1612 time of the first radar echo and (b) scatter plots between ZH (dBZ) and ZDR (dB) for the 1613 lowest radar gate at time of the first radar echo. 1614 1615 1616 1617 1618 1619 1620 1621 1622 1623 1624 1625 1626 1627 1628 1629 1630
Page 73
73
1631 Figure 13. Box and whiskers plots for the (a) ZH (dBZ), (b) ZDR (dB), (c) KDP (° km-1) 1632 and (d) ρHV for the glaciated (from -40 ° to -65 °C, blue boxes), mixed 2 (-15° to -40 °C, 1633 dark gray boxes), mixed 1 (from 0 ° to -15 °C, light gray boxes) and warm (below 0 °C, 1634 red boxes) phase layers. For every layer, the four boxes represent the following stages 1635 of the thunderstorm life cycle: (i) the time of the first radar echo (#1Echo), (ii) the 1636 intermediate time between the first echo radar and the first intracloud lightning flash 1637 (Int.), (iii) the time of the first intracloud lightning flash (#1IC) and the (iv) time of the 1638 first cloud-to-ground lightning flash (#1CG). 1639 1640 1641 1642 1643 1644 1645 1646 1647 1648 1649 1650
Page 74
74
1651 Figure 14. Mean values of ZH (dBZ) (black line), ZDR (dB) (blue line), KDP (° km-1) 1652 (orange line) and ρHV (red line) for the (a) warm, (b) mixed 1, (c) mixed 2 and (d) 1653 glaciated phase layers as a function of the four life cycle stages of thunderstorms: (i) 1654 #1Echo, (ii) Int.,(iii) #1CG and (iv) #1CG. 1655 1656 1657 1658 1659 1660 1661 1662 1663
Page 75
75
1664 Figure 15. Scatter plots between ZH (dBZ) and ZDR (dB) (left panels) and between ZH 1665 (dBZ) and KDP (° km-1) (right panels) for the (a-b) warm, (c-d) mixed 1, (e-f) mixed 2 1666 and (g-h) glaciated phase layers for the four life cycle stages of thunderstorms: (i) 1667 #1Echo (black dots), (ii) Int. (green dots), (iii) #1CG (blue dots) and (iv) #1CG (red 1668 dots). 1669
Page 76
76
1670 1671 Figure 16. Conceptual model of the thunderstorm electrification life cycle. It is showed 1672 the evolution from the first radar echo up to the time of the first cloud-to-ground flash: 1673 (a) the time of the first radar echo (#1Echo, t1=0 min), (b) the intermediate time between 1674 the first echo radar and the first intracloud lightning flash (Int., t2=15 min), (c) the time 1675 of the first intracloud lightning flash (#1IC, t3=29 min) and the (d) time of the first 1676 cloud-to-ground lightning flash (#1CG, t4=36 min). 1677 1678
1679
1680
1681
1682
Page 78
-46.80 -46.40 -46.00 -45.60 -45.20
-46.80 -46.40 -46.00 -45.60 -45.20-2
4.00
-23.
60-2
3.20
-22.
80-2
2.40
-24.00-23.60
-23.20-22.80
-22.40Region of the CHUVA-Vale Campaign
Latit
ude
Longitude
20 km
60 km
100 km
Radar
SP
StormsXPOLSPLMABrasilDAT
Page 80
0
5
10
15A
ltitu
de (
km)
a)
0
5
10
15A
ltitu
de (
km)
−20
0
20
40
60
ZH (
dBZ
)
0
5
10
15
Alti
tude
(km
)
b)
0
5
10
15
Alti
tude
(km
)
−3−2−10123
ZD
R (
dB)
0
5
10
15
Alti
tude
(km
)
c)
0
5
10
15
Alti
tude
(km
)
−3−2−10123
KD
P (o k
m−
1 )
0 10 20 30 40Time Elapsed Since the First Radar Echo (min)
0
5
10
15
Alti
tude
(km
)
d)
0 10 20 30 40Time Elapsed Since the First Radar Echo (min)
0
5
10
15
Alti
tude
(km
)
0.6
0.7
0.8
0.9
1.0ρ H
V
Page 82
0 10 20 30Time Elapsed Since the First Radar Echo (min)
15
25
35
45
55Z
H (
dBZ
)
#1IC #1CG
−5.0
−3.0
−1.0
1.0
3.0
ZD
R (
dB)
−1.4
−1.2
−1.0
−0.8
−0.6
−0.4
−0.2
−0.0
KD
P (o k
m−
1 )
0.85
0.90
0.95
1.00
ρ HV
Page 86
0
5
10
15A
ltitu
de (
km)
a)
0
5
10
15A
ltitu
de (
km)
−20
0
20
40
60
ZH (
dBZ
)
0
5
10
15
Alti
tude
(km
)
b)
0
5
10
15
Alti
tude
(km
)
−3−2−10123
ZD
R (
dB)
0
5
10
15
Alti
tude
(km
)
c)
0
5
10
15
Alti
tude
(km
)
−3−2−10123
KD
P (o k
m−
1 )
0 5 10 15 20 25 30Time Elapsed Since the First Radar Echo (min)
0
5
10
15
Alti
tude
(km
)
d)
0 5 10 15 20 25 30Time Elapsed Since the First Radar Echo (min)
0
5
10
15
Alti
tude
(km
)
0.6
0.7
0.8
0.9
1.0ρ H
V
Page 88
0 5 10 15 20 25Time Elapsed Since the First Radar Echo (min)
30
40
50
60Z
H (
dBZ
)
#1IC #1CG
−1.0
0.0
1.0
2.0
3.0
ZD
R (
dB)
−1.5
−1.0
−0.5
0.0
0.5
KD
P (o k
m−
1 )
0.86
0.88
0.90
0.92
0.94
0.96
0.98
1.00
ρ HV
Page 92
0
5
10
15A
ltitu
de (
km)
a)
0
5
10
15A
ltitu
de (
km)
−20
0
20
40
60
ZH (
dBZ
)
0
5
10
15
Alti
tude
(km
)
b)
0
5
10
15
Alti
tude
(km
)
−3−2−10123
ZD
R (
dB)
0
5
10
15
Alti
tude
(km
)
c)
0
5
10
15
Alti
tude
(km
)
−3−2−10123
KD
P (o k
m−
1 )
0 10 20 30 40Time Elapsed Since the First Radar Echo (min)
0
5
10
15
Alti
tude
(km
)
d)
0 10 20 30 40Time Elapsed Since the First Radar Echo (min)
0
5
10
15
Alti
tude
(km
)
0.6
0.7
0.8
0.9
1.0ρ H
V
Page 94
0 10 20 30 40Time Elapsed Since the First Radar Echo (min)
20
30
40
50
60Z
H (
dBZ
)
#1IC #1CG
0.0
1.0
2.0
3.0
4.0
ZD
R (
dB)
−1.5
−1.0
−0.5
0.0
0.5
KD
P (o k
m−
1 )
0.80
0.85
0.90
0.95
1.00
ρ HV
Page 98
0
10
20
30
40
50
Time Difference Between the First IC
and the First CG Flash (min)
0
10
20
30
40
50
Rel
ativ
e F
requ
ency
(%
)
−6 0 6 12 18 24 30 36 42
a)
1
4
19
5
9
3 3
1 1
Time DifferenceN.Flashes=46Min. Diff.=−6 minMax. Diff.=38 minMean Diff.=6 minStd. Diff.=7 minMedian=4 min
Time DifferenceN.Flashes=46Min. Diff.=−6 minMax. Diff.=38 minMean Diff.=6 minStd. Diff.=7 minMedian=4 min
0 20 40 60 80Time Elapsed Between the First Radar Echo
and the First Flash (min)
0
10
20
30
40
Rel
ativ
e F
requ
ency
(%
)
b) IC FlashMin. Time=6 minMax. Time=68 minMean Time=29 minStd. Time=12 minMedian=28 min
IC FlashMin. Time=6 minMax. Time=68 minMean Time=29 minStd. Time=12 minMedian=28 min
CG FlashMin. Time=18 minMax. Time=70 minMean Time=36 minStd. Time=13 minMedian=35 min
CG FlashMin. Time=18 minMax. Time=70 minMean Time=36 minStd. Time=13 minMedian=35 min
Page 100
0
10
20
30
40
Height of Lowest Radar Gate of the First Radar Echo (km)
0
10
20
30
40R
elat
ive
Fre
quen
cy (
%)
0 1 2 3 4 5 6
5
7
15
3
6
21
4
21
Min. Height=1 kmMax. Height=5 kmMean Height=2 km
Min. Height=1 kmMax. Height=5 kmMean Height=2 km
a)
0 2 4 6 8ZDR (dB)
0
10
20
30
40
50
ZH (
dBZ
)
b)
Page 102
10
40
70
10
40
70Z
H (
dBZ
)
a)
Glaciated Phase (−40o to −65oC)
Mixed Phase 2(−15o to −40oC)
Mixed Phase 1 (0o to −15oC)
Warm Phase (> 0oC)
−20246
ZD
R (
dB)
b)
−20246
KD
P (o k
m−
1 )
c)
0.7
0.8
0.9
1.0
ρ HV
d)
#1Echo Int. #1IC #1CG #1Echo Int. #1IC #1CG #1Echo Int. #1IC #1CG #1Echo Int. #1IC #1CG
Page 104
0
10
20
30
ZH (
dBZ
)
d)
0.300.35
0.40
0.45
0.500.55
ZD
R (
dB)
-0.30
-0.20
-0.10
-0.00
0.10
KD
P (o k
m-1)
0.85
0.90
0.95
1.00
ρ HV
Glaciated Phase
20
30
40
ZH (
dBZ
)
c)
0.20
0.40
0.60
0.80
1.00
ZD
R (
dB)
-0.050.00
0.05
0.10
0.150.20
KD
P (o k
m-1)
0.85
0.90
0.95
1.00
ρ HV
Mixed Phase 2
15
30
45
60
ZH (
dBZ
)
b)
2.002.10
2.20
2.30
2.402.50
ZD
R (
dB)
-1.00-0.50
0.00
0.50
1.001.50
KD
P (o k
m-1)
0.85
0.90
0.95
1.00
ρ HV
Mixed Phase 1
#1Echo Int. #1IC #1CGTime Step
15
30
45
60
ZH (
dBZ
)
a)
2.50
3.00
3.50
4.00
4.50
ZD
R (
dB)
-1.50-0.50
0.50
1.50
2.503.50
KD
P (o k
m-1)
0.85
0.90
0.95
1.00
ρ HV
Warm Phase
Page 106
ZH x ZDR
0
20
40
60
ZH (
dBZ
)
g)Glaciated Phase
ZH x KDP
h)Glaciated Phase
0
20
40
60
ZH (
dBZ
)
e)Mixed Phase 2
f)Mixed Phase 2
0
20
40
60
ZH (
dBZ
)
c)Mixed Phase 1
d)Mixed Phase 1
−2 0 2 4 6 8 10ZDR (dB)
0
20
40
60
ZH (
dBZ
)
a)Warm Phase
−2 0 2 4 6KDP (
o km−1)
b)Warm Phase
#1Echo Int. #1IC #1CG