Empirical Analysis of the Effects of Rain on Measured Freeway Traffic Parameters 1 2 3 Meead Saberi K. 4 Department of Civil and Environmental Engineering 5 Portland State University 6 P.O. Box 751 7 Portland, OR 97207-0751 8 Phone: 503-725-4285 9 Fax: 503-725-5950 10 Email: [email protected]11 12 Robert L. Bertini 13 Department of Civil and Environmental Engineering 14 Portland State University 15 P.O. Box 751 16 Portland, OR 97207-0751 17 Phone: 503-725-4249 18 Fax: 503-725-2880 19 Email: [email protected]20 21 22 23 24 25 26 27 28 29 30 31 32 33 34 35 36 37 38 39 40 41 42 43 44 45 46 47 48 49 Submitted for presentation and publication to the 50 89th Annual Meeting of the Transportation Research Board 51 January 10-17, 2010 52 53 November 2009 54 55 Word Count: 7,456 (9 figures and 2 tables) 56 TRB 2010 Annual Meeting CD-ROM Paper revised from original submittal.
Transcript
Empirical Analysis of the Effects of Rain on Measured Freeway Traffic Parameters 1
2 3 Meead Saberi K. 4 Department of Civil and Environmental Engineering 5 Portland State University 6 P.O. Box 751 7 Portland, OR 97207-0751 8 Phone: 503-725-4285 9 Fax: 503-725-5950 10 Email: [email protected] 11 12 Robert L. Bertini 13 Department of Civil and Environmental Engineering 14 Portland State University 15 P.O. Box 751 16 Portland, OR 97207-0751 17 Phone: 503-725-4249 18 Fax: 503-725-2880 19 Email: [email protected] 20 21 22 23 24 25 26 27 28 29 30 31 32 33 34 35 36 37 38 39 40 41 42 43 44 45 46 47 48 49 Submitted for presentation and publication to the 50 89th Annual Meeting of the Transportation Research Board 51 January 10-17, 2010 52 53 November 2009 54 55 Word Count: 7,456 (9 figures and 2 tables) 56
TRB 2010 Annual Meeting CD-ROM Paper revised from original submittal.
Saberi and Bertini 2
Abstract. This paper describes an analysis of hourly rain and traffic parameters (speed and flow) at several locations 1 on northbound Interstate 5 in Portland, Oregon using data collected over three years and based on a platform of 2 archived freeway speed, flow, incident and weather data. The study aims to quantify a possible measurable effect of 3 rainfall on traffic speed and flow. First, the connection between rainfall conditions and incidents is studied. It is 4 shown that the presence of incidents slightly influences the analysis of the effects of rain on measured traffic flow. 5 After removing periods affected by incidents, traffic data are examined under different rainfall conditions. During 6 uncongested hourly periods, at the locations analyzed, a significant difference was noted between speed and flow 7 under different rainfall conditions. During congested periods, the flow and speed differences observed were not 8 significant. Further analysis is described during congested periods. Finally, a macroscopic analysis is used to display 9 possible effects of rainfall on the traffic flow fundamental diagram. In the context of intelligent transportation 10 systems, analyses such as these may lead to improved weather-responsive applications in traffic management and 11 information. 12 13
INTRODUCTION 14
Adverse weather is the second largest cause of non-recurring congestion, accounting for about 25% of freeway 15 delays. Thus, about 1 billion hours are lost each year in the U.S. due to weather-related delays. It is also estimated 16 that weather affects about one third of the nation’s Gross Domestic Product (GDP) (1). The Federal Highway 17 Administration (FHWA) is advancing advisory, control, and management strategies that include information 18 dissemination and methods to regulate or optimize traffic flow, and ensure that roads are clear of obstructions. 19 Adverse weather is often considered as an external factor that can affect freeway traffic operations. The Highway 20 Capacity Manual (HCM) (2) considers that adverse weather can reduce free-flow speeds and uses evidence that 21 different weather conditions can impact the form of speed-flow relationships. The FHWA has launched a “Road 22 Weather Management Program” that aims to improve mobility and safety by alleviating the impacts of weather on 23 the surface transportation system (3). Adverse weather may also have a greater effect on traffic flow as congestion 24 worsens in urban metropolitan areas (4). Pisano and Goodwin considered weather conditions to be predictable, 25 nonrecurring incidents that contribute to congestion by reducing capacity and speed over a given time (5). This 26 approach aids in the design and implementation of weather-responsive strategies that aim to improve mobility and 27 safety. There are several case studies of successful operational strategies of weather-responsive traffic management 28 (6). The aim of this study is to analyze and potentially quantify effects of recorded rainfall conditions on measured 29 freeway traffic speed and flow. Therefore, an overview of the literature on the impact of weather conditions on 30 traffic operations is presented in the next section. The third section describes the data that are used and presents a 31 short description of the study area. In the fourth section, traffic speeds and flows are compared during hours with 32 and without rain. The fifth section describes possible effects of rain on incident occurrence. The sixth and seventh 33 sections illustrate results indicating the measured traffic speed and flow during different rainfall conditions. The 34 final section summarizes the study and identifies directions for further research. 35 36
BACKGROUND 37
Relationships between weather conditions and traffic flow have been explored. For example, Holdener analyzed wet 38 and dry speed data along I-290 in Houston, Texas. The evening speed differentials between wet and dry conditions 39 ranged between 2 and 6 km/h (mean 5 km/h). Midday speed differentials ranged between 11 and 16 km/h (mean 13 40 km/h). The average measured wet speeds were 0 to 38 km/h lower (mean 14 km/h) than average dry speeds during 41 the peak period (7). Kyte et al. studied the effect of pavement conditions, wind speeds and visibility on free flow 42 speeds on a rural Interstate freeway in Idaho. That analysis revealed a significant decrease in free flow speed during 43 inclement weather. The mean passenger car speed was about 13 km/h lower with a higher standard deviation on a 44 bad weather day than for a good weather day (8). A study by Agarwal et al. examined apparent impacts of rain on 45 “capacity,” revealing that very light rain (less than 0.25 mm/hour) reduced capacity by 1–3% and light rain (0.25–46 6.35 mm/hour) was associated with a 5–10% capacity decrease. Similarly, Agarwal et al. reported measured speed 47 decreases during rain of 1–2% (for trace rain), 2–4% (light rain), and 4–7% (heavy rain) (9). An FHWA study in 48 three major metropolitan areas in the U.S. (Minneapolis/St. Paul, MN, Seattle, WA, and Baltimore, MD) found that 49 light rain resulted in measurable free flow speed and “capacity” decreases of 2–4% and 10–11%, respectively (10). 50 Chung et al. (11) reported observed free flow speed decreases of 5% in light rain and 8% in heavy rain in Tokyo, 51 Japan. According to the HCM, light rain does not have a notable effect on speed until water accumulates on the 52 pavement. For light rain, the HCM reports observed decreases of free flow speed about 1.6 km/h. For heavy rain, the 53 observed free flow speed decrease was 3.2–4.8 km/h (12). Rakha et al. (13) analyzed the impact of inclement 54 weather (precipitation and visibility) on measured traffic parameters, noting reductions in free flow speed and speed 55 at capacity with increasing precipitation intensity. They also reported that neither jam density nor capacity were 56
TRB 2010 Annual Meeting CD-ROM Paper revised from original submittal.
Saberi and Bertini 3
affected by weather conditions. The strategies that transportation management agencies could employ during 1 adverse weather involve modifying ramp metering rates, providing warnings, and issuing improved travel and 2 routing information. However, there are still questions about the relationship between weather and traffic flow. 3 Practitioners still need tools to aid in deploying operational strategies and traffic management techniques in response 4 to inclement weather (14). 5 6
DATA 7
In order to simultaneously analyze weather and traffic conditions, three data sources were used: hourly weather data, 8 20-sec traffic data, and reported incident data. These sources are described below in the context of the Portland 9 Oregon Regional Transportation Archive Listing (PORTAL). The hourly weather data available limited the power 10 of the conclusions that could be drawn in this analysis. 11 12
Traffic Data 13
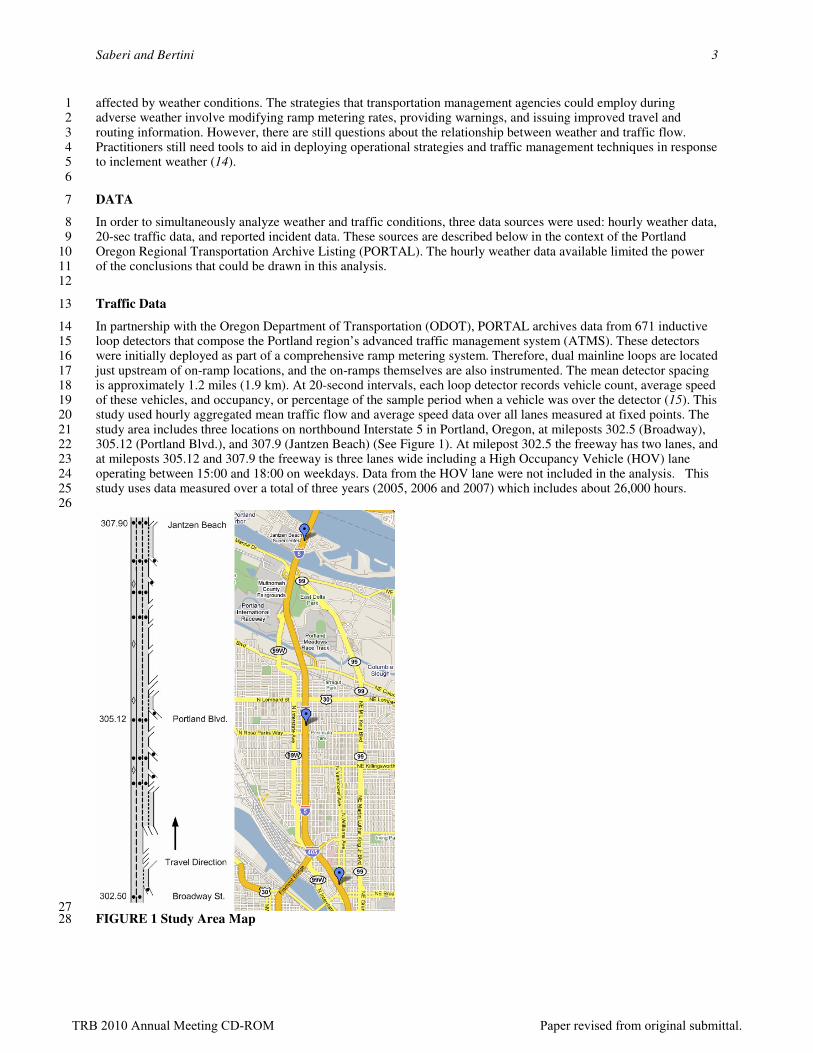
In partnership with the Oregon Department of Transportation (ODOT), PORTAL archives data from 671 inductive 14 loop detectors that compose the Portland region’s advanced traffic management system (ATMS). These detectors 15 were initially deployed as part of a comprehensive ramp metering system. Therefore, dual mainline loops are located 16 just upstream of on-ramp locations, and the on-ramps themselves are also instrumented. The mean detector spacing 17 is approximately 1.2 miles (1.9 km). At 20-second intervals, each loop detector records vehicle count, average speed 18 of these vehicles, and occupancy, or percentage of the sample period when a vehicle was over the detector (15). This 19 study used hourly aggregated mean traffic flow and average speed data over all lanes measured at fixed points. The 20 study area includes three locations on northbound Interstate 5 in Portland, Oregon, at mileposts 302.5 (Broadway), 21 305.12 (Portland Blvd.), and 307.9 (Jantzen Beach) (See Figure 1). At milepost 302.5 the freeway has two lanes, and 22 at mileposts 305.12 and 307.9 the freeway is three lanes wide including a High Occupancy Vehicle (HOV) lane 23 operating between 15:00 and 18:00 on weekdays. Data from the HOV lane were not included in the analysis. This 24 study uses data measured over a total of three years (2005, 2006 and 2007) which includes about 26,000 hours. 25 26
27 FIGURE 1 Study Area Map 28
TRB 2010 Annual Meeting CD-ROM Paper revised from original submittal.
Saberi and Bertini 4
Incident Data 1
Portland’s ATMS also includes a comprehensive incident management system, which records information about all 2 reported incidents on Portland’s freeway system. PORTAL archives the type of incident, the lanes that were blocked 3 as a result of the incident, and the start and end time of the incident (15), among other parameters. A total of three 4 years of incident data, which includes about 2,700 incident records in the selected area from milepost 300 to 307.9, 5 were also used in this study. 6 7
Weather Data 8
PORTAL archives hourly data from the National Oceanic and Atmospheric Administration (NOAA) including: 9
• Precipitation: type and intensity 10
• Wind: direction and speed 11
• Visibility: up to and including 10 statute miles 12 More details about how each of the above mentioned weather variables are observed and reported through the 13
Automated Surface Observing System can be found in (16). This analysis uses hourly precipitation data from 14 Portland International Airport, which is the closest weather station to the selected study sites (about 4 miles (6.4 km) 15 away). It is recognized that the hourly data constrains the potential results of this study. First, each hour was 16 categorized as either “no rain” or “rain.” A total of 17,301 hours on weekdays during 2005–2007 were observed. 17 Despite the fact that there is no consensus on how to classify rainfall intensity, each “rain” hour was further 18 subdivided into four categories: very light rain, light rain, moderate rain and heavy rain (see Table 1), based on 19 hourly total rainfall during the weekdays observed. It should be emphasized that these hourly values do not measure 20 “true” intensity since we do not know during which portions of the hour the rainfall actually occurred. Heavy 21 rainfall was removed from the analysis because of the small number of observations. 22 23 TABLE 1 Rainfall Classification 24 25
Rainfall Conditions Intensity (in/hr)
Total Number of Hours
Percent of Observations
Hours Influenced by Incidents
Percent of Observations
Total 17,301 2,336
No Rain 0 15,402 89 2,013 86
Rain 1,899 11 323 14
Very Light 0.01 692 4 90 4
Light 0.01-0.04 709 4 137 6
Moderate 0.04-0.16 459 3 88 4
Heavy > 0.16 39 0 8 0
26 Portland lies within the Marine west coast climate zone. Mean precipitation in Portland is 37 inches (940 27
mm) per year. Rainfall occurred during 1,899 hours on weekdays in 2005–2007. So using classifications shown in 28 Table 1, during the weekdays observed, the average rainfall during about 36% of the hours observed would be 29 classified “very light rain.” Average rainfall during about 37% of the observed hours was considered “light rain.” 30
31
COMPARING FLOW AND SPEED WITH AND WITHOUT RAIN 32
As an initial step, Figure 2 shows the average hourly flows and speeds measured with rain and with no rain. Figure 33 2(a) shows that the average flows during hours with no rain were 10-139 vph higher than the hourly flows measured 34 during rainy conditions. This was true over all hours of the day. Figure 2(b) similarly shows that the average speeds 35 during hours with no rain conditions were 0-4 mph higher than average speeds during rainy conditions. This was 36 true during all hours except for hour 16. At the locations studied, congestion typically began at about 15:00 and 37 continued through 18:00. Since speed is quite sensitive to flow in the congested regime, one cannot merely compare 38 median/average speeds during rainy conditions with dry conditions without considering flow variations and its 39 impacts on speed. We believe this is the case for hour 16. Further analysis during congested periods is described 40 later in this paper. 41
TRB 2010 Annual Meeting CD-ROM Paper revised from original submittal.
5 FIGURE 2 Average Flow (a) and Speed (b) for Milepost 302.5 During All Weekday Hours 6
7 Some previous research has suggested that data used in studies assessing weather impacts on traffic should 8
be outside the influence of any incidents (10, 13). Therefore, after fusing the traffic and weather data into a single 9 dataset that contained date, time, flow, speed, precipitation, wind speed, and visibility for each 1-hour time interval, 10 the possible effects of incidents on hourly average speeds and flows during dry and rainy conditions were studied. 11 As noted above, a total of three years of incident data, which includes 2,768 incident records in the selected area 12 from milepost 300 to 307.9, were used in this study. If an incident was reported during an hour and at or 13 downstream of a milepost, that hour is considered as an influenced hour by an incident for that milepost. A total of 14 2,336 hours were identified as being potentially influenced by incidents. 15 Once the hours containing incidents were identified and removed from the dataset, a total of 14,965 hours 16 were left in the dataset. Of these, 1,576 hours were rainy and 13,389 hours were dry. Flows and speeds measured 17 during dry and rainy hours were then compared, as shown in Figure 3. It appears that the average flows during all 18 weekday dry hours (including those influenced by incidents) were 0-35 vph lower than during dry hours not 19 influenced by incidents. This may be due to the effects of incidents blocking freeway lanes. For rainy hours, the 20 average flows during all weekday rainy hours were 0-65 vph lower than rainy hours not influenced by incident. 21
n = 17,301 hours
n = 17,301 hours
TRB 2010 Annual Meeting CD-ROM Paper revised from original submittal.
Saberi and Bertini 6
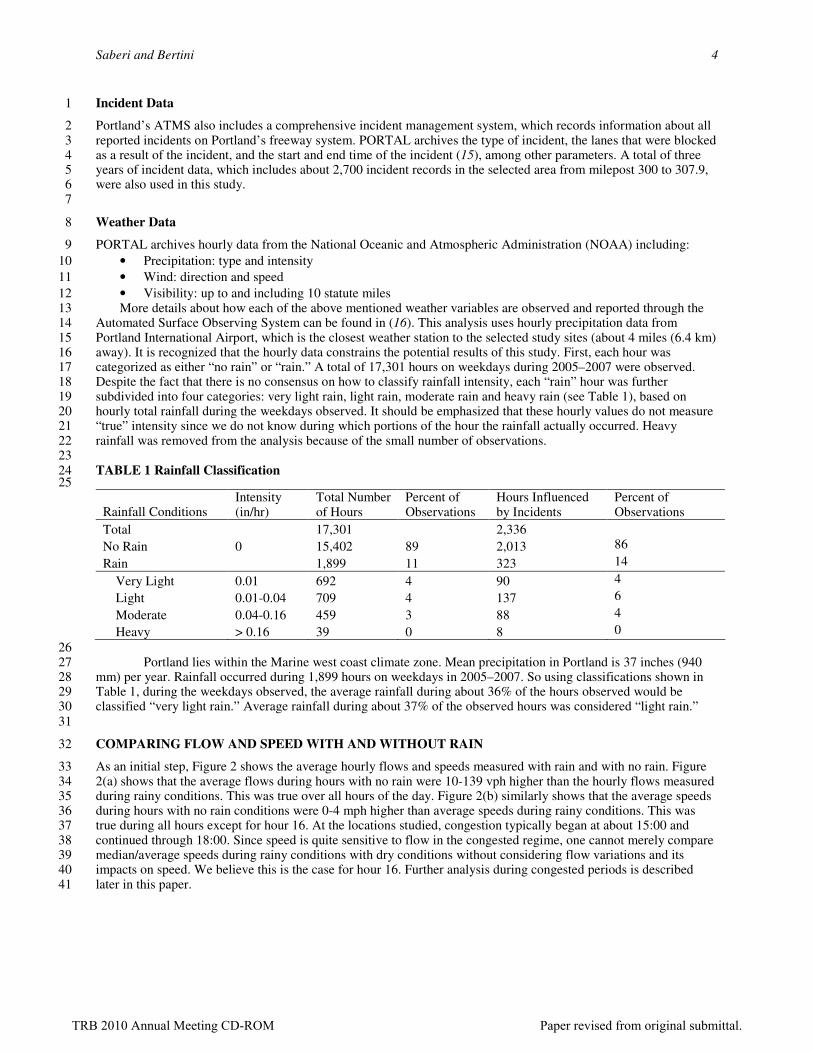
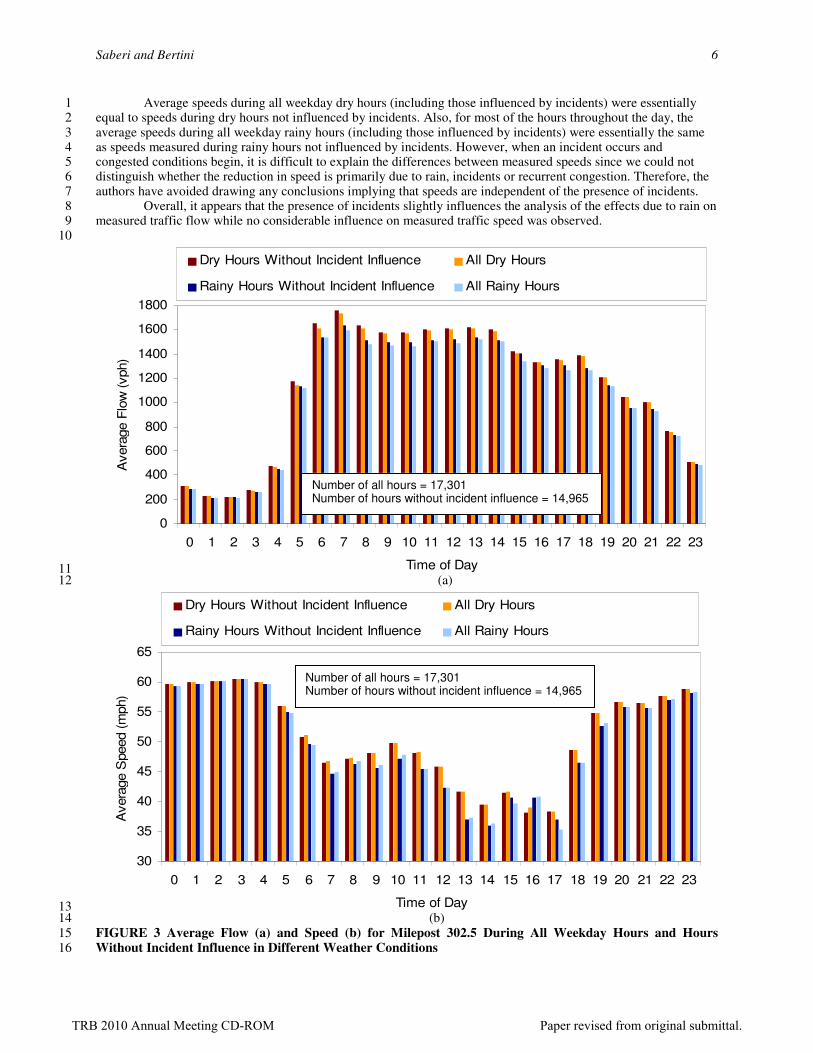
Average speeds during all weekday dry hours (including those influenced by incidents) were essentially 1 equal to speeds during dry hours not influenced by incidents. Also, for most of the hours throughout the day, the 2 average speeds during all weekday rainy hours (including those influenced by incidents) were essentially the same 3 as speeds measured during rainy hours not influenced by incidents. However, when an incident occurs and 4 congested conditions begin, it is difficult to explain the differences between measured speeds since we could not 5 distinguish whether the reduction in speed is primarily due to rain, incidents or recurrent congestion. Therefore, the 6 authors have avoided drawing any conclusions implying that speeds are independent of the presence of incidents. 7
Overall, it appears that the presence of incidents slightly influences the analysis of the effects due to rain on 8 measured traffic flow while no considerable influence on measured traffic speed was observed. 9
Dry Hours Without Incident Influence All Dry Hours
Rainy Hours Without Incident Influence All Rainy Hours
13 (b) 14
FIGURE 3 Average Flow (a) and Speed (b) for Milepost 302.5 During All Weekday Hours and Hours 15 Without Incident Influence in Different Weather Conditions 16
Number of all hours = 17,301 Number of hours without incident influence = 14,965
Number of all hours = 17,301 Number of hours without incident influence = 14,965
TRB 2010 Annual Meeting CD-ROM Paper revised from original submittal.
Saberi and Bertini 7
POSSIBLE EFFECTS OF RAINFALL ON INCIDENT OCCURRENCE 1
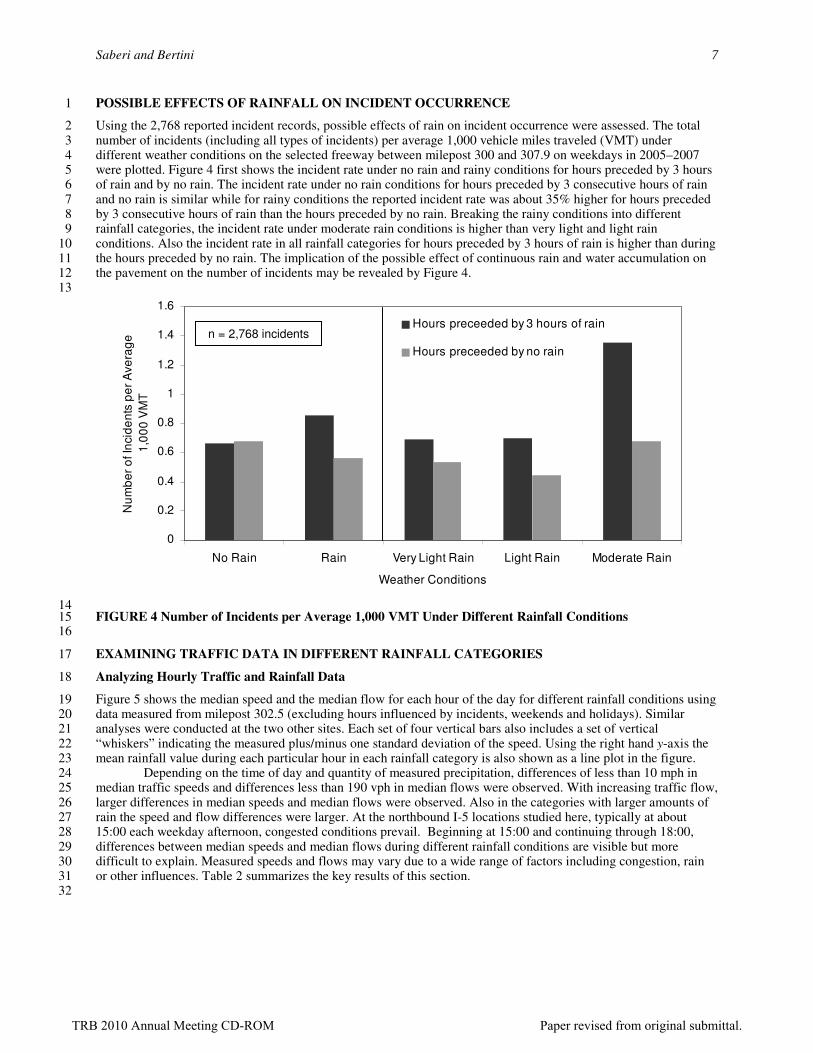
Using the 2,768 reported incident records, possible effects of rain on incident occurrence were assessed. The total 2 number of incidents (including all types of incidents) per average 1,000 vehicle miles traveled (VMT) under 3 different weather conditions on the selected freeway between milepost 300 and 307.9 on weekdays in 2005–2007 4 were plotted. Figure 4 first shows the incident rate under no rain and rainy conditions for hours preceded by 3 hours 5 of rain and by no rain. The incident rate under no rain conditions for hours preceded by 3 consecutive hours of rain 6 and no rain is similar while for rainy conditions the reported incident rate was about 35% higher for hours preceded 7 by 3 consecutive hours of rain than the hours preceded by no rain. Breaking the rainy conditions into different 8 rainfall categories, the incident rate under moderate rain conditions is higher than very light and light rain 9 conditions. Also the incident rate in all rainfall categories for hours preceded by 3 hours of rain is higher than during 10 the hours preceded by no rain. The implication of the possible effect of continuous rain and water accumulation on 11 the pavement on the number of incidents may be revealed by Figure 4. 12 13
0
0.2
0.4
0.6
0.8
1
1.2
1.4
1.6
No Rain Rain Very Light Rain Light Rain Moderate Rain
Weather Conditions
Nu
mb
er
of In
cid
en
ts p
er
Ave
rag
e
1,0
00
VM
T
Hours preceeded by 3 hours of rain
Hours preceeded by no rain
14 FIGURE 4 Number of Incidents per Average 1,000 VMT Under Different Rainfall Conditions 15 16
EXAMINING TRAFFIC DATA IN DIFFERENT RAINFALL CATEGORIES 17
Analyzing Hourly Traffic and Rainfall Data 18
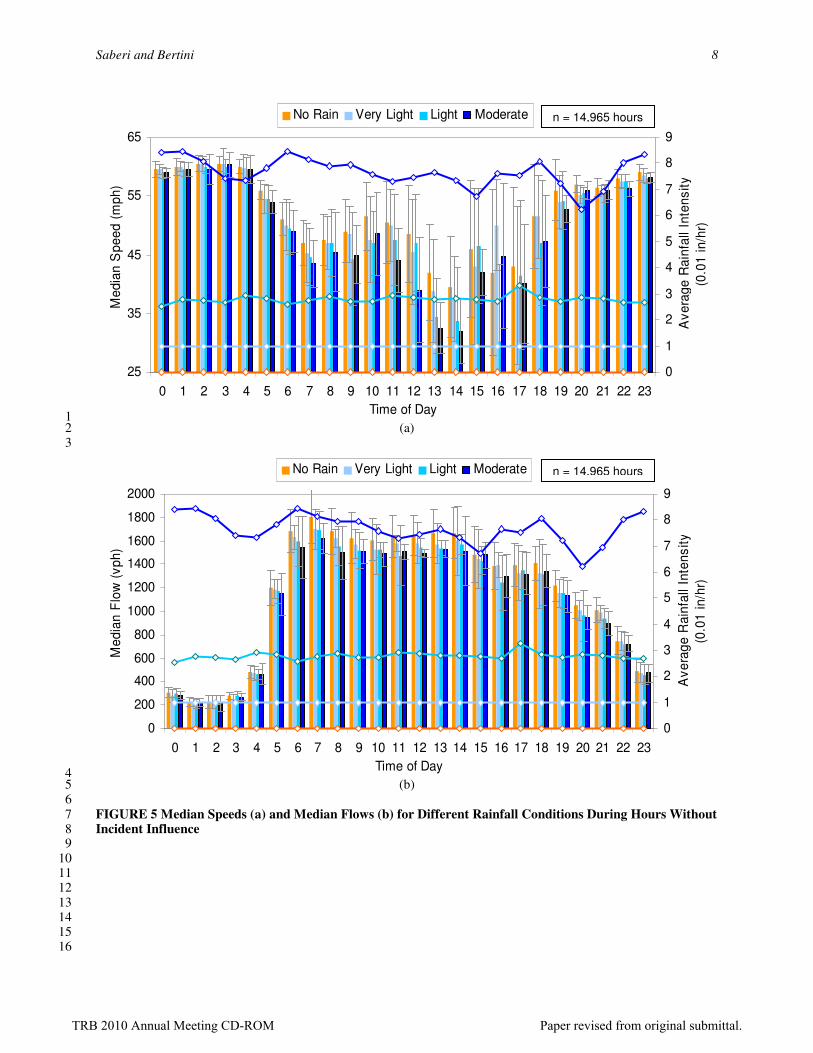
Figure 5 shows the median speed and the median flow for each hour of the day for different rainfall conditions using 19 data measured from milepost 302.5 (excluding hours influenced by incidents, weekends and holidays). Similar 20 analyses were conducted at the two other sites. Each set of four vertical bars also includes a set of vertical 21 “whiskers” indicating the measured plus/minus one standard deviation of the speed. Using the right hand y-axis the 22 mean rainfall value during each particular hour in each rainfall category is also shown as a line plot in the figure. 23
Depending on the time of day and quantity of measured precipitation, differences of less than 10 mph in 24 median traffic speeds and differences less than 190 vph in median flows were observed. With increasing traffic flow, 25 larger differences in median speeds and median flows were observed. Also in the categories with larger amounts of 26 rain the speed and flow differences were larger. At the northbound I-5 locations studied here, typically at about 27 15:00 each weekday afternoon, congested conditions prevail. Beginning at 15:00 and continuing through 18:00, 28 differences between median speeds and median flows during different rainfall conditions are visible but more 29 difficult to explain. Measured speeds and flows may vary due to a wide range of factors including congestion, rain 30 or other influences. Table 2 summarizes the key results of this section. 31
32
n = 2,768 incidents
TRB 2010 Annual Meeting CD-ROM Paper revised from original submittal.
FIGURE 5 Median Speeds (a) and Median Flows (b) for Different Rainfall Conditions During Hours Without 7 Incident Influence 8
9 10 11 12 13 14 15 16
n = 14,965 hours
n = 14,965 hours
TRB 2010 Annual Meeting CD-ROM Paper revised from original submittal.
Saberi and Bertini 9
TABLE 2 Differences in Median Speeds and Median Flows Under Different Rainfall Categories Compared to 1 No Rain During Uncongested Hours 2
Time Very light rain Light rain Moderate rain
Median speed Median flow Median speed Median flow Median speed Median flow
(mph) (vph) (mph) (vph) (mph) (vph)
0:00–3:00 0 0–30 0–1 0–20 0–1 5–30
4:00–8:00 0–2 10–110 1–2 20–125 2–4 20–190
9:00–14:00 1–4 50–90 2–8 90–160 4–10 120–160
19:00–23:00 0–2 5–60 0–2 30–90 0–3 20–110
3
Testing Differences Between Rainfall Categories 4
The previous section presented an analysis of the differences in mean speeds and flows during different rainfall 5 categories. A statistical test was used to determine whether differences between the groups of sampled data were 6 significant. The non-parametric Kruskal-Wallis test was used to compare three or more independent groups of 7 sampled data. This test is an alternative to the independent group ANOVA, when the assumption of normality or 8 equality of variance is not met. If the resulting p-value is small, we can reject the idea that the differences are all 9 coincidental. With small p-values there may be evidence to conclude that there is a difference among the four 10 classes of rainfall according to measured speeds. However the hourly weather and traffic data used limit the power 11 of the conclusions as subhourly variations of weather and traffic are not captured. 12 13
0
0.2
0.4
0.6
0.8
0 2 4 6 8 10 12 14 16 18 20 22
Time of Day
P-v
alu
e
0
0.2
0.4
0.6
0.8
0 2 4 6 8 10 12 14 16 18 20 22
Time of Day
P-V
alu
e
14 (a) (b) 15 FIGURE 6 P-values from Kruskal-Wallis Test for (a) Median Flows and (b) Median Speeds 16
17 Toward this end, Figure 6(a) shows the p-values for the Kruskal-Wallis test for each hour of the day for the 18
median flows. As shown, the results indicate that there is a significant difference among the measured flows during 19 the four classes of rainfall except during hours 1–3, 15–17, and 22–23. The difference between median flows 20 measured during hours with different rainfall conditions can be said to be statistically significant except during 21 overnight hours and during the afternoon peak hours as discussed above. Figure 6(b) shows the p-values of the 22 Kruskal-Wallis test for each hour of the day for median speeds. The difference between median speeds under 23 different rainfall categories can therefore be considered to be statistically significant except between hours 0–2, 8 24 and 15–17, as expected and discussed above. Similar analyses conducted at the two other locations showed similar 25 trends with slight differences in speed and flow magnitudes. 26
27
Probabilistic Analysis of Traffic and Rain Data 28
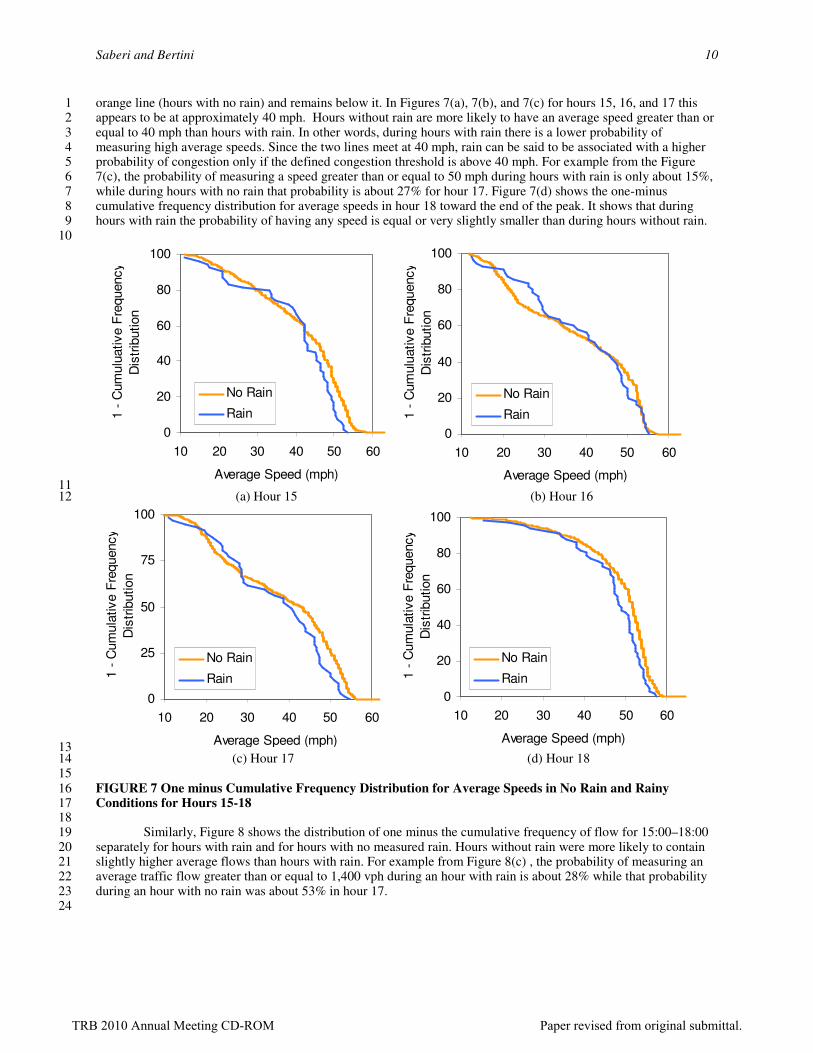
As mentioned above, the differences among measured hourly median speeds and median flows in periods with 29 different rainfall conditions were not statistically significant during particular hours in the early morning and 30 afternoon periods. During hours with potential for recurrent congestion, differences in speed and flow may have 31 been due to a range of factors including congestion, rain or other influences. In order to explore this, Figure 7 shows 32 the distribution of one minus the cumulative frequency of average speeds separately for hours with rain (all the 33 levels of rainfall intensities combined together) and without rain during afternoon hours 15:00–18:00 at milepost 34 302.5. For a given hour of the day, one can look for the point where the blue line (hours with rain) crosses below the 35
TRB 2010 Annual Meeting CD-ROM Paper revised from original submittal.
Saberi and Bertini 10
orange line (hours with no rain) and remains below it. In Figures 7(a), 7(b), and 7(c) for hours 15, 16, and 17 this 1 appears to be at approximately 40 mph. Hours without rain are more likely to have an average speed greater than or 2 equal to 40 mph than hours with rain. In other words, during hours with rain there is a lower probability of 3 measuring high average speeds. Since the two lines meet at 40 mph, rain can be said to be associated with a higher 4 probability of congestion only if the defined congestion threshold is above 40 mph. For example from the Figure 5 7(c), the probability of measuring a speed greater than or equal to 50 mph during hours with rain is only about 15%, 6 while during hours with no rain that probability is about 27% for hour 17. Figure 7(d) shows the one-minus 7 cumulative frequency distribution for average speeds in hour 18 toward the end of the peak. It shows that during 8 hours with rain the probability of having any speed is equal or very slightly smaller than during hours without rain. 9
10
0
20
40
60
80
100
10 20 30 40 50 60
Average Speed (mph)
1 -
Cum
ulu
ative F
requency
Dis
trib
ution
No Rain
Rain
0
20
40
60
80
100
10 20 30 40 50 60
Average Speed (mph)
1 -
Cum
ulu
ative F
requency
Dis
trib
ution
No Rain
Rain
11 (a) Hour 15 (b) Hour 16 12
0
25
50
75
100
10 20 30 40 50 60
Average Speed (mph)
1 -
Cum
ula
tive F
requency
Dis
trib
ution
No Rain
Rain
0
20
40
60
80
100
10 20 30 40 50 60
Average Speed (mph)
1 -
Cum
ula
tive F
requency
Dis
trib
ution
No Rain
Rain
13 (c) Hour 17 (d) Hour 18 14 15
FIGURE 7 One minus Cumulative Frequency Distribution for Average Speeds in No Rain and Rainy 16 Conditions for Hours 15-18 17
18 Similarly, Figure 8 shows the distribution of one minus the cumulative frequency of flow for 15:00–18:00 19
separately for hours with rain and for hours with no measured rain. Hours without rain were more likely to contain 20 slightly higher average flows than hours with rain. For example from Figure 8(c) , the probability of measuring an 21 average traffic flow greater than or equal to 1,400 vph during an hour with rain is about 28% while that probability 22 during an hour with no rain was about 53% in hour 17. 23
24
TRB 2010 Annual Meeting CD-ROM Paper revised from original submittal.
Saberi and Bertini 11
0
20
40
60
80
100
300 800 1300 1800
Average Flow (vph)
1 -
Cum
ulu
ative F
requency
Dis
trib
ution
No Rain
Rain
0
20
40
60
80
100
300 800 1300 1800
Average Flow (vph)
1 -
Cum
ulu
ative F
requency
Dis
trib
ution
No Rain
Rain
1 (a) Hour 15 (b) Hour 16 2
0
20
40
60
80
100
300 800 1300 1800
Average Flow (vph)
1 -
Cum
ulu
ative F
requency
Dis
trib
ution
No Rain
Rain
0
20
40
60
80
100
300 800 1300 1800
Average Flow (vph)
1 -
Cum
ulu
ative F
requency
Dis
trib
ution
No Rain
Rain
3 (c) Hour 17 (d) Hour 18 4 5 FIGURE 8 One minus Cumulative Frequency Distribution for Average Flows in No Rain and Rainy 6 Conditions for Hour 15-18 7 8
Traffic and Weather Analysis in the Context of the Fundamental Diagram 9
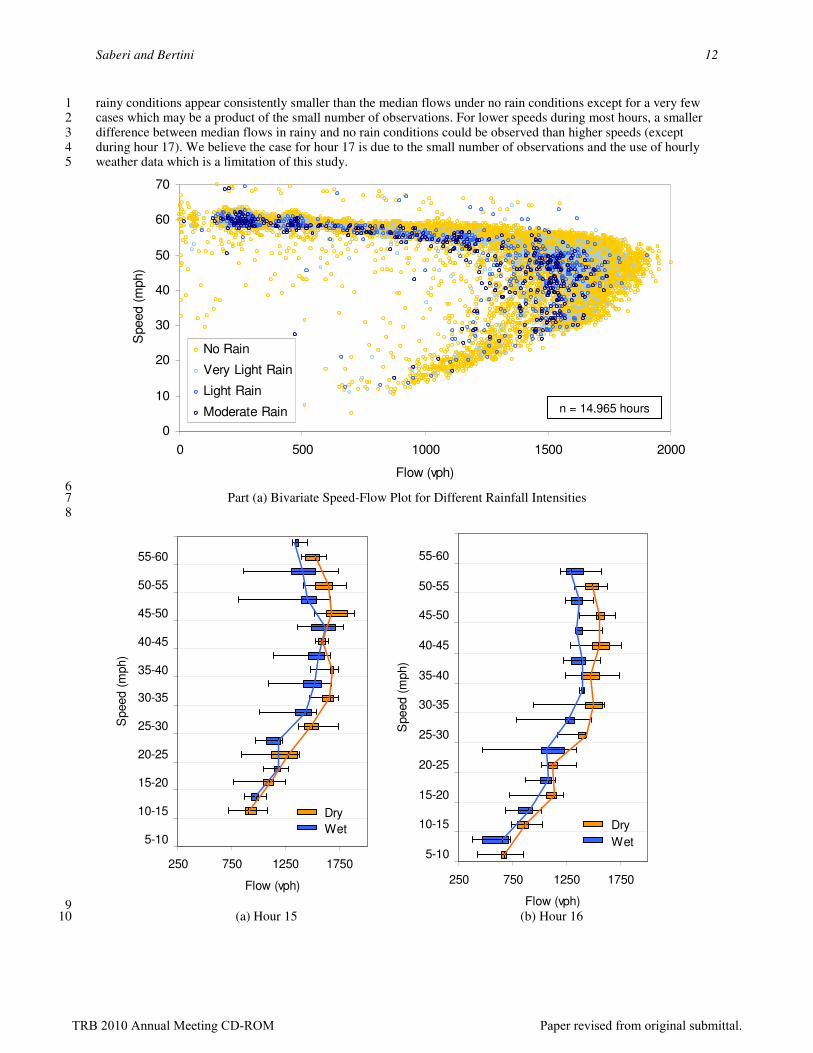
Marginal differences in measured hourly speeds and flows may reveal different traffic conditions at a macroscopic 10 level during rain conditions. This has implications for the “fundamental diagram.” Thus a macroscopic analysis is 11 conducted here to assess the magnitude of the differences among macroscopic traffic characteristics under different 12 rainfall intensities. Figure 9, Part (a) shows a scatter plot of a speed-flow relation for the four rainfall categories. The 13 mean of the highest 5% of observed flow during hours with very light rain, light rain, and moderate rain conditions 14 decreases by about 40 vph, 90 vph, and 140 vph respectively as compared to hours with no rain. A negligible 15 decrease in “free flow speed” (less than 1 mph) was observed under moderate rain conditions. The “free flow 16 speeds” during other rainfall categories were nearly constant. 17 18
BIVARIATE ANALYSIS OF CONGESTED HOURS 19
To better understand the traffic features under rainfall in congested hours, a bivariate analysis has been conducted. 20 For each of the hours between 15 and 18, seven sample rainy hours and seven sample not rainy hours were randomly 21 selected. 5-minute aggregated average speeds and flows have been used in order to explore subhourly variations in 22 traffic under different weather conditions. Figure 9, Part (b) shows box plots for the average flows in different 23 average speed bins for no rain and rainy conditions. As seen below, for similar speed bins the median flows under 24
TRB 2010 Annual Meeting CD-ROM Paper revised from original submittal.
Saberi and Bertini 12
rainy conditions appear consistently smaller than the median flows under no rain conditions except for a very few 1 cases which may be a product of the small number of observations. For lower speeds during most hours, a smaller 2 difference between median flows in rainy and no rain conditions could be observed than higher speeds (except 3 during hour 17). We believe the case for hour 17 is due to the small number of observations and the use of hourly 4 weather data which is a limitation of this study. 5
0
10
20
30
40
50
60
70
0 500 1000 1500 2000
Flow (vph)
Speed (
mph)
No Rain
Very Light Rain
Light Rain
Moderate Rain
6 Part (a) Bivariate Speed-Flow Plot for Different Rainfall Intensities 7
8
250 750 1250 1750
5-10
10-15
15-20
20-25
25-30
30-35
35-40
40-45
45-50
50-55
55-60
Speed (
mph)
Flow (vph)
Dry
Wet
250 750 1250 1750
5-10
10-15
15-20
20-25
25-30
30-35
35-40
40-45
45-50
50-55
55-60
Speed (
mph)
Flow (vph)
Dry
Wet
9 (a) Hour 15 (b) Hour 16 10
n = 14,965 hours
TRB 2010 Annual Meeting CD-ROM Paper revised from original submittal.
Saberi and Bertini 13
250 750 1250 1750
5-10
10-15
15-20
20-25
25-30
30-35
35-40
40-45
45-50
50-55
55-60S
peed (
mph)
Flow (vph)
Dry
Wet
250 750 1250 1750
5-10
10-15
15-20
20-25
25-30
30-35
35-40
40-45
45-50
50-55
55-60
Speed (
mph)
Flow (vph)
Dry
Wet
1 2 (c) Hour 17 (d) Hour 18 3
4 Part (b) Box Plots of Speed-Flow Relationship in Different Weather Conditions 5
6 FIGURE 9 Speed-Flow Relationship in Different Weather Conditions 7
8
CONCLUSIONS 9
In this paper, possible effects of rain on measured traffic parameters at an hourly level of resolution were studied. 10 Using three years’ of measured traffic data and reported incident data on northbound Interstate 5 in Portland, Oregon 11 from milepost 300 to 307.9 on weekdays in 2005–2007, it is shown that incident rates were higher for hours 12 preceded by 3 consecutive hours of rain than hours preceded by no rain. Also, a higher incident rate was observed in 13 moderate rain conditions than light rain and very light rain conditions. In addition, results show that the presence of 14 incidents may slightly influence the analysis of the effects due to rain on measured traffic flow while no discernable 15 influence on measured traffic speed was observed. 16
This study examined hourly traffic and weather data at three locations over three years and found some 17 potentially notable differences in traffic parameters (speed and flow) during different categories of rainfall. The 18 results reported in this paper are from a single freeway location (milepost 302.5). The other two study sites revealed 19 similar results. Depending on the time of day, quantity of measured precipitation, and location, differences of less 20 than 10 mph in median traffic speeds and differences less than 190 vph in median flows were observed. The 21 differences among measured speeds and flows in different rainfall conditions for certain overnight and peak 22 (congested) periods were not statistically significant, apparently due to the confounding effects of overnight loop 23 detector speed errors and recurrent congestion during peak periods. 24
Further analysis using an hour-by-hour probabilistic approach was performed in order to analyze weather 25 and traffic data during congested time periods. It was found that the probability of having higher speeds and flows in 26 hours with rain was lower than during hours with no rain for congested time periods. 27
The results of a preliminary bivariate analysis showed that the 95% highest flow decreased by about 40–28 140 vph during hours with rainfall. A negligible decrease in free flow speed with increases in precipitation was also 29 observed. To capture subhourly variations in weather, higher resolution data (5-minute intervals) were used in a 30 preliminary analysis with a very small sample size. Using box plots, it was found that for similar speed bins, median 31 flows under rainy conditions were consistently smaller than median flows in no rain conditions except for a small 32
TRB 2010 Annual Meeting CD-ROM Paper revised from original submittal.
Saberi and Bertini 14
number of cases which may be a product of small number of observations. For slower speeds, a smaller difference 1 between median flows in rainy and no rain conditions is observed than higher speeds. 2
Additional work using bivariate analysis tools and higher resolution weather and traffic data is needed to 3 study the effects of rain on speed and flow during congested periods more deeply. Research may also be required to 4 assess the effects of other weather variables such as wind speed and visibility on traffic flow. In the context of 5 intelligent transportation systems, analyses such as these may lead to improved weather-responsive applications in 6 traffic management and information. The strategies that transportation management agencies could employ during 7 adverse weather involve modifying ramp metering rates, providing warnings, and issuing improved travel time and 8 routing information. As a next step, effects of adverse weather on travel time variability should also be studied. 9 Disseminating more reliable travel times to travelers when it is rainy, being aware of speed and capacity reductions 10 during bad weather on freeways to program more efficient freeway management systems, identifying the 11 effectiveness of ramp metering under varying weather conditions and weather-responsive signal timing on arterials 12 are just some of the applications of weather-responsive traffic management and information systems. 13 14
ACKNOWLEDGEMENTS 15
The authors acknowledge the Oregon Department of Transportation (ODOT) and the Portland Oregon 16 Transportation Archive Listing (PORTAL) for providing the data. Priya Chavan assisted with the incident analysis; 17 Rafael J. Fernández-Moctezuma developed the initial concepts and data aggregations for this analysis; and Jerzy 18 Wieczorek assisted with the statistical analysis. Kristin Tufte also provided moral support. The authors also 19 acknowledge Christopher Monsere for his review and comments. 20 21
REFERENCES 22
1. R.M. Alfelor, “Weather-responsive transportation management,” In 2006 ITE Annual Meeting and Exhibit 23 Compendium of Technical Papers, pp. 9. 24
2. TRB, Highway Capacity Manual, National Research Council, Washington D.C., 2000. 25 3. FHWA, Road Weather Management Overview. http://ops.fhwa.dot.gov/Weather/overview.htm. Accessed April 26
27, 2009. 27 4. V.P. Shah, A.D. Stern, L. Goodwin, P. Pisano, “Analysis of weather impacts on traffic flow in metropolitan 28
Washington, D.C.,” In Institute of Transportation Engineers 2003 Annual Meeting and Exhibit (Held in 29 Conjunction with ITE District 6 Annual Meeting), pp. 21. 30
5. P.A. Pisano, and L. C. Goodwin, “Research needs for weather-responsive traffic management,” In the 31 Transportation Research Record: Journal of the Transportation Research Board, No. 1867, National Research 32 Council, Washington D.C., 2004, pp. 127-131. 33
6. Federal Highway Administration, Best Practices for Road Weather Management, Office of Transportation 34 Operations, 2003. 35
7. D.J. Holdener, “The effects of rainfall on freeway speeds,” ITE Journal, Vol. 68, No. 11. 36 8. M. Kyte, Z. Khatib, P. Shannon, and F. Kitchener, “Effect of weather on free-flow speed,” In Transportation 37
Research Record: Journal of the Transportation Research Board, No. 1776, National Research Council, 38 Washington D.C., 2001, pp. 60-68. 39
9. M. Agarwal, R.R. Souleyrette, and T. H. Maze, “The weather and its impact on urban freeway traffic 40 operations,” In Proceedings of the 85nd annual meeting of the Transportation Research Board, Washington 41 D.C., 2006. 42
10. Federal Highway Administration. Empirical Studies on Traffic Flow in Inclement Weather. FHWA-HOP-07-43 073, 2006. 44
11. E. Chung, O. Ohtani, H. Warita, M. Kuwahara, and H. Morita, “Does weather affect highway capacity?,” 45 Presented at the 5th International Symposium on Highway Capacity and Quality of Service, Yakoma, Japan, 46 2006. 47
12. Highway Capacity Manual, TRB, National Research Counsil, Washington, D.C., 2000. 48 13. H. Rakha, M. Farzaneh, M. Arafeh, and E. Sterzin, “Inclement Weather Impacts on Freeway Traffic Stream 49
Behavior,” In the Transportation Research Record: Journal of the Transportation Research Board, No. 2071, 50 National Research Council, Washington D.C., 2008, pp. 8-18. 51
14. Effectiveness of Freeway Management Strategies during Adverse Weather Conditions, Research Needs 52 Statement, Transportation Research Board. 53
15. R.L. Bertini, S. Hansen, A. Byrd, and T. Yin, “Experience implementing a user service for archived intelligent 54 transportation systems data,” In the Transportation Research Record: Journal of the Transportation Research 55 Board, No. 1917, National Research Council, Washington D.C., 2005, pp. 90-99. 56
TRB 2010 Annual Meeting CD-ROM Paper revised from original submittal.
Saberi and Bertini 15
16. Automated Surface Observing System User’s Guide, National Oceanic and Atmospheric Administration, 1998. 1
TRB 2010 Annual Meeting CD-ROM Paper revised from original submittal.