18
1 Employment Equity at the Canada Revenue Agency Presentation to the Union of Taxation Employees January 14 th , 2005
| Date post: | 24-Dec-2015 |
| Category: |
Documents |
| Upload: | rhoda-waters |
| View: | 217 times |
| Download: | 1 times |

1
Employment Equity at the Canada Revenue Agency
Presentation to the Union of Taxation EmployeesJanuary 14th, 2005

2
National Employment Equity Program Update
1. Employment Equity (EE) Annual Report 2003-2004
2. Upcoming Challenges for the Canada Revenue Agency (CRA)
3. Update on major initiatives
4. EE Strategic Direction 2005-2008

3
Highlights of the EE Annual Report 2003-2004
Statistics in this Report include only CRA employees, as of March 31, 2004.
Statistics are compared with the new Labour Market Availability (LMA) based on the 2001 Census data and the 2001 Participation and Activity Limitation Survey (PALS) data for Persons with Disabilities.
The CRA changed its methodology to calculate its Labour Market Availability (LMA), using statistics on all Canadians, in order to align itself with its staffing requirements, which includes landed immigrants. This is expanding our pool of potential qualified candidates.
This Report includes some Customs initiatives and successes until December 2003.

4
Observations of the Changes in the LMA based on the 2001 Census data
A large increase in the LMA of Women in the Professional Employment Equity Occupational Group (EEOG 03), which includes the Audit jobs (AU’s), and in the Administrative and Senior Clerical Group (EEOG 07);
A substantial increase in the LMA of Visible Minorities in all occupational groups;
An increase in LMA of Aboriginal Peoples; and
A decrease in the LMA for Persons with Disabilities.
NOTE: For Persons with Disabilities, the filter questions used for the 2001 Participation and Activity Limitation Survey (PALS) were different from those used for the 1991 Health and Activity Limitation Survey (HALS). Therefore, the results from those two Surveys cannot be compared.

5
Representation Within the CRA,as of March 31, 2004
Total
# # % # % # % # %
Representation within the CRA * 39,655 959 2.4% 2,009 5.1% 5,219 13.2% 23,659 59.7%
Labour Market Availability **
Source: Data from CAS, March 31, 2004
Note: * Indeterminate and term employees over three months. * Excludes Executive Group (EX 1-5) and the CRA's Senior Management (SM) level.** The Labour Market Availability for Aboriginal Peoples, Visible Minorities, and Women is from the 2001 Census. Data for Persons with Disabilities is from the 2001 Participation and Activity Limitation Survey (PALS)
2.2% 3.9% 12.5% 59.7%
Aboriginal Peoples
Persons with Disabilities
Visible Minorities
Women
6
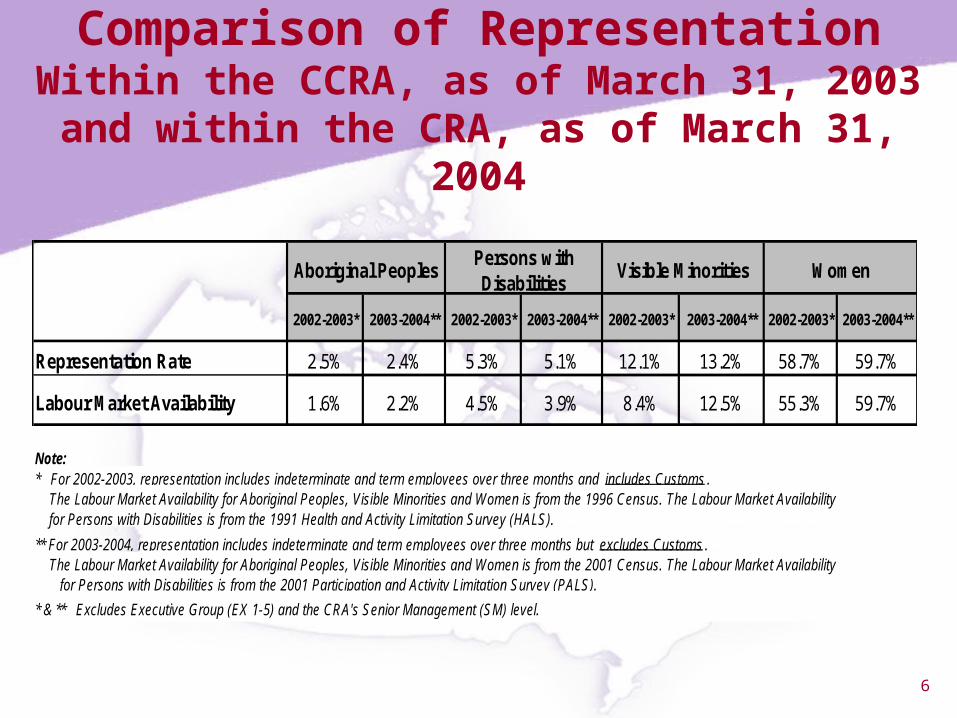
Comparison of RepresentationWithin the CCRA, as of March 31, 2003
and within the CRA, as of March 31, 2004
Aboriginal PeoplesPersons with Disabilities
Visible Minorities Women
2002-2003* 2003-2004** 2002-2003* 2003-2004** 2002-2003* 2003-2004** 2002-2003* 2003-2004**
Representation Rate 2.5% 2.4% 5.3% 5.1% 12.1% 13.2% 58.7% 59.7%
Labour Market Availability 1.6% 2.2% 4.5% 3.9% 8.4% 12.5% 55.3% 59.7%
Note:* For 2002-2003, representation includes indeterminate and term employees over three months and includes Customs . The Labour Market Availability for Aboriginal Peoples, Visible Minorities and Women is from the 1996 Census. The Labour Market Availability for Persons with Disabilities is from the 1991 Health and Activity Limitation Survey (HALS).
** For 2003-2004, representation includes indeterminate and term employees over three months but excludes Customs . The Labour Market Availability for Aboriginal Peoples, Visible Minorities and Women is from the 2001 Census. The Labour Market Availability for Persons with Disabilities is from the 2001 Participation and Activity Limitation Survey (PALS).
* & ** Excludes Executive Group (EX 1-5) and the CRA's Senior Management (SM) level.

7
Comparison Highlights
In comparison from March 31, 2003 to March 31, 2004:
The rate of representation of Visible minorities has increased from 12.1% to 13.2%, still exceeding the increased LMA of 12.5%.
The rate of representation of Women increased from 58.7% to 59.7%, equalling the increased LMA.
The rate of representation of Persons with Disabilities decreased slightly from 5.3% to 5.1%, but still exceeds the decreased LMA of 3.9%.
The rate of representation of Aboriginal Peoples has decreased slightly from 2.5% to 2.4%, but continues to exceed the increased LMA of 2.2%.

8
New Benchmark and Gaps by Occupational Groups
2002-2003 2003-2004 2002-2003 2003-2004 2002-2003 2003-2004 2002-2003 2003-2004
EEOG 02Middle & Other
ManagersNo gap Gap of 1 No gap No gap No gap Gap of 28 No gap No gap
1,0% 1,3% 3,4% 2,5% 7,1% 10,7% 34,1% 37,7%
EEOG 03 Professionals No gap No gap No gap Gap of 36 No gap No gap No gap Gap of 543
0,6% 0,9% 3,7% 4,1% 12,0% 16,5% 39,5% 46,1%
EEOG 05 Supervisors No gap No gap Gap of 25 No gap Gap of 5 Gap of 80 No gap No gap
1,2% 1,8% 6,3% 2,0% 7,3% 11,2% 54,0% 56,4%
EEOG 07Administrative & Senior Clerical
No gap Gap of 20 No gap No gap No gap No gap Gap of 29 Gap of 410
2,2% 2,9% 4,3% 4,0% 7,3% 11,9% 59,1% 65,7%
EEOG 10 Clerical Personnel No gap No gap No gap No gap No gap No gap No gap No gap
1,7% 2,6% 6,1% 4,4% 7,5% 9,9% 70,1% 72,2%
No gap No gap No gap No gap No gap No gap No gap Gap of 33
1,6% 2,2% 4,5% 3,9% 8,4% 12,5% 55,3% 59,7%
= Fully Representation (i.e., the Agency has met or exceeded the external LMA).
= Areas for improvement (i.e., the Agency is under external LMA).
LMA
Total
LMA
LMA
LMA
LMA
LMA
Women
(EEOGs)
Major Employment Equity
Occupational Groups
Aboriginal Peoples
Persons with Disabilities
Visible Minorities

9
Representation of Designated Groupsin the Executive Group
WomenVisible
MinoritiesPersons with Disabilities
Aboriginal Peoples
Internal Representation (EX/SM)* 33.7% 4.9% 3.6% 1.8%
Labour Market Availability ** 35.9% 11.3% 2.4% 1.6%
Source: Data provided by the CRA's Executive Personnel Programs, March 31, 2004.
Note: The total number of employees in the Executive Group is 445.* Internal Representation includes representation in the Executive Group DM (2); (EX 1-5) ( 273); the CRA's Senior Management (SM) level (130) and EX1/IT level (40).
** Labour Market Availability for Aboriginal Peoples, Visible Minorities and Women is from the 2001 Census data. Labour Market Availability for for Persons with Disabilities are from the 2001 Participation and Activity Limitation Survey (PALS).

10
Highlights of Representation in the Executive Group
Compared to March 31, 2003:
Representation of Women increased from 30.3% to 33.7%, but short of the increased LMA (35.9%) by 2.2%.
Representation of Visible Minorities increased from 4.3% to 4.9%, short of the increase LMA (11.3%) by 6.4%.
Representation rate of Persons with Disabilities decreased slightly from 4.1% to 3.6%, but still above the decreased LMA of 2.4%.
Representation of Aboriginal Peoples increased from 1.6% to 1.8%, above the increased LMA of 1.6%.

11
Representation of Designated Groups inManagement Development Programs
2003 & 2004
WomenVisible
MinoritiesPersons with Disabilities
Aboriginal Peoples
Representation on Management Development Programs 2003
47.9% 22.4% 3.6% 1.2%
Representation on Management Development Programs 2004
46.9% 28.5% 4.6% 1.5%
Note: Includes participants in the Management Trainee Program (MTP), Middle Management Development Program (MMDP), Executive Development Program (EXDP), and Career Assignment Program (CAP).
Source: Data provided by the Executive Personnel Programs Directorate, March 31, 2003 and March 31, 2004.

12
Highlights of Representation inManagement Development Programs
Compared to March 31, 2003:
There has been an increase in participation of three of the four designated groups in the Management Development Programs (Visible Minorities, Persons with Disabilities and Aboriginal Peoples).
The participation of Visible Minorities in these Programs reached 28.5% which will contribute to the Agency’s efforts of bridging their gap in the Executive Group.
The participation of Women decreased slightly passing from 47.6% to 46.7%.
13
Next Steps for EE Annual Report
The President of the Treasury Board will table the EE Report in Parliament on behalf of CRA.
The EE Report must be tabled before March 31, 2005.
Until the Report is tabled in Parliament, we cannot distribute it. Once it is tabled, a copy will be sent to your national union representatives and it will be available on the national EE website.
14
Upcoming CRA Challenges
Aboriginal PeoplesNeed to increase our hiring rate to take advantage of the
growing youth Aboriginal population.
Retention continues to be a challenge.
Need to increase Aboriginal representation in management positions.
Visible Minorities
Under-representation in the Executive Group (6.4% or 28).
While less severe, continued under-representation in the Middle and other Managers group (0.1% or 28) and in the Supervisors group (4.4% or 80).

15
Upcoming CRA Challenges(con’t.)
WomenUnder-representation in the Professional Group (5.6% or
543). This is the group where we have AUs
Under-representation in the Administrative and Senior Clerical Group where we have our PMs (2.5% or 410).
Still small under-representation of women in the Executive Group (2.2% or 10)
Persons with DisabilitiesAccommodation is an area that continues to evolve and we
are expecting this to be an issue in the foreseeable future.
16
Major Initiatives
Québec Region is piloting a new Strategy for Persons with Disabilities.
Electronic Workforce Profile Survey.
Developing a new 3-year EE Strategic Direction 2005-2008.

17
EE Strategic Direction 2005-2008
The first level of consultation was held with the National Advisory Committee (NAC) members on December 15-16, 2004
The second level will be scheduled for January 2005 with the Senior Employment Equity Coordinators (SEECs)
The third level will be with the National Union representatives - tentatively at the beginning of February 2005.
The EE Strategic Direction 2005-2008 will be presented to Board of Management in the Spring 2005.

18
THANK YOU!


