Date post: | 20-Dec-2015 |
Category: |
Documents |
View: | 213 times |
Download: | 0 times |
1
EPI235: Epi Methods in HSR
April 24, 2007 L7
Program Evaluation with Longitudinal Data 3: Two case studies (Dr. Schneeweiss)
Dr. Schneeweiss will illustrate a time series approach to evaluate health care cost-containment programs with longitudinal claims databases using the example of a Reference Drug Program in British Columbia. Using a formulary restriction for respiratory drugs he will illustrate the design and analytic issues of a randomized versus an observational analysis based on longitudinal data.
Background reading: •Schneeweiss S, Walker AM, Glynn RJ, Maclure M, Dormuth C, Soumerai SB: Outcomes of reference drug pricing for angiotensin-converting enzyme inhibitors in British Columbia, Canada. N Engl J Med, 2002; 346:822-829.•Schneeweiss S, Maclure M, Carleton BC, Glynn RJ, Avorn J. Clinical and economic consequences of a reimbursement restriction of nebulised respiratory therapy in adults: direct comparison of randomised and observational evaluations. Br Med J 2004;328:560-4.
3
Reference Drug Pricing in British Columbia
Reference price
(dhp CCBs: $31 per 30 days supply)
Paid by drug benefits program
Out-of-pocket contribution
Total drug price
Better name: Therapeutic MAC (maximum allowable cost)
$0
$31
$50
RP is not a pricing policy but a
reimbursement policy
4
Reference Pricing in British Columbia
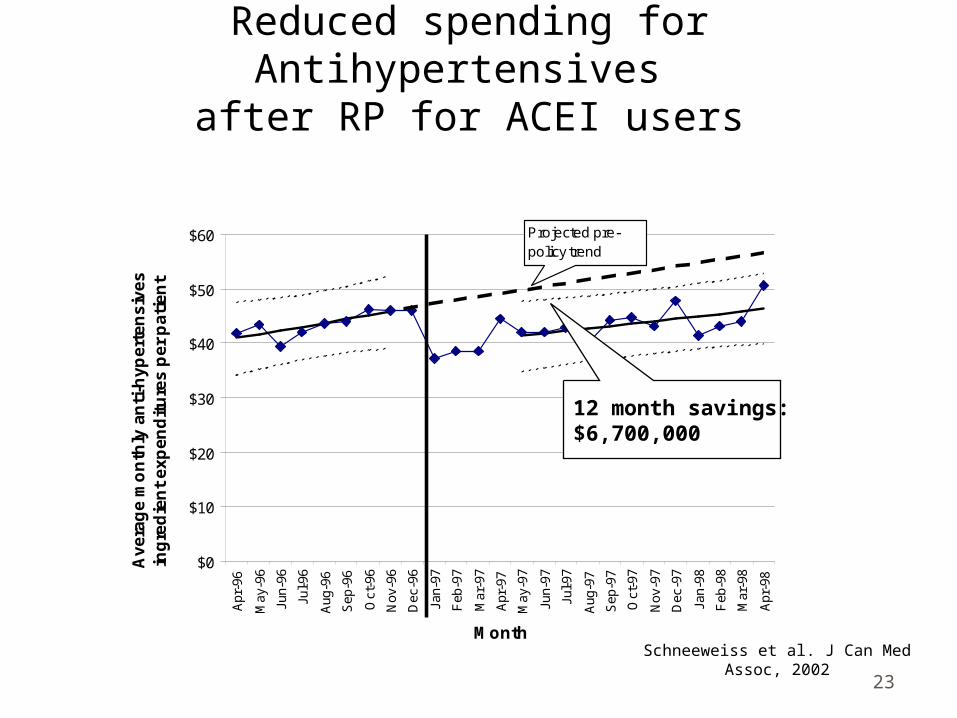
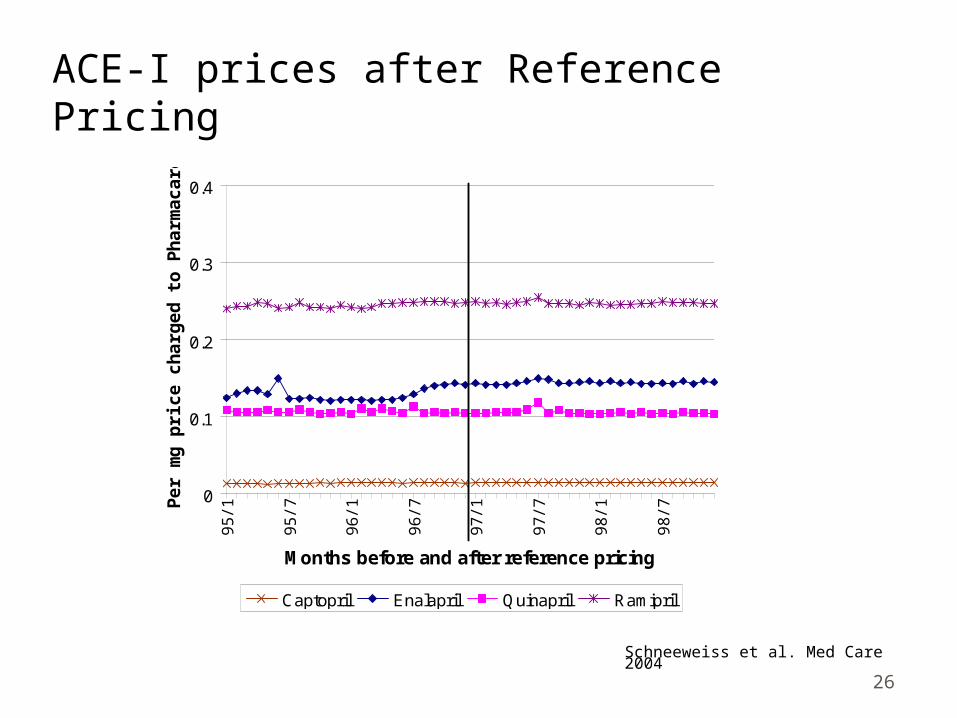
RP for ACEI also in 1997 Captopril, Quinapril, and Ramipril fully covered Enalapril required cost-sharing by patients
RP for dhp-CCBs in 1997 Felodipine fully covered Nifedipine, amlodipine, nicardipine required cost-
sharing by patients
5
RP in BC and other jurisdictions?
Reference Pricing was suggested to contain cost for a Medicare drug benefits program.Huskamp HA, Rosenthal MB, Frank RG, Newhouse JP. Health Affairs 2000;19:8-23.
Kanavos P, Reinhardt U. Health Affairs 2003;22(3).
Germany was the first jurisdiction with RP. However, there were no evaluations of clinical consequences and net savings.Schneeweiss S, Schoffski O, Selke GW. Health Policy 1998;44(3):253-60.
6
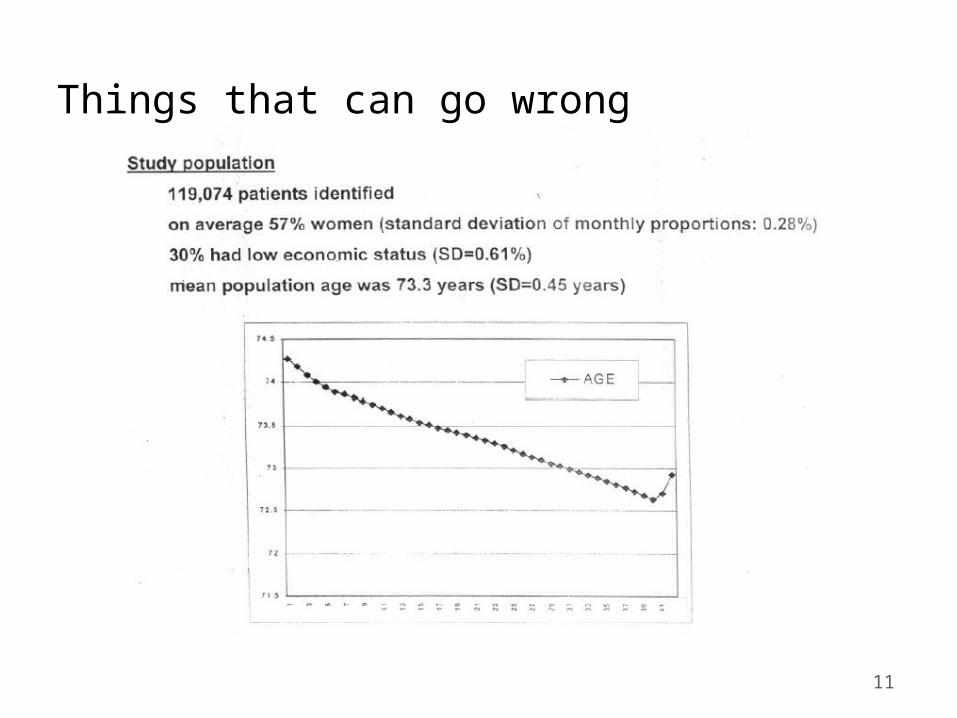
Study PopulationAll residents of British Columbia >65 covered by
Pharmacare plan A, the state wide pharmaceutical benefits program (1/2 million).
Study Question
Clinical and economic consequences?
16
Things that can go wrong
Simvastatin Medicaid
$0
$1
$2
$3
$4
$5Ja
n-05
Feb
-05
Mar
-05
Apr
-05
May
-05
Jun-
05
Jul-0
5
Aug
-05
Sep
-05
Oct
-05
Nov
-05
Dec
-05
Jan-
06
Feb
-06
Mar
-06
Apr
-06
May
-06
Jun-
06
Jul-0
6
Aug
-06
Sep
-06
Month
Pati
en
t p
aym
en
t p
er
30 D
DD
s
0
10,000
20,000
30,000
40,000
50,000
60,000
70,000
80,000
90,000
To
tal D
DD
s
Payments
DDDs
Start of Medicare Part D
17
Changes in ACE inhibitor Utilization
0
500
1000
1500
2000
2500Ja
n-95
Feb
-95
Mar
-95
Apr
-95
May
-95
Jun-
95
Jul-9
5
Aug
-95
Sep
-95
Oct
-95
Nov
-95
Dec
-95
Jan-
96
Feb
-96
Mar
-96
Apr
-96
May
-96
Jun-
96
Jul-9
6
Aug
-96
Sep
-96
Oct
-96
Nov
-96
Dec
-96
Jan-
97
Feb
-97
Mar
-97
Apr
-97
May
-97
Jun-
97
Jul-9
7
Aug
-97
Sep
-97
Oct
-97
Nov
-97
Dec
-97
Jan-
98
Feb
-98
Mar
-98
Apr
-98
Month
Nu
mb
er
of
me
dia
n m
on
thly
do
se
s p
er
10
,00
0
all ACE inhibitorscost-share ACE inhibitorsno-cost ACE inhibitorsTrendupper 95% confidence limitlower 95% confidence limit
Projected pre-policy trend
Schneeweiss et al. J Can Med Assoc, 2002
18
Expenditures for additional visits in prevalent ACEI users
0
0.5
1
1.5
2
2.5Ja
n-96
Feb-
96
Mar
-96
Apr-
96
May
-96
Jun-
96
Jul-9
6
Aug-
96
Sep-
96
Oct
-96
Nov
-96
Dec
-96
Jan-
97
Feb-
97
Mar
-97
Apr-
97
May
-97
Jun-
97
Jul-9
7
Aug-
97
Sep-
97
Oct
-97
Nov
-97
Dec
-97
Jan-
98
Feb-
98
Mar
-98
Apr-
98
Months
Num
ber
of p
hysi
cian
vis
it da
ys
per
patie
nt
-0.5
0
0.5
1
1.5
2
Diff
eren
ce in
phy
sici
an v
isit
days
per
pa
tient
bet
wee
n sw
itche
rs a
nd n
on-
switc
hers
S witchers : phys ic ian vis it days per patient
Non-switchers : phys ic ian vis it days per patient
Difference between switchers and non-switchers
right hand scale
Baseline level
Additional expendituresfor visits: $700,000
Schneeweiss et al. N Engl J Med 2002Schneeweiss et al. J Clin Epi 2002
19
Reduced time between visits in patients who switched ACE inhibitors
0
20
40
60
80
100
120
140M
ay-9
5
Jun-
95Ju
l-95
Aug
-95
Sep
-95
Oct
-95
Nov
-95
Dec
-95
Jan-
96
Feb
-96
Mar
-96
Apr
-96
May
-96
Jun-
96
Jul-9
6A
ug-9
6S
ep-9
6
Oct
-96
Nov
-96
Dec
-96
Jan-
97F
eb-9
7
Mar
-97
Apr
-97
May
-97
Jun-
97Ju
l-97
Aug
-97
Sep
-97
Oct
-97
Nov
-97
Dec
-97
Jan-
98
Feb
-98
Months
Me
dia
n p
res
cri
pti
on
du
rati
on
in
da
ys b
etw
ee
n
dis
pe
ns
ing
s
Prescription duration in recipients of cost-share drugs
Prescription duration in recipients of no-cost drugs
Prescription duration in patients who switched fromcost-sharing to no-cost
Schneeweiss et al. J Am Geriatr Assoc 2002
21
No effect on other health services
We concluded in earlier work that there is no increase in the incidence of hospital admissions or emergency room hospitalizations.
No effect on admissions to long-term care facilities.
No effect on mortality.
Schneeweiss et al. N Engl J Med 2002
22
Key Conclusions (Safety)
Reference pricing is a confusing name. Better: “Therapeutic MAC”
A safe implementation of RP requires to identify clusters of therapeutically equivalent drugs
(“T-MAC cluster”) according to the best available evidence
to allow for generous exemptions for clinical reasons
There is increasing evidence that Reference pricing is safe: No substitution No severe adverse health outcomes No increased discontinuation rates
23
Reduced spending for Antihypertensives after RP for ACEI users
$0
$10
$20
$30
$40
$50
$60A
pr-9
6
May
-96
Jun-
96
Jul-9
6
Aug
-96
Sep
-96
Oct
-96
Nov
-96
Dec
-96
Jan-
97
Feb
-97
Mar
-97
Apr
-97
May
-97
Jun-
97
Jul-9
7
Aug
-97
Sep
-97
Oct
-97
Nov
-97
Dec
-97
Jan-
98
Feb
-98
Mar
-98
Apr
-98
Month
Av
era
ge
mo
nth
ly a
nti
-hy
pe
rte
ns
ive
s
ing
red
ien
t e
xp
en
dit
ure
s p
er
pa
tie
nt
Projected pre-policy trend
12 month savings: $6,700,000
Schneeweiss et al. J Can Med Assoc, 2002
24
Pharmacy savings in incident ACEI users
0%
20%
40%
60%
80%
100%
120%
95/1
95/7
96/1
96/7
97/1
97/7
98/1
98/7
Months before and after the start of reference pricing
Pro
po
rtio
n o
f fr
ee a
nd
co
st-s
har
e A
CE
inh
ibit
or
use
as
firs
t-lin
e an
tih
yper
ten
sive
dru
g t
her
apy
free ACE inhibitors
cost-share ACEinhibitors
Start of reference pricing for ACE inhibitors
Projected free ACE inhibitors
Observed free ACE inhibitors
12 month savings: $200,00024 month savings: $800,000
25
Administrative costs
Annual fixed costs
Annual variable
costs
One-time costs
Ongoing Special Authority Requests*
Labor Pharmacist, support, consultant $159,143 Capital and Overhead Fax, phone, space etc. $24,789
Development and Implementation (one time costs)**
Staff $36,301 Communications Materials $25,000 Claims Processing System: Upgrade and Testing
$175,000
Total $24,789 $159,143 $236,301
26
ACE-I prices after Reference Pricing
0
0.1
0.2
0.3
0.4
95/1
95/7
96/1
96/7
97/1
97/7
98/1
98/7
Months before and after reference pricing
Pe
r m
g p
ric
e c
ha
rge
d t
o P
ha
rma
ca
re
Captopril Enalapril Quinapril Ramipril
Schneeweiss et al. Med Care 2004
27
Net health care savings
Schneeweiss et al. Med Care, 2004
Savings
Major spending component 1-year period 2-year period
(1) Prevalent users
Savings in drug expenditures $6.7M $12.6M*
Expenditures for increased physician claims -$0.7M -$0.7M
(2) Incident users
Savings in drug expenditures $0.2M $0.8M
(3) Administrative costs
Cost for programming the central benefit server -$0.24M $0.00M
Expenditures for prior authorization process -$0.18M -$0.37M
(4) Price Component
Savings through reduced drug price changes $0.0 $0.0
Total $5.8M $12.3M
28
Net Health Plan Savings
$0.0
$2.0
$4.0
$6.0
$8.0
Year1
Year2
Year3
Year4
Year5
Year6
Year7
Year8
Year9
Year10
Sav
ing
s to
Ph
arm
acar
e in
Mill
ion
CA
N $
Incident users
Prevalent users
Schneeweiss et al. Med Care 2004
29
Key Conclusions ($$)
All savings from the perspective of a comprehensive health insurance
RP for ACE inhibitors provided $5.8 million net savings during the first year (6%)
RP for dhp CCBs provided net savings of $1.6 million
Schneeweiss et al. Med Care, in press
31
Tele-Briefing for Pharmacare & COMPUS
For chit-chat, networking, call in 5 min early1pm (East): Chair greeting, announcemt (1
min)
Speaker(s) introduce self, topic (1-2 min)
Main take-home message & advice (1-2 min)
Observations, results (2-5 min)
What we did, project, methods (2-5 min)
Context, background (1-4 min)
Questions, discussion: please state your name
Session is recorded for limited-access by WebSlide 1
32
Division of Pharmacoepidemiology and Pharmacoeconomics Department of Medicine, Brigham and Women’s HospitalHarvard Medical School
(Abstract published at: Clin Pharm Ther 2005;77:P1)
Slide 2
Clinical and economic consequences of a
therapeutic substitution policy for PPIs
Sebastian Schneeweiss, MD, ScDNov. 28, 2005
33
Implications [Conclusions]
Therapeutic substitution for PPIs can play an important role in containing drug costs
Substantial net savings, no adverse health outcomes
Results are likely to vary by drug class
Slide 3
34
Results: 1) 50% of PPI users switched to preferred PPI
0
5
10
15
20
25
30
35
40
45
Jan-
02
Feb
-02
Mar
-02
Apr
-02
May
-02
Jun-
02
Jul-0
2
Aug
-02
Sep
-02
Oct
-02
Nov
-02
Dec
-02
Jan-
03
Feb
-03
Mar
-03
Apr
-03
May
-03
Jun-
03
Jul-0
3
Aug
-03
Sep
-03
Oct
-03
Nov
-03
Dec
-03
Jan-
04
Feb
-04
Mar
-04
Apr
-04
May
-04
Jun-
04
Dai
ly d
ose
s (
* 10
00)
dis
pen
sed
per
10,
000
sen
iors
.
All PPI
Non-preferred PPIs
Preferred PPI: rabeprazole
Esomeprazole
Fair PharmaCare*
PPI restriction Extrapolated trend
Slide 4
$35/month
$61 - $90
35
Results: 2) No increase in stopping of PPIs3) More starting on preferred PPI
0
0.1
0.2
0.3
0.4
0.5
Jan-0
2
Feb-0
2
Mar-
02
Apr-
02
May-
02
Jun-0
2
Jul-02
Aug-0
2
Sep-0
2
Oct
-02
Nov-
02
Dec-
02
Jan-0
3
Feb-0
3
Mar-
03
Apr-
03
May-
03
Jun-0
3
Jul-03
Aug-0
3
Sep-0
3
Oct
-03
Nov-
03
Dec-
03
Jan-0
4
Feb-0
4
Mar-
04
Apr-
04
May-
04
Jun-0
4
Pro
bab
ility
of sw
itch
ing
.
Restricted PPIs -> restricted PPIs
Restricted PPIs -> covered PPI
Restricted PPIs -> H2 blocker
Any PPI/H2 -> stopping
PPI restrictionFair PharmaCare*
0
0.1
Jan-
02
Feb
-02
Mar
-02
Apr
-02
May
-02
Jun-
02
Jul-0
2
Aug
-02
Sep
-02
Oct
-02
Nov
-02
Dec
-02
Jan-
03
Feb
-03
Mar
-03
Apr
-03
May
-03
Jun-
03
Jul-0
3
Aug
-03
Sep
-03
Oct
-03
Nov
-03
Dec
-03
Jan-
04
Feb
-04
Mar
-04
Apr
-04
May
-04
Jun-
04
Month
Starting on a restricted PPIStarting on the covered PPI
Slide 5
36
Results: 4) No increase in adverse GI effects 3) Short-term increase in visits
0
2
4
6
8
10
12
14
16
18Ja
n-02
Feb
-02
Mar
-02
Apr
-02
May
-02
Jun-
02
Jul-0
2
Aug
-02
Sep
-02
Oct
-02
Nov
-02
Dec
-02
Jan-
03
Feb
-03
Mar
-03
Apr
-03
May
-03
Jun-
03
Jul-0
3
Aug
-03
Sep
-03
Oct
-03
Nov
-03
Dec
-03
Jan-
04
Feb
-04
Month
Ho
spit
aliz
atio
n r
ate
per
10,
000
.
-10
10
30
50
70
90
110
130
150
Off
ice
visi
t ra
te p
er 1
0,00
0 .
Hospitalization: Complicated PUD
Hospitalization: GI hemorrhage
Office visits (GERD, PUD, gastritis)
PPI restriction Fair PharmaCare†
Slide 6
37
Safety results in numbers:
Table 2: Changes in monthly rates (95% confidence intervals) of clinical outcomes and physician service utiliza-
tion following the coverage restriction of PPIs among all BC residents 66 years or older.
Change in trends of monthly rates
2003 baseline rate
per 10,000 per month. Change in level after Change in slope after
January and February the PPI restriction July 1, 2003 the PPI restriction July 1, 2003
Hospitalization for GI hemor-
rhage
2.64 (2.23; 3.13)
0.15 (-0.17; 0.47)
p=0.35
-0.02 (-0.08; 0.04)
p=0.45
Hospitalization for complicated
peptic ulcer disease
10.6 (9.74; 11.5)
-0.64 (-1.54; 0.26)
p=0.16
0.05 (-0.10; 0.21)
p=0.48
Physician visit for GERD,
PUD, gastritis*
119.6 (116.6; 122.6)
2.61 (-7.29; 12.5)
p=0.59
-0.20 (-1.94; 1.54)
p=0.81
* GERD = gastro esophageal reflux disease; PUD = peptic ulcer disease.
Slide 7
38
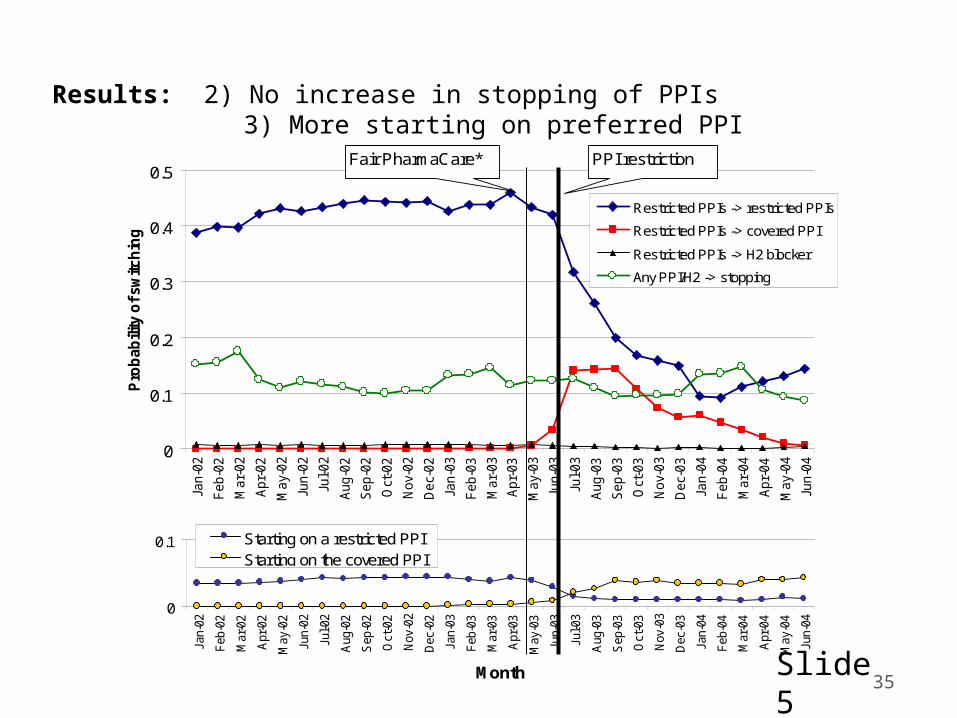
Results: 6) At least $2.9 million net savings in the first 6 months
-3
-2
-1
0
1
2
Jan
-03
Fe
b-0
3
Ma
r-0
3
Ap
r-0
3
Ma
y-0
3
Jun
-03
Jul-
03
Au
g-0
3
Se
p-0
3
Oct
-03
No
v-0
3
De
c-0
3
Month
Sa
vin
gs
/ex
ce
ss
sp
en
din
g (
$)
pe
r s
en
ior
. PharmaCare spending ($)
Patient spending ($)Total drug spending ($)
B
D
PPI restrictionFair PharmaCare†
C
A
Slide 8
39
Methods: PPI utilization data
Individual level data from all British Columbia seniors
LinkingAll pharmacy dispensings
(PharmaNet)Medical services, hospitalizations, and
vital statsMain outcome variable:
GI complications (power to show +-24 cases/m)
Drug spending (plan and patients)Time trend analyses are least prone to biasSlide 9
40
Background: Therapeutic substitution
Logic extension of generic substitution Is based on therapeutic equivalence of drugs
in groupPPIs ideal examples because very
homogeneous group of drugsSimilar policies: Reference Drug Programs
RDP for ACE, CCB, nitrates, and NSAIDs in British Columbia
Slide 10
41
Background: Implementation IssuesNeed to be careful establishing therapeutic
equivalenceWorks only if several alternatives are
availableWorks best if preferred drug is a lot less
costlySingle drug markets:
Combine with PA programs Aim to ensure that patients with specific indications
receive drugs
Slide 11
42
Summary & Questions
Substantial and rapid change in utilizationNo increase in discontinuationsNo increase in adverse GI outcomesSubstantial savingsHomogeneous groups like PPI are idealCareful expansion to more groups
Slide 12
44
… or randomization?
Time
Intervention
Intervention group
Control group
R
Assumptions for causal inference:
1. Subjects comply with their assigned ‘treatment’ = policy
45
Research question
Will we observe the same effects of a formulary restriction using A) a randomized trial design vs. B) a state-of-the-art observational design
recommended and used by policy evaluation researchers? Soumerai et al. Milbank, 1993
46
Case study: A Formulary restriction for nebulized respiratory drugs
Nebulized drugs were no longer covered by PharmaCare, B.C., after March 1,1999 but were fully covered before
10% of physicians were randomized to be exempted from the restriction for 6 months
(=randomized controls)10% of physicians who were subject to the
restriction were matched by location and volume (=intervention group)
Schneeweiss, BMJ under review
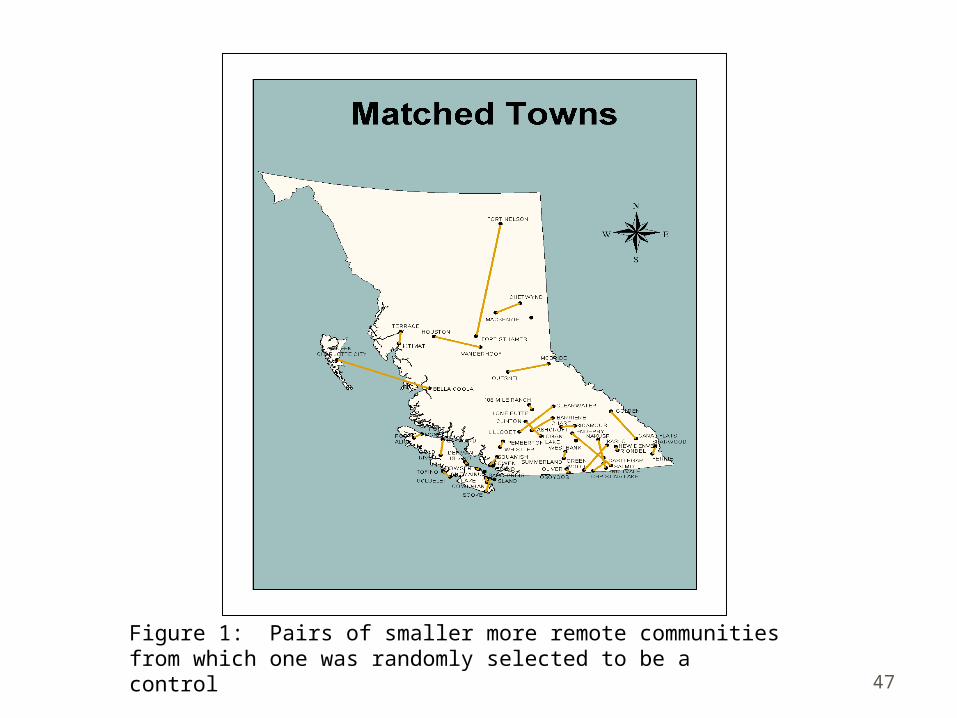
47
Figure 1: Pairs of smaller more remote communities from which one was randomly selected to be a control
48
Figure 2: A pair of urban physician addresses (marked +) from which one was randomly selected to be a control
49
EvaluationStudy subjects
Patients with at least 2 nebulizer dispensings from same study physician before the formulary restriction
386 control patients; 449 intervention patients
Longitudinal claims data for entire province: Rate of physician visits Rate of ER hospitalizations $$ for nebulized drugs $$ for inhalers
Outcome measures
51
Randomized analysis
-$20
$0
$20
$40
$60
$80
$100
Nov-98
Dec-98
Jan-99
Feb-99
Mar-99
Apr-99
May-99
Jun-99
Jul-99
Aug-99
Month
Neb
uli
zer
exp
end
itu
res
in C
an$
per
p
atie
nt
per
mo
nth
Start of ran-domized trial
End of ran-domized trial
Intervention group
Control group
Difference $10
52
Observational analysis:4,625 patients not involved in randomized design
Historical controls
Intervention group
-$40
-$20
$0
$20
$40
$60
$80
$100
Sep Oct
Nov
Dec Ja
n
Feb
Mar
Apr
May Ju
n
Jul
Aug
Months
Neb
uli
zer
dru
g e
xpen
dit
ure
s in
Can
$
per
pat
ien
t p
er m
on
th
Difference $20
53
Randomized analysis: 60% of control patient were non-compliant!
-$20
$0
$20
$40
$60
$80
$100
Nov-98
Dec-98
Jan-99
Feb-99
Mar-99
Apr-99
May-99
Jun-99
Jul-99
Aug-99
Month
Neb
uli
zer
exp
end
itu
res
in C
an$
per
p
atie
nt
per
mo
nth
Start of ran-domized trial
End of ran-domized trial
Intervention group
Control group
56
Key results
Outcomes per month
Randomized analysis
Observational analysis
Corrected for non-
compliance
$$ for nebulizer -$8.2 -$24 ** -$21 1
$$ for inhaler $1.1 $2.8 **
ER hospitalization
-0.4/100 0.4/100
Visits 6.2/100 2.6/100
** p < 0.0001 (bootstrap estimate) 1 Zelen, Biometrics 1991
57
0
1
2
3
4
5
6
7
CON (n=140) TRT (n=147)
Mea
n M
iniA
QL
Q s
core Before After
Figure 7: Comparison of Treatment and Control Group Quality of Life
58
Weighing the benefits of randomized and non-randomized drug policy research
Randomization Observation
Upfront investment for planning and implementation
Must overcome resistance
Shows commitment for ongoing evaluation
Easy and fast to analyze
‘Convincing’ results
No upfront investment necessary
Provides valid results if carefully done
Complex statistical adjustment necessary
Harder to communicate results
Easy to communicate results
Therefore often criticized for being biased