Name _________________________________________________________ Date _________
Core Concepts Writing an Equation of a Line Given slope m and y-intercept b Use slope-intercept form:
y mx b= +
Given slope m and a point ( )x y1 1, Use point-slope form:
( )1 1y y m x x− = −
Given points ( ) ( )x y x y1 1 2 2, and , First use the slope formula to find m. Then use point-slope form with either given point.
Notes:
Practice
Worked-Out Examples
Example #1
MODELING WITH MATHEMATICS in their paper plus a fee based on the number of lines in the advertisement. The table shows the total costs for different length advertisements at the Daily Times. The total cost y (in dollars) for an advertisement that is x lines long at the Greenville Journal is represented by the equation y = 2x advertisement for the total costs to be the same?
Two newspapers charge a fee for placing an advertisement
20. Which newspaper charges less per line? How many lines must be in an1
Finding a Line of Fit Step 1 Create a scatter plot of the data.
Step 2 Sketch the line that most closely appears to follow the trend given by the data points. There should be about as many points above the line as below it.
Step 3 Choose two points on the line and estimate the coordinates of each point. These points do not have to be original data points.
Step 4 Write an equation of the line that passes through the two points from Step 3. This equation is a model for the data.
Name _________________________________________________________ Date __________
Practice (continued)
3. Solve the Problem The slope is m = — 5 − 4
= 3.
Using point-slope form, the equation to represent the total cost for advertisements at Daily Times is
y − y1 = m(x − x1)
y − 27 = 3(x − 4)
y = 3x + 15.
Equate the cost expressions and solve.
2x + 20 = 3x + 15
5 = x
Comparing the slopes of the equations, the Greenville Journal costs $2 per line, which is less than the $3 per line that the Daily Times charges. The total costs are the same if there are 5 lines in an advertisement.
30 − 27
Example #2
MODELING WITH MATHEMATICS when different prices are charged. Write an equation of a line of fit for the data. Does it seem reasonable to use your model to predict the number of tickets sold when the ticket price is $85? Explain
1. The linear equation y = 1 — 2 x + 3 is written in slope-intercept
form.
2. When a line of best fi t has a correlation coeffi cient of −0.98, this means that the slope is negative.
Monitoring Progress and Modeling with Mathematics
3. From the graph, the slope is m = 2 — 10
= 0.2 and the y-intercept is b = 0. Using slope-intercept form, an equation of the line is
y = mx + b
= 0.2x + 0.
The equation is y = 0.2x. The slope indicates that the tip increases $0.20 for every dollar spent on the meal.
4. From the graph, the slope is m = −3 — 90
= − 1 —
30 and the
y-intercept is b = 12. Using slope-intercept form, an
equation of the line is
y = mx + b
y = − 1 — 30
x + 12.
The equation is y = − 1 — 30
x + 12. The slope indicates that the
amount of fuel in the gasoline tank decreases by 1 — 30
gallon
per mile driven.
5. From the graph, the slope is m = 100 —
2 = 50 and the y-intercept
is b = 100. Using slope-intercept form, an equation of the
line is
y = mx + b
y = 50x + 100.
The equation is y = 50x + 100. The slope indicates that the savings account balance increases by $50 per week.
6. From the graph, the slope is m = 6 — 4 = 1.5 and the y-intercept is
b = 0. Using slope-intercept form, an equation of the line is
y = mx + b
y = 1.5x + 0.
The equation is y = 1.5x. The slope indicates that the height of the tree increases by 1.5 feet per year.
7. From the graph, the slope is m = 165 − 55 — 3 − 1
= 110 — 2 = 55
and the y-intercept is b = 0. Using slope-intercept form, an equation of the line is
y = mx + b
y = 55x + 0.
The equation is y = 55x. The slope indicates that the typing rate is 55 words per minute.
8. From the graph, the slope is m = 300 − 180 — 3 − 5
= 120 — −2
= −60.
Using slope-intercept form, an equation of the line is
y − y1 = m(x − x1)
y − 300 = −60(x − 3)
y = −60x + 480.
The equation is y = −60x + 480. The slope indicates that the water level in the swimming pool decreases by 60 cubic feet per hour.
9. 1. Understand the Problem You are given an equation that represents the total cost for an advertisement at the Greenville Journal and a table of values showing total costs for advertisements at the Daily Times. You need to compare costs.
2. Make a Plan Write an equation that models the total cost of advertisements at the Daily Times. Then compare the slopes to determine which newspaper charges less per line. Finally, equate the cost expressions and solve to determine the number of lines for which the total costs are equal.
3. Solve the Problem The slope is m = 30 − 27 — 5 − 4
= 3.
Using point-slope form, the equation to represent the total cost for advertisements at Daily Times is
y − y1 = m(x − x1)
y − 27 = 3(x − 4)
y = 3x + 15.
Equate the cost expressions and solve.
2x + 20 = 3x + 15
5 = x
Comparing the slopes of the equations, the Greenville Journal costs $2 per line, which is less than the $3 per line that the Daily Times charges. The total costs are the same if there are 5 lines in an advertisement.
10. 1. Understand the Problem You have to write an equation that represents the linear relationship between Fahrenheit and Celsius and calculate several temperatures.
2. Make a Plan Use the point-slope form to write an equation that gives degrees Fahrenheit in terms of degrees Celsius. Then, substitute the given temperature for x in the equation to calculate y. Finally, rewrite the equation by solving for x.
Step 1 Draw a scatter plot of the data. The data show a linear relationship.
Step 2 Sketch the line that most closely appears to fi t the data. One possible line is shown.
Bat
tery
life
(%
)
00
20
40
60
80
Hours4 8 12 16 20 x
y
y = −4.55x + 91
Step 3 Choose two points on the line. For the line shown, you might choose (9, 50) and (20, 0).
Step 4 Write the equation of the line. First, fi nd the slope.
m = y2 − y1
— x2 − x1 = 0 − 50 —
20 − 9 = −50 —
11 ≈ −4.55
Use point-slope form to write an equation. Use (x1, y1) = (20, 0).
y − y1 = m(x − x1)
y − 0 = −4.55(x − 20)
y = −4.55x + 91
Use the equation to estimate the battery life.
y = −4.55(15) + 91 = 22.75
The approximate battery life after 15 hours is 23%.
16. Draw a scatter plot of the data. The data does not show a linear relationship.
Hea
rt r
ate
(bp
m)
00
20
40
60
80
100
120
Shoe size2 4 6 8 10 12 x
y
17. Enter the data into two lists. Use the linear regression feature. The line of best fi t is y = 380.03x + 11,290.
Use the equation to estimate the annual tuition cost in 2020 (x = 15).
y = 380.03(15) + 11,290
= 16,990.45
The approximate average annual tuition cost in the year 2020 is $16,990.45. The annual tuition increases by about $380 each year and the cost of tuition in 2005 is about $11,290.
Sample answer:
Step 1 Draw a scatter plot of the data. The data show a linear relationship.
Step 2 Sketch the line that most closely appears to fi t the data. One possible line is shown.
y − y1 = m x − x1
y − 450 = −10(x − 17)
y − 450 = −10x + 170
y = −10x + 620
Use the equation to estimate the number of tickets sold.
y = −10(85) + 620
= −230
The approximate number of tickets sold when the price is $85 is −230. This does not seem reasonable because the number of tickets sold is less than zero.
19. Enter the data into two lists. Use the linear regression feature. The line of best fi t is y = 0.42x + 1.44.
The correlation coeffi cient is r ≈ 0.61. This represents a weak positive correlation.
20. Enter the data into two lists. Use the linear regression feature. The line of best fi t is y = 0.88x + 1.69.
The correlation coeffi cient is r ≈ 0.88. This represents a strong positive correlation.
21. Enter the data into two lists. Use the linear regression feature. The line of best fi t is y = −0.45x + 4.26.
The correlation coeffi cient is r ≈ −0.67. This represents a weak negative correlation.
22. Enter the data into two lists. Use the linear regression feature. The line of best fi t is y = −1.04x + 5.68.
The correlation coeffi cient is r ≈ −0.93. This represents a strong negative correlation.
Untitled-1 3 10/31/19 4:06 PM
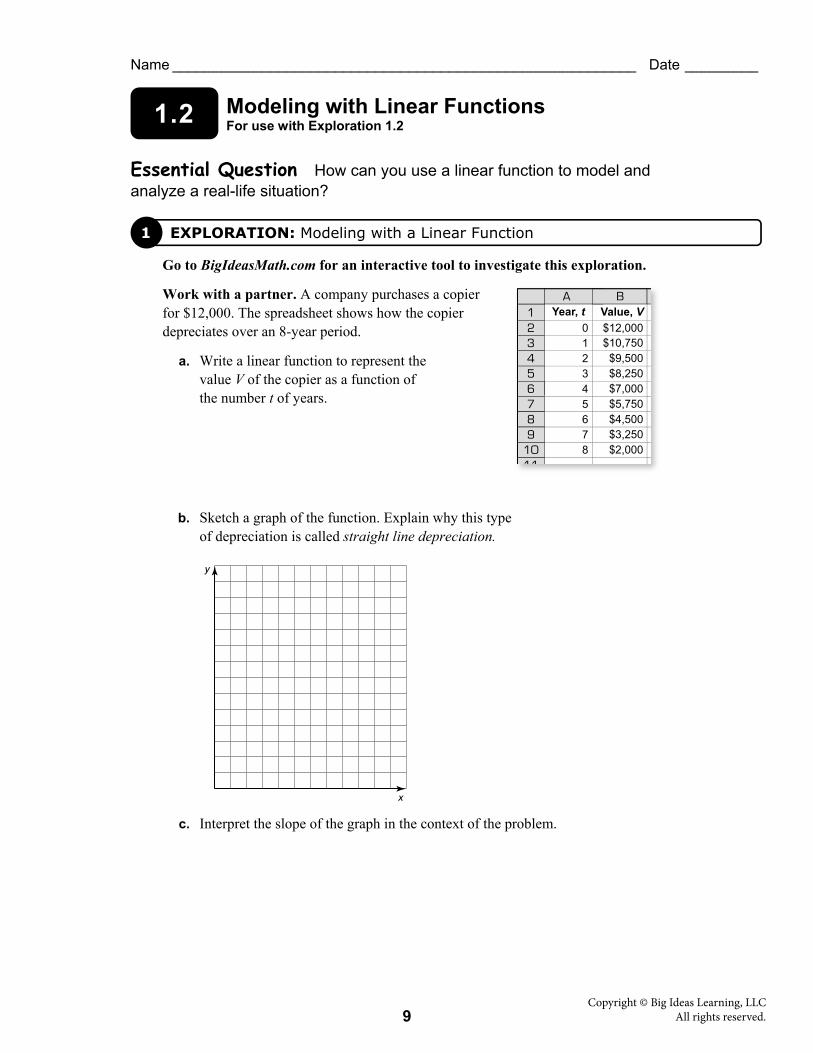
The table shows the numbers of tickets sold for a concert
Ticket price (dollars), x 17 20 22 26
Tickets sold, y 450 423 400 395
1. Understand the Problem You are given an equation that represents the total cost for an advertisement at the Greenville Journal and a table of values showing total costs for advertisements at the Daily Times. You need to compare costs.
2. Make a Plan Write an equation that models the total cost of advertisements at the Daily Times. Then compare the slopes to determine which newspaper charges less per line. Finally, equate the cost expressions and solve to determine the number of lines for which the total costs are equal.
Step 1 Draw a scatter plot of the data. The data show a linear relationship.
Step 2 Sketch the line that most closely appears to fi t the data. One possible line is shown.
Bat
tery
life
(%
)
00
20
40
60
80
Hours4 8 12 16 20 x
y
y = −4.55x + 91
Step 3 Choose two points on the line. For the line shown, you might choose (9, 50) and (20, 0).
Step 4 Write the equation of the line. First, fi nd the slope.
m = y2 − y1
— x2 − x1 = 0 − 50 —
20 − 9 = −50 —
11 ≈ −4.55
Use point-slope form to write an equation. Use (x1, y1) = (20, 0).
y − y1 = m(x − x1)
y − 0 = −4.55(x − 20)
y = −4.55x + 91
Use the equation to estimate the battery life.
y = −4.55(15) + 91 = 22.75
The approximate battery life after 15 hours is 23%.
16. Draw a scatter plot of the data. The data does not show a linear relationship.
Hea
rt r
ate
(bp
m)
00
20
40
60
80
100
120
Shoe size2 4 6 8 10 12 x
y
17. Enter the data into two lists. Use the linear regression feature. The line of best fi t is y = 380.03x + 11,290.
(x = 15).
y = 380.03(15) + 11,290
= 16,990.45
The approximate average annual tuition cost in the year 2020 is $16,990.45. The annual tuition increases by about $380 each year and the cost of tuition in 2005 is about $11,290.
18. Sample answer:
Step 1 Draw a scatter plot of the data. The data show a linear relationship.
Step 2 Sketch the limit that most closely appears to fi t the data. One possible line is shown.
Tick
ets
sold
00
100
200
300
400
Ticket price (dollars)4 8 12 16 20 24 28 x
y
y = −10x + 620
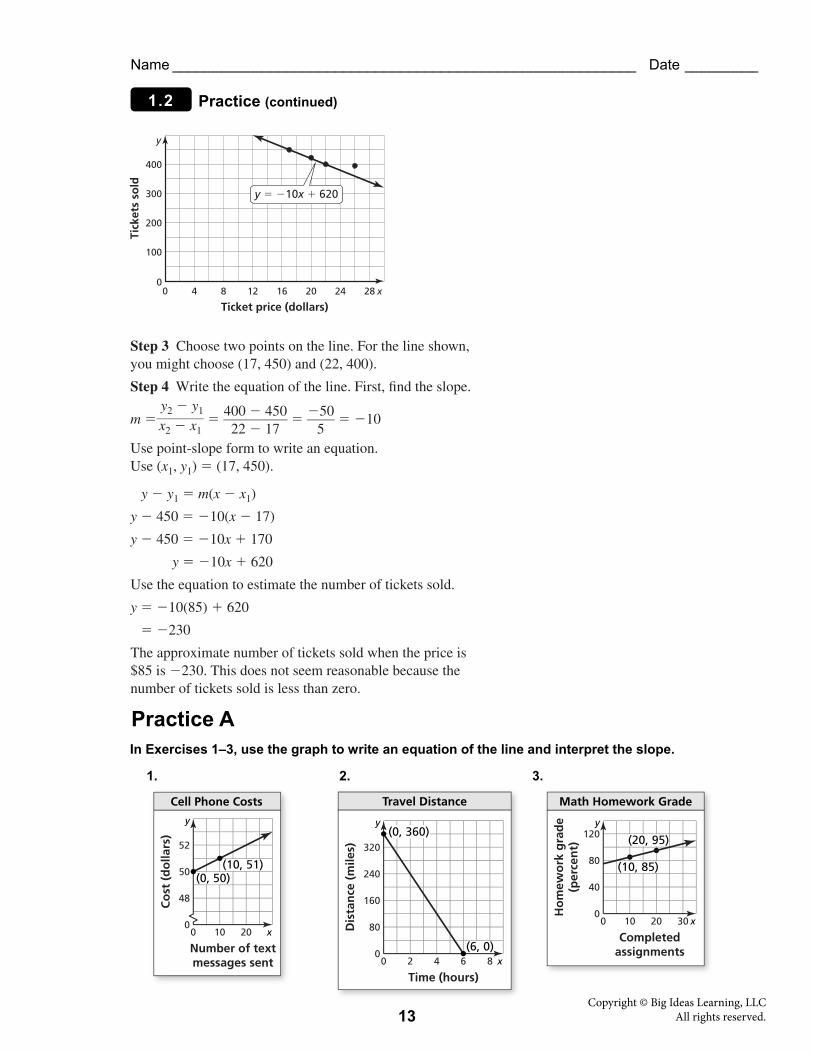
Step 3 Choose two points on the line. For the line shown, you might choose (17, 450) and (22, 400).
Step 4 Write the equation of the line. First, fi nd the slope.
m = y2 − y1
— x2 − x1 = 400 − 450 —
22 − 17 = −50 —
5 = −10
Use point-slope form to write an equation. Use (x1, y1) = (17, 450).
y − y1 = m(x − x1)
y − 450 = −10(x − 17)
y − 450 = −10x + 170
y = −10x + 620
Use the equation to estimate the number of tickets sold.
y = −10(85) + 620
= −230
The approximate number of tickets sold when the price is $85 is −230. This does not seem reasonable because the number of tickets sold is less than zero.
4. The cost of parking in a parking garage in Chicago is represented by the equation 15 20y x= + where y is the total cost (in dollars) and x is the time (in hours). The table
shows the total cost to park in a parking garage in Denver. Which city’s parking garage charges more per hour and by how much more? After how many hours would parking in both cities cost the same?
In Exercises 5–7, use the linear regression feature on a graphing calculator to find an equation of the line of best fit for the data. Find and interpret the correlation coefficient.
5. 6. 7.
Hours, x 2 3 4 5
Cost, y 43 51 59 67
x
y
4
2
0
8
6
420 86 x
y
20
10
0
40
30
420 86 x
y
4
2
0
8
6
420 86
1.2
Name _________________________________________________________ Date __________
Name _________________________________________________________ Date __________
2.3 Practice B
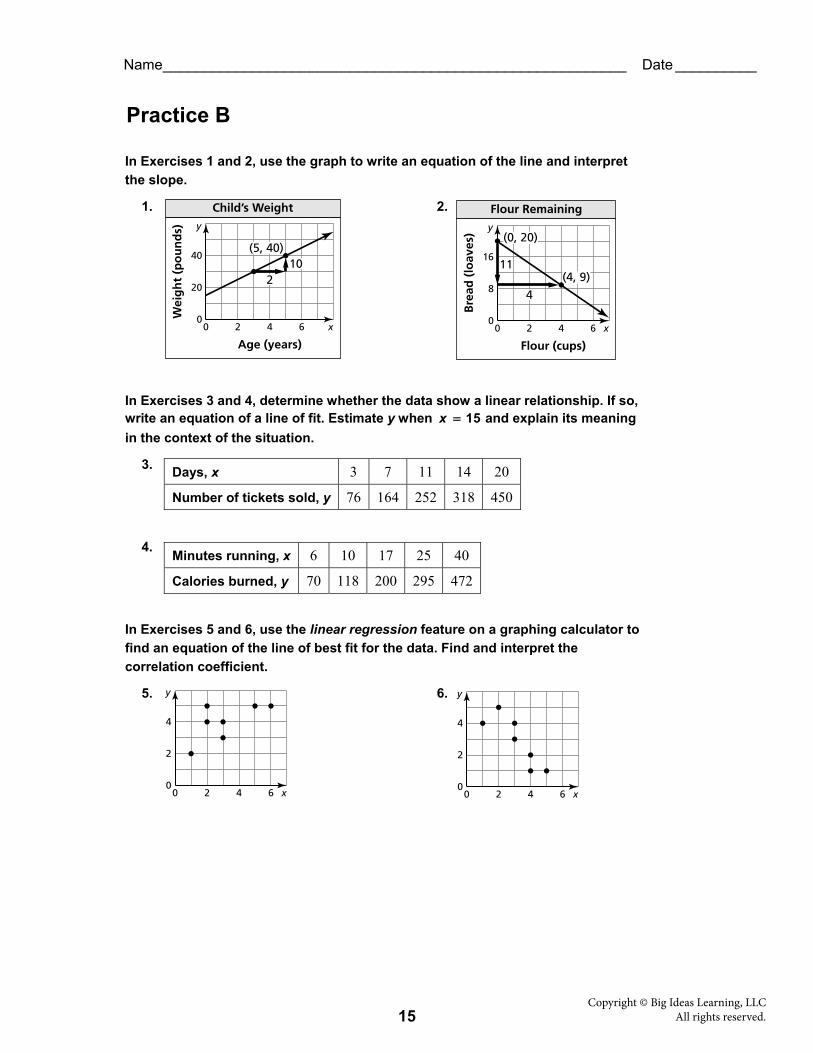
In Exercises 1 and 2, use the graph to write an equation of the line and interpret the slope.
1. 2.
In Exercises 3 and 4, determine whether the data show a linear relationship. If so, write an equation of a line of fit. Estimate y when x 15= and explain its meaning in the context of the situation.
3.
4.
In Exercises 5 and 6, use the linear regression feature on a graphing calculator to find an equation of the line of best fit for the data. Find and interpret the correlation coefficient.