93
1 Finance and Insurance: Converging or Diverging? Stephen Mildenhall May 2002
| Date post: | 27-Dec-2015 |
| Category: |
Documents |
| Upload: | kelly-harris |
| View: | 224 times |
| Download: | 0 times |

1
Finance and Insurance: Converging or Diverging?
Stephen MildenhallMay 2002
2
Overview
1. Underwriting What is underwriting? Examples of insurance structures Examples of securitization
2. Finance and Insurance Finance and Insurance compared Complete Markets Cat Bond Market Pricing

3
Overview
3. Insurance within Finance Business Demand for Insurance Insurer and non-Insurer Risk
Management Insurance Company Structures State of Insurance Industry Investor Reaction to 9/11
4. Conclusions

4
Historical Perspective Reform of insurance and banking laws Integration of banking and insurance
Partnerships (P/C) and Mergers (Life) with banks Banks as P/C intermediaries rather than risk
bearers Industry over- and under-capitalized
Low ROE, very low leverage ratios Conservative rating agency models One-time capital gains
But, inability to cope with large cats Industry using capital inefficiently?

5
Historical Perspective Wind-fall capital gains in late 1990s led
to savage price war and poor underwriting results 97-2000
Fragile industry shocked in 2001 9/11 terrorist attacks Enron Re-emergence of asbestos
Hard market, industry distressed Market not embracing securitization
solutions

6
1. Underwriting

7
What is Underwriting? Assess and quantify risks Attract capital to support writings
Existence of capital demonstrates uw competence to buyer
Provide infrastructure to issue policies, comply with regulation, adjust claims
May sound easy, but consider starting from scratch!

8
Insurance Policies Property Casualty focus
Auto liability (AL) and physical damage (APD) General liability (GL): Premises and Products Workers Compensation (WC): Statutory
cover, unlimited loss potential Homeowners Commercial property: Terrorism Umbrella (over AL, GL) Reinsurance
9
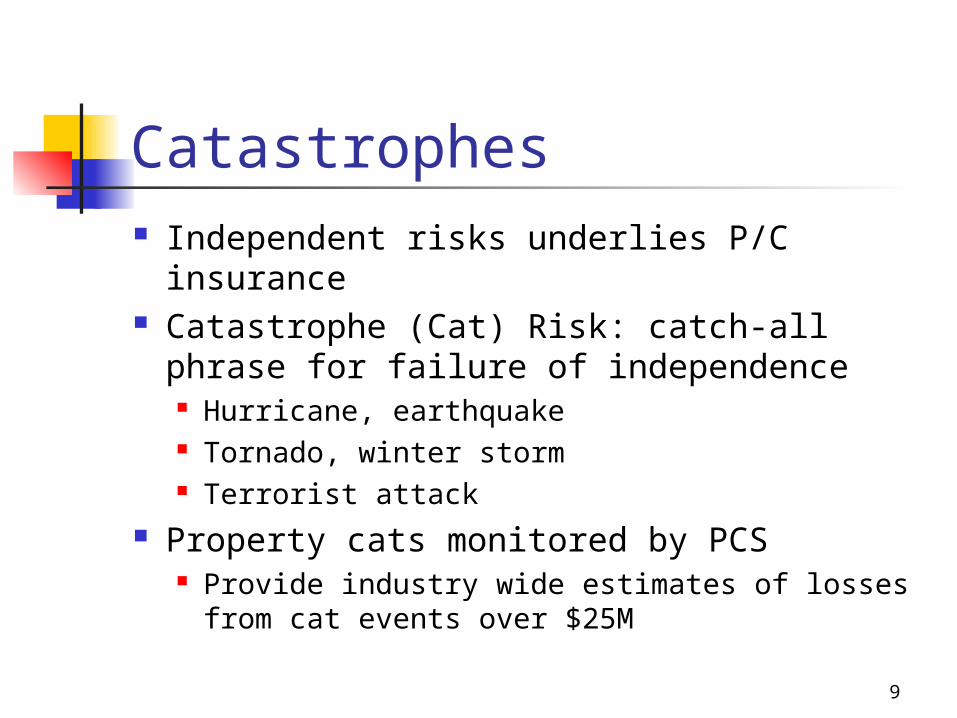
Catastrophes Independent risks underlies P/C insurance Catastrophe (Cat) Risk: catch-all phrase
for failure of independence Hurricane, earthquake Tornado, winter storm Terrorist attack
Property cats monitored by PCS Provide industry wide estimates of losses
from cat events over $25M

10
Overview of Cat Reinsurance Common catastrophe reinsurance covers
Per occurrence excess of loss $100M xs $150M per occurrence
Reinstatements 1 at 100%, 3 “pro rata as to time and amount”
Aggregate excess of loss – less common Catastrophe Models
Per location computation of loss costs and distribution of occurrence and aggregate losses
Consider specific location characteristics Soil type, distance to shore Construction type, building characteristics and use
1000’s of simulated events applied to each location

11
Overview of Cat Re Pricing of Cat Contracts
Expected losses typically determined by models Data quality a key concern
Premium markup 150% to 500% of expected loss
See Froot paper on www.guycarp.com Loss ratio = 1 / Markup Rate on line (ROL) = premium / line extended For a 1:100 year event
Loss cost approx. 1% on-line Rate or premium 1.5-5% on line Loss ratio 20% to 66%

12
Overview of Cat Re Retro: reinsurance for reinsurers
Greater uncertainty about underlying risks Poorer data quality for modeling Do not want to provide capacity to competitors
Capacity Industry surplus approx. $290B Large event: $100B WTC approx $30-50B, Andrew approx $20B
All risks coverage vs. named peril Key difference in WTC!

13
Overview of Cat Re
US Region100 Year Return
250 Year Return
Florida Wind $30B 41
S California EQ
15 27
New Madrid EQ
4.5 14
US Multi-Peril 59 115
Source: RMS
-Regional losses on occurrence basis; US total on aggregate basis-Loss amounts are gross insured loss, net of insured deductibles-Multi-peril loss includes EQ, fire-following, hurricane, tornado and hail-AM Best focuses on 250 year returns for EQ and Florida wind, and 100 year returns for non-Florida wind

14
Typical Reinsurance Structure Property
All individual risks “bought-down” to $10-20M per risk (location/event)
Facultative or Per Risk treaty Typically not considered cat exposed (fire,
explosion) Treaty occurrence coverage up to 250-1000
year event in several layers (tranches) Occurrence coverage harder to quantify Market crises after Andrew led to interest in
alternative structures and securitization

15
Securitization Bundling or repackaging of rights to future
cash flows for sale in the capital markets Transformation of uw cash flows into
securities Transfer of uw risk to the capital markets
Advantages to insurers More capacity No counter-party risk More favorable tax treatment (SPV offshore) Consistent capacity through market cycle

16
Securitization Characteristics of a successful deal
High retention, low probability of loss Capacity rather than frequency risk
Underlying risk uncorrelated with financial markets
Understandable, quantifiable risk Computerized cat models key to development
Short exposure period, quickly quantifiable losses
BB or better credit rating from Rating Agencies Liquid market

17
USAA Cat Bond First major securitization (June 1997)
Special Purpose Vehicle (SPV) Residential Re Protection: $400M part of $500M xs $1B retention
USAA participates in all lower layers Traditional reinsurance $400M part of $550M xs $450M
Two Tranches A1 Principal protected $164M @ LIBOR + 273 bps
(AAA) A2 Principal at risks $313M @ LIBOR + 576 bps (BB) Provides approx. $400M reinsurance protection
USAA writes personal lines for Armed Forces personnel and their families

18
USAA Cat Bond
Swap Counter-
party
USAA
Reg. 114 Trust
Residential Re Ltd
Collateral Account
Class A2 Principal Variable
Class A1 Extendible Principal Protected
Defeasance
Securities Counter-
party
6% Rate on line
$400 Reinsurance
Investment Earnings
LIBOR - 24 bps
$313
LIBOR + 576 bps
<=$313 @ redemption
$164
LIBOR + 273 bps
$164 @ maturity
$77 contingent on event
$164 @ maturity
$400 LIBOR Rem’gFunds
$77 LIBOR $77 @maturity
At risk cash flow
All amounts in $M

19
USAA Cat Bond Paying for the spread
Income: 6% ROL x $400M = $24M Expense: $23.65M + friction
24 bps on $477M = $1.15M 576 bps on $313M = $18.0M 273 bps on $164M = $4.5M
Renewal History (unprotected tranche) 1997, LIBOR + 576 bps, $400M total capacity 1998, LIBOR + 400 bps, $400M total capacity 1999, LIBOR + 366 bps, $200M total capacity 2000, LIBOR + 416 bps, $200M total capacity 2001, ??, $150M total capacity

20
Cat Bonds
Purchasers: Mutual funds Hedge funds Reinsurers Life Insurers Banks P/C Insurers

21
Cat Bonds SR Earthquake Fund, Ltd.
Swiss Re Securitized $112M of California Earthquake for 2 ¼ years
Related to reinsurance of CEA (Buffett connection) Trigger based on PCS industry losses
Tranche Rate ROL Trigger / Loss of Principal Rating
A1 L + 255 bps 4.25% 18.5B 20%; 21B 40%; 24B 60% BBB
A2 L + 280 bps 4.67% 18.5B 20%; 21B 40%; 24B 60% BBB
B L + 475 bps 4.75%18.5B 33%; 21B 67%; 24B 100%
BB
C L + 625 bps 6.25% 12.0B 100% NR

22
Cat Bonds SCOR / Atlas Re, 3/16/2000
$200M cat bond, multi-year, expires 2003 $100M xs $200M per event and $200M in aggregate
Reference portfolio, ensures data quality Allows better loss modeling Indemnity Payment = Ref. P/f Losses x Adj. Factor
Retro protection for SCOR, a reinsurer European wind, US EQ, Japanese EQ perils
Atlas Re based in Ireland Class A, $70M BBB+ @ LIBOR + 270 bps Class B, $30M BBB- @ LIBOR + 370 bps Class C, $100M B @ LIBOR + 1400 bps

23
Cat Bond Summary (97-2000)Deal Date Spread Trigger Peril
Res Re I 6/9/1997 576 Indemnity Various USSR Earthquake 7/16/1997 475 Index Ca EQParametric Re 11/19/1997 430 Parametric J EQTrinity Re 2/19/1998 367 Indemnity FL windHF Re 6/4/1998 375Res Re II 6/8/1998 400 IndemnityPacific Re 6/15/1998 370Mosaic Re A 7/14/1998 440XL Mid Ocean A 8/12/1998 412 Retro Swap/ReinsTrinity Re II 12/31/1998 417 5 month Fl Wind
Mosaic Re II 2/25/1999 400 RetroDomestic Inc 3/25/1999 369Concentric Ltd 5/3/1999 310 ParametricRes Re III 5/25/1999 366 IndemnityJuno Re 6/18/1999 420 IndemnityGold Eagle 11/16/1999 540 Model BasedNamazu Re 11/23/1999 450 Model BasedSeismic Ltd 3/1/2000 450 IndexAtlas Re 3/16/2000 370 Ref. Portfolio

24
Cat Bond Summary (00-01)
2000 Insurance Linked Securitization Deals
SPV CedentAmount US$M S&P Moody's Fitch
3/00-3/01 Issue Date
Maturity Term
Expos Term
Spread to
LIBOR
Adjusted Annual Spread
Expected Loss
Prob of 1st Loss
Prob Exhaust
Exp Excess Return CEL
Alpha Wind 2000 FRN Arrow Re St Farm 52.2 BB+ -- -- 1-May-00 12 12 456 462 0.63% 0.0099 0.0038 399 63.64%Alpha Wind 2000 Pref Shrs Arrow Re EW 37.5 BB- -- -- 1-May-00 12 12 700 710 1.46% 0.0208 0.0099 564 70.19%Residential Re 2000 USAA USAA 200 BB+ Ba2 -- 1-May-00 12 12 410 416 0.54% 0.0095 0.0031 362 56.84%NeHi Vesta Fire Ins. 41.5 -- -- BB 1-Jul-00 36 36 410 416 0.70% 0.0087 0.0056 346 80.46%Mediterranean Re Class A AGF 41 BBB Baa3 BBB 1-Nov-00 60 59 260 264 0.22% 0.0028 0.0017 242 78.57%Mediterranean Re Class B AGF 88 BB+ Ba3 BB+ 1-Nov-00 60 59 585 593 1.16% 0.0147 0.0093 477 78.91%PRIME Hurricane Munich Re 159 BB+ Ba3 BB 1-Nov-00 38 37 650 659 1.27% 0.0146 0.0108 532 86.99%PRIME EQEW Munich Re 129 BB+ Ba3 BB 1-Nov-00 38 37 750 760 1.33% 0.0169 0.0107 627 78.70%Western Capital Swiss Re 97 BB+ Ba2 -- 1-Feb-02 24 23 510 517 0.55% 0.0082 0.0034 462 67.07%Halyard Re Sorema 17 -- -- BB- 1-Mar-01 12 12 550 558 0.22% 0.0084 0.0004 538 26.19%Gold Eagle 2001 American Re 116.4 BB+ Ba2 -- 1-Mar-01 12 12 550 558 0.75% 0.0118 483 63.56%SR Wind Class A-1 Swiss Re Swiss Re 58.2 BB+ -- -- 1-May-01 48 48 575 583 0.68% 0.0107 0.0044 515 63.55%SR Wind Class A-2 Swiss Re Lehman Brothers58.2 BB+ -- -- 1-May-01 48 48 525 532 0.76% 0.0113 0.0053 456 67.26%NeHi Vesta Fire Ins. 8.5 -- -- -- 1-Jul-00 36 36 450 456 0.93% 0.0100 0.0087 363 93.00%PRIME Hurricane Munich Re 6 -- -- -- 1-Nov-00 38 37PRIME EQEW Munich Re 6 -- -- -- 1-Nov-00 38 37Western Capital Swiss Re 3 -- -- -- 1-Feb-01 24 23 0.82% 0.0082 100.00%Gold Eagle 2001 American Re 3.6 -- -- -- 1-Mar-01 12 12 700 710 1.18% 0.0118 0.0118 592 100.00%SR Wind Class B-1 Swiss Re Swiss Re 1.8 BB -- -- 1-May-01 48 48 700 710 1.07% 0.0107 0.0107 603 100.00%SR Wind Class B-2 Swiss Re Lehman Brothers 1.8 BB -- -- 1-May-01 48 48 650 659 1.13% 0.0113 0.0113 546 100.00%CEA 100 24SAAB AB SAAB AB 1170 1-Dec-00 180 180 367WestLB 44 1-May-00Tokio marine/St Farm Swap 200 1-Mar-00 60 60 Equal ProbRolls Royce
**Deals announted 3/00 to 3/01. All deals converted to 365-day year (LIBOR convention is 360 day, but cat bonds are 365 day years).Source: http://www.lanefinancialllc.com/pub/sec1/Analyzing_the_Pricing_of_the_2001_Risk-Linked_Securities_Transactions.pdf

25
Securitization Prospects: TriggersTrigger Pros/Cons ExampleIndemnity No basis risk
Need good under-standing of risk
USAA / Res. ReTrinity ReJuno Re
Model Minimize Basis RiskData quality risk borne by insuredFast payout after event
Namazu ReGold Eagle
Index Simplifies uw’ingLess disclosureBasis RiskGood for retro
ILWsSR Earthquake
Parametric Very simple uw’ingNo disclosureHigh basis risk
Tokyo DisneyParametric Re

26
Disclosure v. Risk Continuum
Index DealBasis Risk Equal to
Actual Loss v. Index ResultNo Disclosure of
Business and Underwriting
Processes
Cedent describes notional portfolio to modeling firm Cedent does not disclose its underwriting practices et cetera Cedent may update the notional portfolio every six months, if necessary Recovery based upon the notional portfolio using actual event characteristics Loss payments are made immediately after the modeled loss is run
Modeled Index Deal
Indemnity DealNo Basis Risk
Significant Disclosure of Business and
Underwriting Processes
Source: AON Capital Markets
Securitization Prospects: Triggers

27
Securitization Prospects Exchange Traded Instruments
CBOT Cat Index Property Claim Services (PCS) loss index 1 point in index corresponds to $100M industry losses European options, settled in cash National and various regional zones Typically sold as spreads
Layer of reinsurance Bermuda Commodity Exchange (BCE)
Similar to CBOT but based on Guy Carpenter loss-to-value index Index available at zip code level
Allows more accurate hedging, lower residual basis risk Can cover largest loss, second largest loss, aggregate losses Binary options (pay all or nothing), six month term
Unsuccessful Accounting; out of the ordinary

28
Securitization Prospects Securitization of other lines?
Balance desirability to investor with undesirability for insurer
Does not make sense for insurer to securitize low volatility, predictable lines
Many products (perceived as) too heterogeneous
MBS secondary market led to standardization Would standardization be a bad thing for insurance?
Credit risk (Gerling/SECTRS) and lease residual value (Toyota/Gramercy Place) have been Securitized

29
Securitization Prospects Contingent Capital
Put option arranged prior to event Option on debt or (convertible) preferred shares
Provides immediate extra capitalization after large event
Gives greater operational flexibility in challenged market place
Allows company to capitalize on opportunities Balance sheet protection rather than
income statement protection Not limited to insurance companies

30
Securitization Prospects Contingent Capital
AON CatEPut®
RLI $50M convertible preferred shares through Centre Re (Ca EQ exposure)
Horace Mann, $100M multi year deal (cw cat) LaSalle Re $55M with Swiss Re
Triggered by 9/11 property losses $55M equity in convertible shares put to Swiss Re LaSalle Re Gross property losses > $140M Requirements on net worth post-event LaSalle Re now owned by Trenwick Group

31
Securitization Prospects Risk Swaps
CATEX internet based market for swapping risks
E.g. Florida wind and California quake Reduces risk for minimal cost
No ceded premium Expected loss and probability
distributions swapped roughly comparable
No event, no cash flow Opposite of mean preserving spreadAll companies
believe their underwriters are
better than average
I’m not swapping my
carefully selected
Florida risks with your
trash!
Problem:

32
Securitization Prospects Risk Swaps
State Farm / Tokio Marine & Fire $200M Limit Earthquake exposure: Japanese and US New Madrid
quake Coverage triggered by magnitude of event, not loss State Farm receives
17.5% of limit for 6.6R quake 100% of limit for 7.1R+ quake
Diversifies risk and reduces net exposure No premium outgo, no brokerage
Many other opportunities exist, even within US

33
2. Finance and Insurance

34
Finance and Insurance
ParadigmCapital Markets
Insurance Markets
Risk and Return
Systematic risk
Price non-systematic
risk
Diversification
CAPM, APT, CIR, Partial & General
Equilibrium Models
Risk Bearing through pooling
HedgingOptions pricing,
Comparables, No-arbitrage
Traditionally impossible,
Reinsurance!
Efficient Markets
Long/short positions, liquid, transparent
markets, standardization
Insurable interest, unique products
35
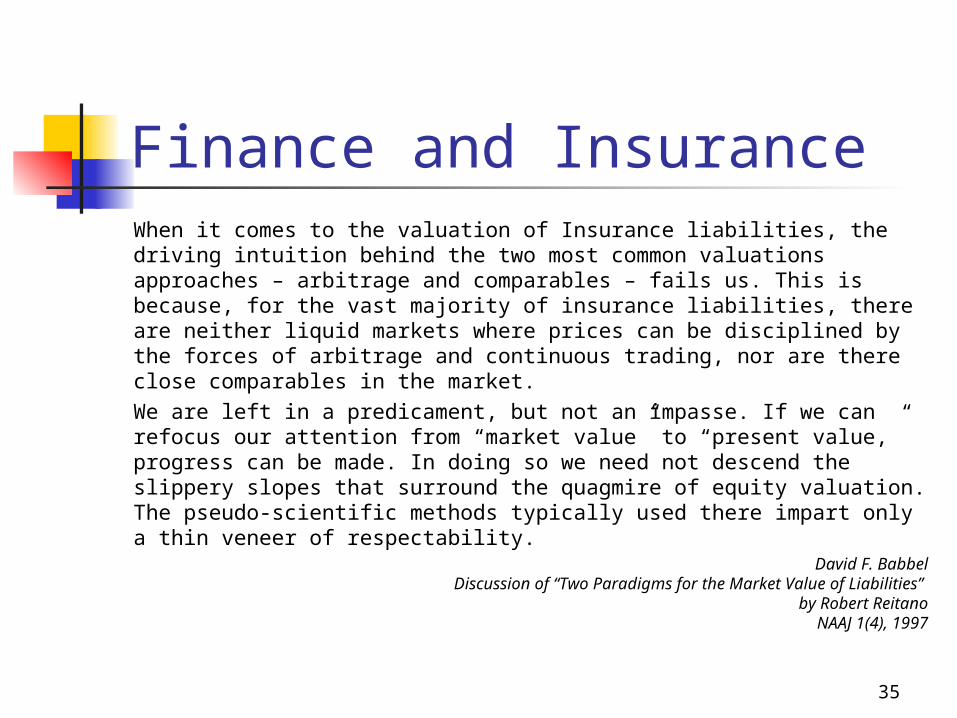
Finance and InsuranceWhen it comes to the valuation of Insurance liabilities, the driving intuition behind the two most common valuations approaches – arbitrage and comparables – fails us. This is because, for the vast majority of insurance liabilities, there are neither liquid markets where prices can be disciplined by the forces of arbitrage and continuous trading, nor are there close comparables in the market.We are left in a predicament, but not an impasse. If we can refocus our attention from “market value” to “present value,” progress can be made. In doing so we need not descend the slippery slopes that surround the quagmire of equity valuation. The pseudo-scientific methods typically used there impart only a thin veneer of respectability.
David F. BabbelDiscussion of “Two Paradigms for the Market Value of Liabilities”
by Robert ReitanoNAAJ 1(4), 1997

36
Finance and Insurance Complete Markets and Insurance
Complete Market: every pattern of cash flows can be replicated by some portfolio of securities that are traded in the market
Insurance products are not redundant: they add to the set of available securities
Cannot use arbitrage-free pricing techniques to determine price of non-redundant securities
Cannot construct replicating / hedging portfolio Incompleteness is a selling point
Obvious benefit to insured Creates assets uncorrelated to the market for investor

37
Finance and Insurance Complete Markets and Insurance
Financial option pricing methodologies since Black and Scholes (1973) define option prices as the hedging cost to set up a riskless hedge portfolio. Financial options are treated as redundant contracts, since they can be replicated by trading the underlying assets. The so-called “relative valuation” method prices financial options in the world of the risk-neutral measure. On the actuarial side, there is no liquid secondary market for insurance contracts; thus, insurance and reinsurance contracts are viewed as non-redundant, primary contracts to complete the market. Actuarial risk models that price insurance liability contracts are not based on an assumption of hedging, instead considering the present value of future losses (loss theory) and the cost of allocated capital. The pricing is done in the world of the objective measure.
Portfolio-Based Pricing of Residual Basis Risk with Application to the S&P 500 Put Options
Sergei Esipov and Dajiang Guo2000 Discussion Paper Program
Casualty Actuarial Society

38
Finance and Insurance Complete Markets and Insurance
Econophysics New slant on applying statistics to economics time
series Recognize short-comings of Gaussian based models Price options by minimizing non-zero residual basis risk
Consider variation in total wealth from writing option Consider impact of “thick-tails” Alternatives to variance based risk measures Alternatives to multivariate normal distribution for
correlation Theory of approach more clearly applicable to
insurance Fruitful area for future research

39
Finance and InsuranceIn our opinion, mathematical finance in the past decades has over focused on the concept of arbitrage free pricing, which relies on very specific models where risk can be eliminated completely. This leads to a remarkably elegant and consistent formalism, where derivative pricing amounts to determining the risk-neutral probability measure, which in general does not coincide with the historical measure. In doing so, however, many important and subtle features are swept under the rug, in particular the amplitude of the residual risk. Furthermore, the fact that the risk-neutral and historical probabilities need not be the same is often an excuse for not worrying when the parameters of a specific model deduced from derivative markets are very different from historical ones. … In our mind, this rather reflects that an important effect has been left out of the models, which in the case of interest rates is a risk premium effect.
Back to Basics: historical option pricing revisitedJ-P Bouchaud and M Potters
1998xxx.lanl.govcond-mat/9808206
Emphasis added

40
Finance and Insurance: Comparison of Pricing Methods
HedgeBlack-Scholes idealizationAdjust probabilities
Diversify StockBondInsuranceCat Bond
Real world financial option
Dual-trigger financial/ insurance instrument
No arbitrage / comparables
determine unique price
No general theoryto determine unique price
Trade to Manage
Diversify to Manage

41
Finance and Insurance Comparison of Pricing Methods
Insurance shares concepts and structures with finance Swaps and Options Excess of Loss Insurance
Actuarial Pricing No consensus on risk and profit loads Searching for general equilibrium theory Risk-Adjusted interest rates
Related to CAPM / APT arguments Correlations with existing book of business
Wang and adjusted probabilities Related to risk neutral, no-arbitrage theories Additive in layers
Numerous risk-load approaches used in industry Insurers (must) price non-systematic risk
Costly for insurers to raise capital Benefit to non-insurers from laying off risk

42
Market Pricing for Cat Bonds
Pricing Cat Bonds Relationship to corporate bond pricing and to
insurance pricing Consistency with financial theories
Issue of skewness in asset returns Greed: Positive skewness is perceived as good Fear: Negative skewness is perceived as bad
Insurance returns are negatively skewed You do well, you do OK You do badly, you get killed
Most asset returns are symmetric or positively skewed
Insurance isabout details!

43
Market Pricing for Cat Bonds
Ba Bonds1
Typical Cat Bond
Spread over 1-year Treasuries
1.6%1 2.5-5.8%
1 year default prob 1.4%2 0.5-2.0%
10 year default prob 20.9%2 8.0-20.0%
Expected Recovery Rate
47.5%2 32.0%
Risk / Reward Multiple3
1.14 2.9-7.2
Source: CNA Re Securitization 2000
1 Bloomberg BB Composite of Moody’s Ba2 and S&P BB; one year data2 Moody’s 1938-1996 default rates3 Excess return above risk free rates as multiple of prob of 1 year default
44
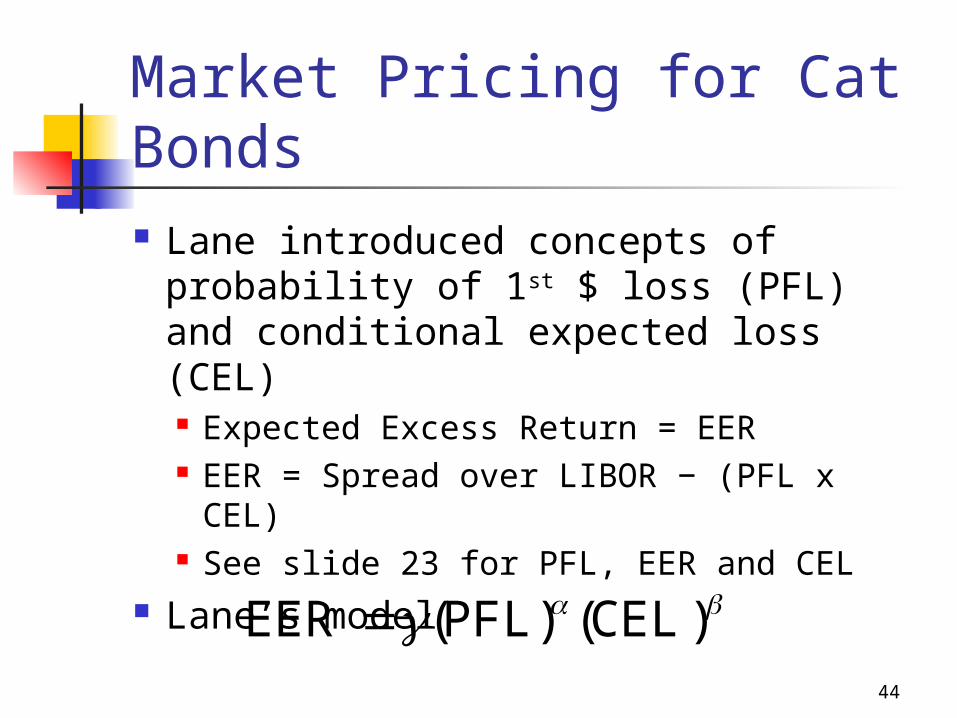
Market Pricing for Cat Bonds Lane introduced concepts of
probability of 1st $ loss (PFL) and conditional expected loss (CEL) Expected Excess Return = EER EER = Spread over LIBOR − (PFL x
CEL) See slide 23 for PFL, EER and CEL
Lane’s model )CEL()PFL(EER

45
Market Pricing for Cat Bonds Lane model pragmatic and
provides good fit Mainstream finance would suggest
either CAPM or adjusted probability approach
46
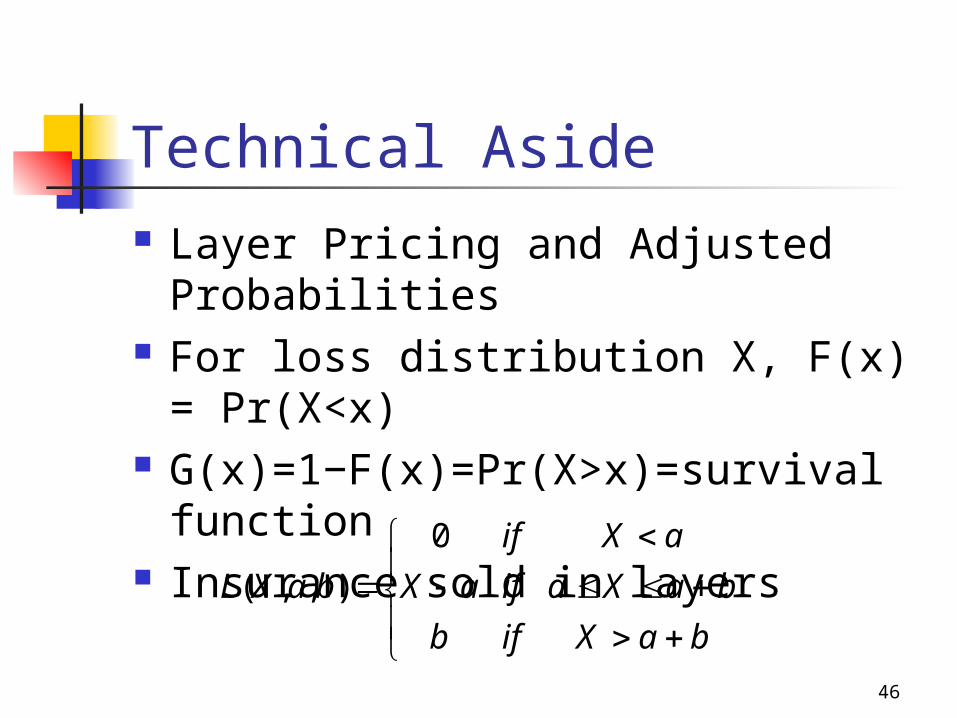
Technical Aside Layer Pricing and Adjusted
Probabilities For loss distribution X, F(x) =
Pr(X<x) G(x)=1−F(x)=Pr(X>x)=survival
function Insurance sold in layers
baX
baXa
aX
if
if
if
b
aXbaXL
0
),,(

47
Technical Aside Expected value of layer
Price of short layer (small b)
Relate to market pricing for layers to get adjusted distribution G* Similar to risk-neutral valuation method
used in option pricing
ba
a
dxxGbaXEL )(),,(
baGbaXEL )(),,(

48
Market Pricing for Cat Bonds Wang Two-Factor Model, uses
adjusted-probability paradigm A relation between physical
probability distribution F and risk-neutral probability distribution F*
Q a student-t distribution
))(()(* yFQyF 1

49
Market Pricing for Cat Bonds Wang’s approach captures several
different risk characteristics Lambda variable equivalent to a Sharpe ratio Use of normal in place of student-t for Q
Translates normal to normal and lognormal to lognormal
Reproduces CAPM and Black-Scholes Use of student-t distribution for Q captures
parameter uncertainty in pricing Works symmetrically for assets and liabilities Correctly captures market reaction to skewness in
returns

50
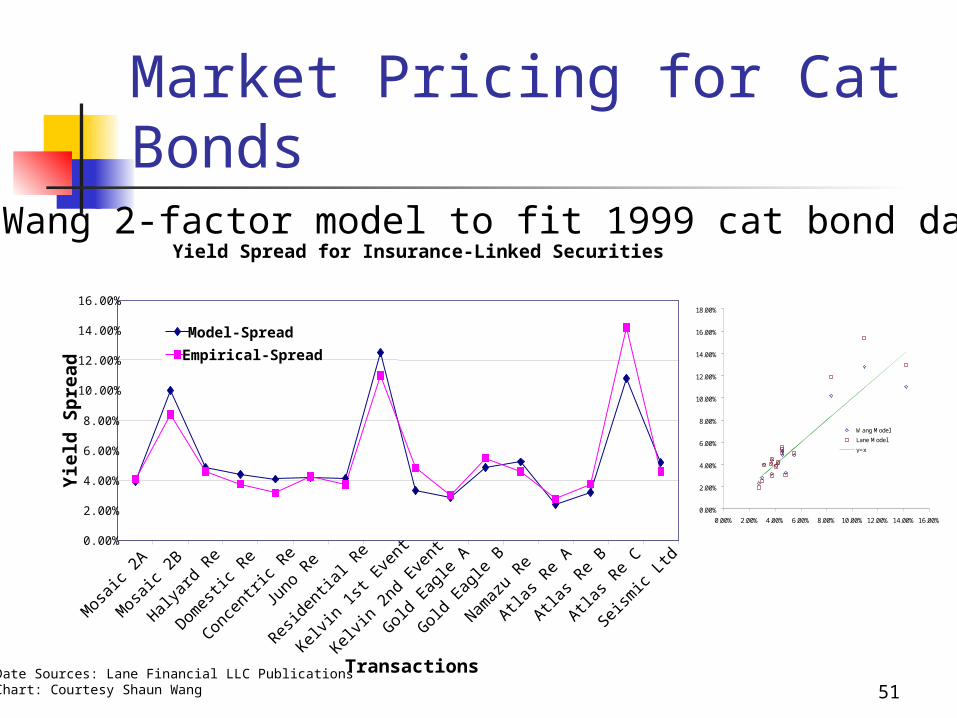
Market Pricing for Cat Bonds
16 CAT-bond transactions in 1999
Fitted well to 2-factor model Over/under-priced bonds are
identified, consistent with Lane study
12 CAT bond transactions in 2000
Used parameters estimated from 1999 data to price 2000 transactions
Remains best-fit: good consistency over time
1999 Cat Bond TransactionEmpirical Spread
Wang Model Lane Model
Mosaic 2A 4.06% 3.88% 3.80%Mosaic 2B 8.36% 10.15% 11.83%Halyard Re 4.56% 4.82% 5.01%Domestic Re 3.74% 4.36% 4.45%Concentric Re 3.14% 4.01% 3.97%Juno Re 4.26% 4.15% 4.16%Residential Re 3.71% 4.08% 4.03%Kelvin 1st Event 10.97% 12.80% 15.34%Kelvin 2nd Event 4.82% 3.25% 3.02%Gold Eagle A 2.99% 2.81% 2.51%Gold Eagle B 5.48% 4.82% 5.03%Namazu Re 4.56% 5.20% 5.52%Atlas Re A 2.74% 2.35% 1.92%Atlas Re B 3.75% 3.15% 2.90%Atlas Re C 14.19% 11.01% 12.90%Seismic Ltd 4.56% 5.13% 5.38%Sum Squared Error 0.22% 0.41%
51
Market Pricing for Cat Bonds
Yield Spread for Insurance-Linked Securities
0.00%
2.00%
4.00%
6.00%
8.00%
10.00%
12.00%
14.00%
16.00%
Mos
aic 2
A
Mos
aic 2
B
Halyar
d Re
Domes
tic R
e
Conce
ntric
Re
Juno
Re
Reside
ntial
Re
Kelvin
1st E
vent
Kelvin
2nd
Event
Gold E
agle
A
Gold E
agle
B
Namaz
u Re
Atlas R
e A
Atlas R
e B
Atlas R
e C
Seism
ic Lt
d
Transactions
Yie
ld S
pre
ad
Model-Spread
Empirical-Spread
Date Sources: Lane Financial LLC PublicationsChart: Courtesy Shaun Wang
Wang 2-factor model to fit 1999 cat bond data
0.00%
2.00%
4.00%
6.00%
8.00%
10.00%
12.00%
14.00%
16.00%
18.00%
0.00% 2.00% 4.00% 6.00% 8.00% 10.00% 12.00% 14.00% 16.00%
Wang Model
Lane Model
y=x

52
Market Pricing for Cat Bonds
0.00%
1.00%
2.00%
3.00%
4.00%
5.00%
6.00%
7.00%
8.00%
Alpha
Win
d 200
0 FRN
Alpha
Win
d 200
0 Pre
f Shs
Resid
entia
l Re
2000
NeHi
Med
iterra
nean R
e A
Med
iterra
nean R
e B
Prime
Hurrica
ne
Prime
EQEW
Wes
tern
Cap
ital
Gold E
agle
200
1
SR Win
d Cla
ss A
-1
SR Win
d Cla
ss A
-2
Transactions
Yie
ld S
pre
ad
Model-Spread
Empirical-Spread
Date Sources: Lane Financial LLC PublicationsChart: Courtesy Shaun Wang
2000 Cat Bond spreads predicted by 1999 parameters

53
Market Pricing for Bonds Apply same model to corporate bonds
Fit yield spreads using historical default probability and yield spread by bond rating
Wang 2-factor model fits data well The parameter is similar to cat-bond, but
Q-degree of freedom less severe Market perceives greater parameter uncertainty
in cat-bonds Reasonable, given huge volume of data on
corporate bonds Correlations exist between corporate bonds and
between cat bonds

54
Market Pricing for Bonds
0
200
400
600
800
1,000
1,200
1,400
AAA AA A BBB BB B CCC
Bond Rating
Yie
ld S
pre
ad (
bas
is p
oin
ts)
Model Fitted Spread
Actual Spread
Wang 2-factor model fit to corporate bond spreads by bond rating

55
3. Insurance within Finance

56
Business Demand for Insurance
Insurance below economic cost is always a good investment
Information asymmetries can hinder development of insurance markets Business purchasers have informational
advantage or can influence market Weather derivatives and energy companies Lease residual value and original
manufacturers Names and Lloyds in 1980s

57
Business Demand for Insurance
Miller-Modigliani Tax Contracting costs Impact of financing policy on firm’s investment
decisions (!) Mayers and Smith
Comparative advantage in risk bearing Transaction costs of bankruptcy Real service efficiencies (claims expertise) Monitoring and bonding management decisions Tax
58
Business Demand for Insurance Froot, Scharfstein, Stein
Key to creating corporate value is making good investments
Need to generate enough cash internally to fund investments
Companies tend to cut investments rather than use external capital when they do not raise enough internally
Informational opacity of insurer operations makes raising capital expensive
Managing cash flow becomes key Other
“Be there” when the “market turns” Protecting franchise
PV(income from future business)

59
Business Demand for Insurance Evolution through soft-
market Quarterly earnings –
Reliance, insolvent Weather, rainfall –
continuing small market Commodity prices Multi-year, multi-line
aggregates – still not common

60
ERM Enterprise Risk Management Holistic assessment and management of
all risks facing enterprise Insurer ERM interesting microcosm of
non-insurer ERM How do insurers manage the risks no-one
else wants? Small risks – handle cheaply Large risks – mitigate effectively and
maximize security

61
ERM: Non-Insurers What are the large events that could impact the
company? “Keep you up at night” events Large exposures often first party rather than third
party Damage to property Rogue trading
ERM framework essential for understanding and managing risk
You cannot manage what you cannot measure Risk to shareholders is from entire enterprise
Investors certainly indifferent to arbitrary compartmentalization of risk

62
ERM: Non-Insurers Operational flexibility
Pricing Relative competitive
advantage Focus on core-
competencies Lower cost of capital
Credit enhancement Greater leverage
Internal capital budgeting and project planning
Higher stock market valuation multiples
Deliver consistent earnings
Protect franchise value
Capitalize on market opportunities
Tax benefits Bonus protection and
job security Would you work for an
uninsured entity?

63
Who is the CRO? Treasury / CFO
Manage financial risks
May have more corporate-wide view
Risk Manager Manages traditional
insurance coverages Less comfortable
with financial risks
Turf-war mentality and inter-departmental nature of problem seen as major stumbling block for ERM. Cited as major obstacle in Honeywell/AIG integrated deal.
Risk Manager
HR
Treasury
Op. Depts
Legal
64
Earnings Management Consistent earnings is one stated goal of ERM Is goal consistent with financial theory?
CAPM ignores non-systematic risk Myers-Skinner (1998) shows companies on earnings
“winning streak” have incentive to continue streak Higher valuation multiples Bigger drop when growth falters
Do not comment on why valuations high Types of earnings management
Demonstrate actual earnings more effectively Match one-time expense and gains Misleading investors on source or level of income

65
Earnings Management Consistent earnings: good or bad?
Until Enron, Global Crossing, consistent earnings were considered good: GE, AIG
Advantages of consistent earnings Consistent earnings results in virtuous circle of
higher credit rating, lower cost to borrow, larger scale (GE Capital)
Disadvantages Hides true risk in business, lowering required return Confuses and misleads investors and analysts

66
ERM: Insurers ERM most common amongst financial
companies Insurer ERM similar to non-insurer ERM ERM clearly essential to insurer:
Maintaining strong balance sheet mission-critical
Volatile portfolios Insurer-reinsurer relations good laboratory
for studying enterprise-insurer relations

67
ERM: Insurers Costs of financial distress
Rating essential Higher price for more
secure product Cost of credit
Capital: expensive to replace
Asymmetric information in new equity issues
Insurer reluctance to release proprietary information
Easy to change risk portfolio
High costs and taxation discourage dividends
Regulation
Costs of volatility of results
Concave tax schedules Hard for analysts to track
true performance Prevents company from
investing in profitable business opportunities
Capital: an expensive way to manage risk
Double taxation of investment earnings
Lower ROE Perils of corporate bloat,
owner-manager agency problem

68
ERM: Insurers Asset Risks
Credit, market, interest rate, counter-party, inflation
Liability / Actuarial Risks Cat, non-cat, reserve development, APMT,
ALAE, legal, coverage reinterpretations Operating / Management Risks
Compliance, systems, business environment, regulation
Event Risk Front page risk

69
ERM: Insurers Managing asset risk
Impossible on risk-adjusted basis? Insurers hold conservative investment portfolios
Managing total risk of liabilities
D* optimal diversifi-cation, balancing cost of doing business & leveraging uw expertise
Graph from Myers-Read, 2001
D*

70
Insurance Company Structure Different organizational forms in
insurance industry correspond to different ERM and agency problem and concerns
Instructive to review these for different structures Stock Mutual Securitized
Cummins and Nini (2000)

71
Insurance Company Structure Owners, policyholders and managers
have different goals and objectives Owners and Managers:
Managers do not fully share in residual claim held by owners
Have incentive to behave opportunistically Owners and Policyholders:
Owners have incentive to change risk structure of company to increase value of equity

72
Insurance Company Structure Owner-Manager conflict
Increased leverage reduces conflict Increases probability of insolvency
Costly for managers Decreases free cash flow
Harder to purchase perquisites For fixed management share of company,
increases proportionate ownership

73
Insurance Company Structure Owner-Policyholder conflict
Decreased leverage reduces conflict Risky investments more valuable to owners Lower leverage reduces attractiveness to owners
Optimal capital structure a trade-off between benefits of increased leverage (minimize owner-manager conflict) and decreased leverage (owner-policyholder)

74
Insurance Company Structure
Stock Insurance Companies Mutual Insurance Companies
Helps minimize owner-managerconflicts
Merge owners and policyholdersGood for less sophisticated pol’holders
Owners and manager interests more effectively aligned
• Hard to quantify risk• Uw discretion vital• Difficult for owners to track and
control uw actions• Sophisticated and knowledgeable
policyholders
Solves owner-policyholder conflicts
Stock Mutual
Where isSecuritizedsolution?• Easy to quantify risk
• Little/no need for uw discretion• Easy for owners to track and
control uw actions• Important because mechanisms
available for owners to controlmanagers more limited

75
Insurance Company Structure
Mutual companies more common in personal lines, WC Stock companies more common in commercial and
specialty lines Where does securitized solution fit?
“UW and done” approach divorces uw decision from results Does not appear to solve owner-manager conflict or owner-
policyholder conflict Cat bonds involve very little or no underwriting
judgment Minimize potential owner-manager conflict Similar to mutual fund structure

76
State of Insurance Industry
-2.7%-6%
-3%
0%
3%
6%
9%
12%
15%
1986
1988
1990
1992
1994
1996
1998
2000Property Casualty Statutory Return on Surplus1986-00 Average: 9.2%
After-tax SAP ROS including capital gainsAM Best + Preliminary estimate for 2001 from ISSlide from NCCI AIS Presentation, 2002

77
State of Insurance Industry Throughout early to mid-1990s leverage ratios
declined and returns moderate to good Leverage driven down by one-time capital gains Lower leverage ratios not economically justified Companies reluctant to dividend gains to
investors per standard ERM rationale Over-capacity and competition for market share
led to effective policy-holder dividend through inadequate pricing
Cummins and Nini, 2000

78
State of Insurance Industry1985-2001p Average Growth in NWP: +5.2%1985-2001p Average Growth in Surplus: +8.8%
0
100
200
300
400
500
1985
1986
1987
1988
1989
1990
1991
1992
1993
1994
1995
1996
1997
1998
1999
2000
2001
p
0.0
0.5
1.0
1.5
2.0
2.5
NWP Surplus P:S RatioPreliminary 2001 estimates from ISO News Release, April 15, 2002Source: AM Best Aggregates & AveragesSlide from NCCI AIS, 2002

79
State of Insurance Industry US P/C Industry combined surplus:
12/31/99: $334.3B 2000: $317.4B (-5%) 2001: $279.0B* (-12%) 2002: $271.5B* (-3%)
* AM Best Estimate Previous declines since 1970
1983/4: $56B to $53B (-6%) 1972/4: $21.4B to $14.8B (-30%)
80
State of Insurance Industry Contraction of commercial lines
capacity A&E, prior year development, WTC
Operating income crucial Depleted capital base Rating agencies emphasize earnings Apparent investor indifference to existing
companies vs Bermuda start-ups Low interest rates

81
State of Insurance Industry Low Interest Rates emphasize
importance of underwriting result After 1983/4 decline in surplus, net
investment income 28% of prior year surplus 2002 net investment income estimated to be
11.5% of prior year surplus, 16.5 ppts lower Industry needs combined ratios in high-
90%’s for reasonable ROE Last achieved in 1970’s

82
Aside: Asbestos Current estimate: 100 million people
occupationally exposed to asbestos Huge increase over 27.5M from 1982 study
200,000 asbestos BI claims pending in courts
60,000 new claims filed in 2000 Average only 20,000 per year from early 1990’s 2,000 mesothelioma cases per year 2,000-3,000 cancer cases 54,000 claims for nonmailgnant injuries

83
Aside: Asbestos Producer
Bankruptcies Claim deadline to
get on creditor list Claims against
peripheral defendants 300 main defendants
in 1980’s Now over 2,000 named
defendants Move from products
liability to premises policies
Claims filed now in anticipation of legal reforms or statute of limitations
Plaintiffs attorneys group claims: Multiple defendants (installers,
electricians) Range of injuries Increases costs for adjudicating
claims Jurisdiction shopping (Mississippi)
3
0 0
1 1 1
0
2
3
1
2 2
0
1 1
0
1 1
4
7

84
Aside: Asbestos AAA study estimates ultimate cost to be
$200-275 billion $60-70 billion borne by US P/C industry At year end 2000:
$22 billion paid $10 billion reserves $30-40 billion shortfall
Look for 1.5-2.0 point drag on industry combined ratio
Environmental costs stabilized

85
State of Industry: Concentration
Winner-takes-all AIG (Hank Greenberg)
$177B Berkshire (Warren
Buffett): $114B State Farm $38B SAP Allstate $28B AZ = Allianz AG, huge
German insurer Market Cap of 31 leadingP/C & general insurancegroups, totaling $500BDetail shown for top 10
AIG
BRKa
AZ
ALL
TAPa
CB
PGR
XL
SPC
ACE Others
Market values shown unless otherwise indicated

86
9/11: Capital Market Reaction Securitization advocates had great
expectations Market disappointed Reaction swift and consistent
Group Capital Raised 9/11 Loss Net New Capital Pct TotalBermuda Startups 6.3B 0.0 6.3 58%Existing Bermuda Cos. 3.5 1.8 1.7 16%North American Cos. 2.3 1.1 1.2 11%Lloyds/London 1.0 0.1 0.9 8%Other 2.4 1.7 0.7 6%Total 15.5 4.7 10.8 100%
All amounts in $BSource: IBNR Weekly 1/6/2002

87
9/11: Capital Market Reaction Investors utilizing Bermuda companies
and start-ups, rather than existing US-based P/C companies No A & E hang-over No reserve development on prior years Tax and accounting benefits New shells a “clean play” for investors to
“flip” 75% of net capital went to Bermuda

88
9/11: Capital Market Reaction Securitized solution not suited to opportunistic
writings and exercise of underwriting judgment Even stock startups have difficulty “putting capital to
work” Underwriting and technical talent greater constraint
than capital Stability and availability arguments for
securitization paradoxically not holding General commercial line crunch led to greatly
increased capacity Mitigated capacity shortage for property cat

89
4. Conclusions

90
Conclusions Underwriting is key
Must be a close relationship between underwriter and capital
Must control owner/manager agency problem
Solution supports stock insurance structure when underwriter discretion and freedom of action required
Securitization does not address agency problem

91
Conclusions Securitization not taking
off Great opportunity post-9/11 Investments almost entirely
in (new) stock insurance companies
Convergence with financial institutions – stepping backwards?
Travelers and Citigroup GE and ERC – sell-off rumors
$0M
$200M
$400M
$600M
$800M
$1,000M
$1,200M
1997 1998 1999 2000 2001
0
2
4
6
8
10
12
14Num Deals
Limits

92
Conclusions Insurance companies still best suited
to bearing hard-to-quantify risk Special Risk Insurance and Reinsurance,
Luxembourg SA (SRIR) Joint venture of Allianz, Hannover Re, Swiss
Re, XL Capital, Zurich Financial Services, SCOR
$440M insurance capacity against terrorism Stock companies have ability to allow uw’ing
flexibility and “bet taking” Hard for dis-integrated securitized product

93
References and Links Links and references are available
on my web site, along with a copy of this presentation:
http://www.mynl.com/pptp/bolnick2002.shtml Please email any comments on this
presentation to me at [email protected]


