1 Fixed Rank Kriging for Cellular Coverage Analysis Hajer Braham, Sana Ben Jemaa, Gersende Fort, Eric Moulines and Berna Sayrac Abstract—Coverage planning and optimization is one of the most crucial tasks for a radio network operator. Efficient cov- erage optimization requires accurate coverage estimation. This estimation relies on geo-located field measurements which are gathered today during highly expensive drive tests (DT); and will be reported in the near future by users’ mobile devices thanks to the 3GPP Minimizing Drive Tests (MDT) feature [1]. This feature consists in an automatic reporting of the radio measurements associated with the geographic location of the user’s mobile device. Such a solution is still costly in terms of battery consump- tion and signaling overhead. Therefore, predicting the coverage on a location where no measurements are available remains a key and challenging task. This paper describes a powerful tool that gives an accurate coverage prediction on the whole area of interest: it builds a coverage map by spatially interpolating geo- located measurements using the Kriging technique. The paper focuses on the reduction of the computational complexity of the Kriging algorithm by applying Fixed Rank Kriging (FRK). The performance evaluation of the FRK algorithm both on simulated measurements and real field measurements shows a good trade- off between prediction efficiency and computational complexity. In order to go a step further towards the operational application of the proposed algorithm, a multicellular use-case is studied. Simulation results show a good performance in terms of coverage prediction and detection of the best serving cell. Keywords—Wireless Network, Coverage Map, Radio Environ- ment Map, Spatial Statistics, Fixed Rank Kriging, Expectation- Maximization algorithm. I. I NTRODUCTION Coverage planning and optimization is one of the most crucial tasks for a radio network operator. Efficient coverage optimization requires accurate coverage estimation. This es- timation relies on geo-located field measurements, gathered today during highly expensive drive tests (DT) and will be reported in the near future by users’ mobile devices thanks to the 3GPP Minimization of Drive Tests (MDT) feature standardized since Release 9 [2]. The radio measurements together with the best possible geo-location will be then automatically reported to the network by the user’s mobile device. Thanks to the integration of Global Positioning System (GPS) in the new generation of users’ mobile devices, the geo- location information is quite accurate. Hence, with MDT, the network operator will soon have at his disposal a rich source of information that provides a greater insight into the end-user perceived quality of service and a better knowledge of the radio environment. H. Braham is with Orange Labs research center, Issy-Les-Moulineaux, France and T´ el´ ecom ParisTech, Paris, France. S. Ben Jemaa and B. Sayrac are with Orange Labs research center, Issy- Les-Moulineaux, France. G. Fort and E. Moulines are with LTCI T´ el´ ecom ParisTech & CNRS, Paris, France. The collection and exploitation of location aware radio measurements was introduced much earlier in the literature in the context of the cognitive radio paradigm [3]. The radio En- vironmental Map (REM) concept was introduced by Zhao [4] as a database that stores geo-located radio environmental information mainly for opportunistic spectrum access. The REM concept was then extended to an entity that not only stores geo-located radio information but also post processes this information in order to build a complete map. The missing information, namely the considered radio metric in locations where no measurements are available, is then predicted by interpolating the geo-located measurements [5]–[7]. The REM was then studied in the framework of European Telecommunications Standards Institute (ETSI) as a tool for the exploitation of geo-located radio measurements for the radio resource management of mobile wireless networks. A technical report dedicated to the definition of use-cases for building and exploiting the REM gives the following defini- tion [8]: ”The Radio Environment Map (REM) defines a set of network entities and associated protocols that trigger, perform, store and process geo-located radio measurements (received signal strength, interference levels, Quality of Service (QoS) measurements [...]) and network performance indicators. Such measurements are typically performed by user equipments, net- work entities or dedicated sensors.” In this ETSI report, several use-cases for REM exploitation in radio resource management are described such as coverage and capacity optimization, and interference management especially for the introduction of a new technology. Inspired by the geo-statistics area, Kriging technique was ap- plied to REM construction, mainly for coverage prediction and analysis in radio mobile networks [9]–[11]. Bayesian Kriging was first applied to 3G Received Signal Code Power (RSCP) coverage prediction in [9], then to Long Term Evolution (LTE) Reference Signal Received Power (RSRP) coverage analysis in [10]. The description of the bayesian Kriging methodology and the algorithm used in [9], [10], is detailed in [11]. These papers give promising results in terms of performance. However the computational complexity of the algorithm increases cubically with the number of measurement points (∼ O(N 3 ), where N is the number of measurement points). In this paper, we aim at providing a method for predict- ing LTE RSRP coverage map based on MDT data. Given the huge number of measurements that will be reported by mobile terminals with MDT in the near future, reducing the computational complexity of the REM construction becomes crucial. In [12], [13], we used the Fixed Rank Kriging (FRK) introduced by Cressie in [14] (also called in the literature Spatial Random Effects model), as a method to reduce the computational complexity of the Kriging technique applied to radio coverage prediction; the method was evaluated on arXiv:1505.07062v2 [cs.OH] 14 Mar 2016
Transcript
1
Fixed Rank Kriging for Cellular Coverage AnalysisHajer Braham, Sana Ben Jemaa, Gersende Fort, Eric Moulines and Berna Sayrac
Abstract—Coverage planning and optimization is one of themost crucial tasks for a radio network operator. Efficient cov-erage optimization requires accurate coverage estimation. Thisestimation relies on geo-located field measurements which aregathered today during highly expensive drive tests (DT); and willbe reported in the near future by users’ mobile devices thanks tothe 3GPP Minimizing Drive Tests (MDT) feature [1]. This featureconsists in an automatic reporting of the radio measurementsassociated with the geographic location of the user’s mobiledevice. Such a solution is still costly in terms of battery consump-tion and signaling overhead. Therefore, predicting the coverageon a location where no measurements are available remains akey and challenging task. This paper describes a powerful toolthat gives an accurate coverage prediction on the whole area ofinterest: it builds a coverage map by spatially interpolating geo-located measurements using the Kriging technique. The paperfocuses on the reduction of the computational complexity of theKriging algorithm by applying Fixed Rank Kriging (FRK). Theperformance evaluation of the FRK algorithm both on simulatedmeasurements and real field measurements shows a good trade-off between prediction efficiency and computational complexity.In order to go a step further towards the operational applicationof the proposed algorithm, a multicellular use-case is studied.Simulation results show a good performance in terms of coverageprediction and detection of the best serving cell.
Coverage planning and optimization is one of the mostcrucial tasks for a radio network operator. Efficient coverageoptimization requires accurate coverage estimation. This es-timation relies on geo-located field measurements, gatheredtoday during highly expensive drive tests (DT) and will bereported in the near future by users’ mobile devices thanksto the 3GPP Minimization of Drive Tests (MDT) featurestandardized since Release 9 [2]. The radio measurementstogether with the best possible geo-location will be thenautomatically reported to the network by the user’s mobiledevice. Thanks to the integration of Global Positioning System(GPS) in the new generation of users’ mobile devices, the geo-location information is quite accurate. Hence, with MDT, thenetwork operator will soon have at his disposal a rich sourceof information that provides a greater insight into the end-userperceived quality of service and a better knowledge of the radioenvironment.
H. Braham is with Orange Labs research center, Issy-Les-Moulineaux,France and Telecom ParisTech, Paris, France.
S. Ben Jemaa and B. Sayrac are with Orange Labs research center, Issy-Les-Moulineaux, France.
G. Fort and E. Moulines are with LTCI Telecom ParisTech & CNRS, Paris,France.
The collection and exploitation of location aware radiomeasurements was introduced much earlier in the literature inthe context of the cognitive radio paradigm [3]. The radio En-vironmental Map (REM) concept was introduced by Zhao [4]as a database that stores geo-located radio environmentalinformation mainly for opportunistic spectrum access. TheREM concept was then extended to an entity that not onlystores geo-located radio information but also post processesthis information in order to build a complete map. The missinginformation, namely the considered radio metric in locationswhere no measurements are available, is then predicted byinterpolating the geo-located measurements [5]–[7].
The REM was then studied in the framework of EuropeanTelecommunications Standards Institute (ETSI) as a tool forthe exploitation of geo-located radio measurements for theradio resource management of mobile wireless networks. Atechnical report dedicated to the definition of use-cases forbuilding and exploiting the REM gives the following defini-tion [8]: ”The Radio Environment Map (REM) defines a set ofnetwork entities and associated protocols that trigger, perform,store and process geo-located radio measurements (receivedsignal strength, interference levels, Quality of Service (QoS)measurements [...]) and network performance indicators. Suchmeasurements are typically performed by user equipments, net-work entities or dedicated sensors.” In this ETSI report, severaluse-cases for REM exploitation in radio resource managementare described such as coverage and capacity optimization, andinterference management especially for the introduction of anew technology.
Inspired by the geo-statistics area, Kriging technique was ap-plied to REM construction, mainly for coverage prediction andanalysis in radio mobile networks [9]–[11]. Bayesian Krigingwas first applied to 3G Received Signal Code Power (RSCP)coverage prediction in [9], then to Long Term Evolution (LTE)Reference Signal Received Power (RSRP) coverage analysis in[10]. The description of the bayesian Kriging methodology andthe algorithm used in [9], [10], is detailed in [11]. These papersgive promising results in terms of performance. However thecomputational complexity of the algorithm increases cubicallywith the number of measurement points (∼ O(N3), where Nis the number of measurement points).
In this paper, we aim at providing a method for predict-ing LTE RSRP coverage map based on MDT data. Giventhe huge number of measurements that will be reported bymobile terminals with MDT in the near future, reducing thecomputational complexity of the REM construction becomescrucial. In [12], [13], we used the Fixed Rank Kriging (FRK)introduced by Cressie in [14] (also called in the literatureSpatial Random Effects model), as a method to reduce thecomputational complexity of the Kriging technique appliedto radio coverage prediction; the method was evaluated on
arX
iv:1
505.
0706
2v2
[cs
.OH
] 1
4 M
ar 2
016
2
simulated data (see [12]) and on real field data (see [13]),both in the situation of a single cell with an omni-directionalantenna. In this paper, we go a step further towards operationalapplication of the REM prediction algorithm by consideringa multicellular use-case: the directivity of the antennas isintroduced in the model, and both the coverage predictionand the good detection of the best serving cell are part ofthe statistical analysis.
The contribution of this paper can be summarized in thefollowing:• We describe the FRK algorithm and its adaptation to
radio coverage data. It requires an estimation step ofthe unknown parameters of the model: we show that themethod of moments proposed in [14] can not apply andwe derive a Maximum Likelihood alternative.
• We extend our model to a multicellular use-case withdirective antennas.
• We evaluate the performances of the proposed algo-rithms both on simulated and real data.
The paper is organized as follows: Section II starts with anoverview of the propagation models existing in the literature.Then the statistical parametric model is introduced. The lastpart is devoted to the parameter estimation: the applicability ofthe original method is discussed, and an alternative is given.In Section III, the extension to the multicellular use-case isdetailed. Then the numerical analysis in the single cell andmulticellular use-cases are provided in Section IV. Finally,Section V summarizes the main conclusions.
II. RADIO ENVIRONMENT MAP PREDICTION MODELS
In this section, we give an overview of basic propagationmodels and give some notations that will be used in theremainder of this paper. Then we introduce a new model forREM construction, which is adapted from the FRK modelproposed in [14].
A. Introduction to propagation modeling and notationsA radio propagation model describes a relation between the
signal strength, and the locations of the transmitter and thereceiver. There are in the literature two different approaches forthis description which are respectively derived using analyticaland empirical methods [15]. The analytical approach is basedon fundamental principals of the radio propagation concept.The empirical one introduces a statistical model and uses a setof observations to fit this model. The advantage of the secondapproach is the use of actual field measurements to estimatethe parameters of the model.
Denote by Z(x) the received power at the receiver endlocated at x ∈ R2, expressed in dB. The path-loss model,also called in the literature the log-distance model, is amongthe analytical approaches. It describes Z(x) as a logarithmi-cally decreasing function of the distance dist(x) between thetransmitter location and the receiver location x (see e.g. [15]):
Z(x) = pt − 10κ ln10(dist(x)), x ∈ R2; (1)
pt is the transmitted power in dB and κ is the path lossexponent. When using this formula to predict the REM,
pt is considered as known since it is one of the antennacharacteristic, and κ depends on the propagation environment.For example, κ is in the order of 2 in free space propagationand it is larger when considering an environment with obstacles(see e.g. [15], [16]).
The model in Eq. (1) does not take into account the factthat two mobile Equipment (ME) equally distant from the basestation (BS), may have different environment characteristics.To tackle this bottleneck, empirical approaches based on a sta-tistical modeling of the shadowing effect have been introduced.The log-normal shadowing model consists in setting (see [17])
where (ν(x))x, introduced to capture the shadowing effect,is a standard Gaussian variable (note that the terminology“log-normal” comes from the fact that the shadowing termexpressed in dB is normally distributed), and σν > 0. Withthis model, the REM prediction at location x is Z(x) =pt − 10κ ln10(dist(x)). The unknown parameters pt and κare estimated from measured data, usually by the maximumlikelihood estimator (which is also the least-square estimatorin this Gaussian case).
Both the models (1) and (2) are large-scale propagationmodels: they do not consider the small fluctuations of thereceived power due to the local environment. The correlatedshadowing model captures these small-scale variations:
Z(x) = pt − 10κ ln10(dist(x)) + ν(x), x ∈ R2, (3)
where (ν(x))x is a zero mean Gaussian process with a para-metric spatial covariance function (C(x, x′))x,x′ . This modelimplies that two signals Z(x), Z(x′) at different locationsx, x′ are correlated, with covariance equal to C(x, x′). TheREM prediction formula based on the model (3) is knownin the literature as the Kriging (see e.g. [18]): the predic-tion Z(x) is the conditional expectation of Z(x) given themeasurements. It depends linearly on these measurements (see[18, Eq. (3.2.12)]) and involves a computational cost O(N3),where N is the number of measurement points. Here again,the prediction necessitates the estimation of the parameters:different parameter estimation approaches were proposed (seee.g. [18], [19] for maximum likelihood, or [11], [18] for aBayesian approach). This model was applied to REM inter-polation in [11], [19], [20] and this technique has proved torealize accurate prediction performances.
All the models above assume that the antennas are omni-directional. Nevertheless, in macro-cellular networks, operatorsusually deploy directional antennas. Hence, the received powerdepends also on the direction of reception. To fit the modelto this new constraint, several papers proposed to modify themodel (2) by adding a term G(x) depending on the mobilelocation x and modeling the antenna gain (see e.g. [21], [22]):for x ∈ R2,
Z(x) = pt − 10κ ln10(dist(x)) + G(x) + ν(x). (4)
Different gain functions G are proposed, depending on the an-tenna used for the transmission (for example, a polar antenna,a sectorial antenna, . . .); see e.g. [22]–[24]. The function G
3
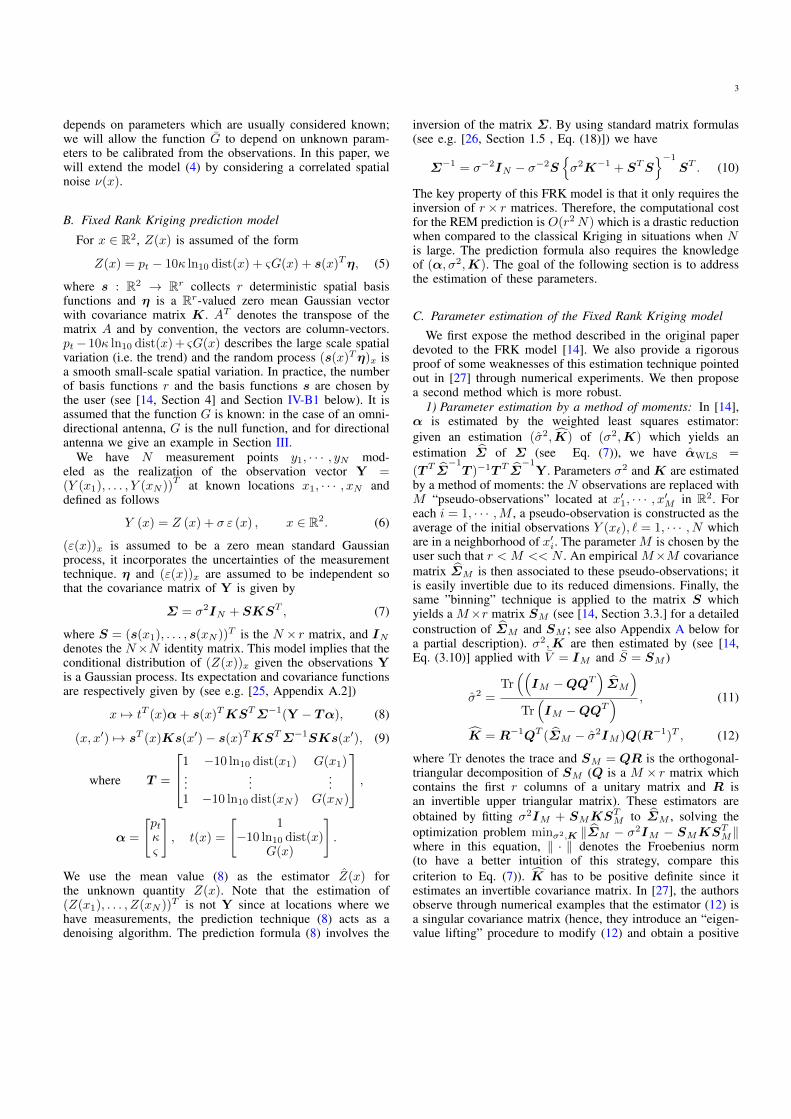
depends on parameters which are usually considered known;we will allow the function G to depend on unknown param-eters to be calibrated from the observations. In this paper, wewill extend the model (4) by considering a correlated spatialnoise ν(x).
where s : R2 → Rr collects r deterministic spatial basisfunctions and η is a Rr-valued zero mean Gaussian vectorwith covariance matrix K. AT denotes the transpose of thematrix A and by convention, the vectors are column-vectors.pt− 10κ ln10 dist(x) + ςG(x) describes the large scale spatialvariation (i.e. the trend) and the random process (s(x)Tη)x isa smooth small-scale spatial variation. In practice, the numberof basis functions r and the basis functions s are chosen bythe user (see [14, Section 4] and Section IV-B1 below). It isassumed that the function G is known: in the case of an omni-directional antenna, G is the null function, and for directionalantenna we give an example in Section III.
We have N measurement points y1, · · · , yN mod-eled as the realization of the observation vector Y =(Y (x1), . . . , Y (xN ))
T at known locations x1, · · · , xN anddefined as follows
Y (x) = Z (x) + σ ε (x) , x ∈ R2. (6)
(ε(x))x is assumed to be a zero mean standard Gaussianprocess, it incorporates the uncertainties of the measurementtechnique. η and (ε(x))x are assumed to be independent sothat the covariance matrix of Y is given by
Σ = σ2IN + SKST , (7)
where S = (s(x1), . . . , s(xN ))T is the N × r matrix, and INdenotes the N×N identity matrix. This model implies that theconditional distribution of (Z(x))x given the observations Yis a Gaussian process. Its expectation and covariance functionsare respectively given by (see e.g. [25, Appendix A.2])
x 7→ tT (x)α+ s(x)TKSTΣ−1(Y − Tα), (8)
(x, x′) 7→ sT (x)Ks(x′)− s(x)TKSTΣ−1SKs(x′), (9)
where T =
1 −10 ln10 dist(x1) G(x1)...
......
1 −10 ln10 dist(xN ) G(xN )
,
α =
[ptκς
], t(x) =
[1
−10 ln10 dist(x)G(x)
].
We use the mean value (8) as the estimator Z(x) forthe unknown quantity Z(x). Note that the estimation of(Z(x1), . . . , Z(xN ))T is not Y since at locations where wehave measurements, the prediction technique (8) acts as adenoising algorithm. The prediction formula (8) involves the
inversion of the matrix Σ. By using standard matrix formulas(see e.g. [26, Section 1.5 , Eq. (18)]) we have
Σ−1 = σ−2IN − σ−2S{σ2K−1 + STS
}−1ST . (10)
The key property of this FRK model is that it only requires theinversion of r× r matrices. Therefore, the computational costfor the REM prediction is O(r2N) which is a drastic reductionwhen compared to the classical Kriging in situations when Nis large. The prediction formula also requires the knowledgeof (α, σ2,K). The goal of the following section is to addressthe estimation of these parameters.
C. Parameter estimation of the Fixed Rank Kriging model
We first expose the method described in the original paperdevoted to the FRK model [14]. We also provide a rigorousproof of some weaknesses of this estimation technique pointedout in [27] through numerical experiments. We then proposea second method which is more robust.
1) Parameter estimation by a method of moments: In [14],α is estimated by the weighted least squares estimator:given an estimation (σ2, K) of (σ2,K) which yields anestimation Σ of Σ (see Eq. (7)), we have αWLS =
(T T Σ−1T )−1T T Σ
−1Y. Parameters σ2 and K are estimated
by a method of moments: the N observations are replaced withM “pseudo-observations” located at x′1, · · · , x′M in R2. Foreach i = 1, · · · ,M , a pseudo-observation is constructed as theaverage of the initial observations Y (x`), ` = 1, · · · , N whichare in a neighborhood of x′i. The parameter M is chosen by theuser such that r < M << N . An empirical M×M covariancematrix ΣM is then associated to these pseudo-observations; itis easily invertible due to its reduced dimensions. Finally, thesame ”binning” technique is applied to the matrix S whichyields a M×r matrix SM (see [14, Section 3.3.] for a detailedconstruction of ΣM and SM ; see also Appendix A below fora partial description). σ2,K are then estimated by (see [14,Eq. (3.10)] applied with V = IM and S = SM )
σ2 =Tr((IM −QQT
)ΣM
)
Tr(IM −QQT
) , (11)
K = R−1QT (ΣM − σ2IM )Q(R−1)T , (12)
where Tr denotes the trace and SM = QR is the orthogonal-triangular decomposition of SM (Q is a M × r matrix whichcontains the first r columns of a unitary matrix and R isan invertible upper triangular matrix). These estimators areobtained by fitting σ2IM + SMKS
TM to ΣM , solving the
optimization problem minσ2,K ‖ΣM − σ2IM − SMKSTM‖where in this equation, ‖ · ‖ denotes the Froebenius norm(to have a better intuition of this strategy, compare thiscriterion to Eq. (7)). K has to be positive definite since itestimates an invertible covariance matrix. In [27], the authorsobserve through numerical examples that the estimator (12) isa singular covariance matrix (hence, they introduce an “eigen-value lifting” procedure to modify (12) and obtain a positive
4
definite matrix (see [27, Section 3.2.])). We identify sufficientconditions for this empirical observation to be always valid.More precisely, we establish in Appendix A the following,
Proposition 1: Assume that SM is a full rank matrix andlet SM = QR be its orthogonal-triangular decomposition (Qis a M × r matrix which collects the first r columns of aunitary matrix). Denote by (λj)j the eigenvalues of ΣM andVj the eigenspace of λj . Then
(i) ΣM is positive semi-definite.(ii) σ2 given by (11) is lower bounded by
infj:∃v∈Vj ,‖QT v‖<‖v‖ λj .(iii) K given by (12) is positive definite iff σ2 ∈
[0, λmin(QT ΣMQ)) where λmin(A) denotes the mini-mal eigenvalue of A.
We also give in Appendix A a sufficient condition whichimplies that the minimal eigenvalue (say λ1) of ΣM is positive.If there exists v ∈ Vi such that ‖QT v‖ = ‖v‖ then QT vis an eigenvector of QT ΣMQ associated to the eigenvalueλi (observe indeed that if ‖QT v‖ = ‖v‖, then there existsµ ∈ Rr such that v = Qµ and this vector satisfies µ = QT v).Therefore, if λ1 > 0 and for any v ∈ V1, ‖QT v‖ = ‖v‖ thenProposition 1 implies that K given by (12) can not be positivedefinite.
2) Parameter estimation by Maximum Likelihood: We pro-pose to estimate the parameters by the Maximum LikelihoodEstimator (MLE), following an idea close to that of [28], [29].Observe from (5) and (6) that Y = Tα + Sη + σε withε = (ε(x1), · · · , ε(xN ))T . This equation shows that from Y,it is not possible to estimate a general covariance matrix Ksince roughly speaking, Y is obtained from a single realizationof a Gaussian vector η with covariance matrix K. Therefore,we introduce a parametric model for this covariance matrix,depending on some vector υ of low dimension: we will writeK(υ). We give an example of such a parametric family inSection IV-B2; see also [25, Chapter 4].
Since η and (ε(x))x are independent processes, Y is aRN -valued Gaussian vector with mean Tα and with covari-ance matrix Σ = σ2IN + SK(υ)ST . Therefore the log-likelihood LY(θ) of the observations Y given the parametersθ = (α, σ2, υ) is, up to an additive constant,
LY(θ) = −1
2ln det(σ2IN + SK(υ)ST )
− (Y − Tα)T
2σ2
(IN − S
{σ2K−1(υ) + STS
}−1ST)· · ·
× (Y − Tα) , (13)
where we used (10) for the expression of Σ−1. Maximizingdirectly the log-likelihood function θ 7→ LY(θ) is not straight-forward and cannot be computed analytically. We thereforepropose a numerical solution based on the Expectation Maxi-mization (EM) algorithm [30]. EM allows the computation ofthe MLE in latent data models; in our framework, the latentvariable is η. It is an iterative algorithm which produces asequence (θ(l))l≥0 satisfying LY(θ(l+1)) ≥ LY(θ(l)). Thisproperty is fundamental for the proof of convergence of anyEM sequence [31]. Each iteration of EM consists in two steps:
an Expectation step (E-step) and a Maximization step (M-step). Given the current value θ(l) of the parameter, the E-step consists in the computation of the expectation of the log-likelihood of (Y,η) under the conditional distribution of ηgiven Y for the current value of the parameter θ(l):
Q(θ;θ(l)) = E[ln Pr(Y,η;θ)|Y;θ(l)
],
where θ 7→ Pr(Y,η;θ) is the likelihood of (Y,η). In the M-step, the parameter is updated as the value maximizing θ 7→Q(θ;θ(l)) or as any value θ(l+1) satisfying
Q(θ(l+1);θ(l)) > Q(θ(l);θ(l)) . (14)
The E- and M-steps are repeated until convergence, which inpractice may mean when the difference between ‖θ(l)−θ(l+1)‖changes by an arbitrarily small amount determined by the user(see e.g. [30, Chapter 3]). In our framework, we have
Q(θ; θ) = −N2
ln(σ2)− 1
2ln(det(K(υ)))− 1
2σ2‖Y − Tα‖2
− 1
2Tr
((STS
σ2+K−1(υ)
)E[ηηT |Y; θ
])
+1
σ2(Y − Tα)TSE
[η|Y; θ
], (15)
where (see e.g. [12, Appendix C])
E[η|Y; θ
]=(STS + σ2K−1(υ)
)−1ST (Y − T α) ,
cov[η|Y; θ
]=
(STS
σ2+K−1(υ)
)−1.
The update formulas of the parameters (α, σ2) are given by(see e.g. [12, Appendix B] for the proof)
α(l+1) =(T TT
)−1T T
(Y − S E
[η|Y;θ(l)
]),
σ2(l+1) =
1
NE[∥∥Y − Tα(l+1) − Sη
∥∥2 |Y;θ(l)
].
With this choice, we have Q(α(l+1), σ2(l+1), υ;θ(l)) ≥
Q(θ(l);θ(l)), for any υ. The update of υ is specific to eachparametric model for K. Upon noting that the first orderderivative of υ = (υ1, · · · , υp) 7→ Q(α, σ2, υ;θ(l)) w.r.t. υkis given by
− 1
2Tr
(K−1(υ)
∂K(υ)
∂υk
)
+1
2Tr
(K−1(υ)E
[ηηT |Y;θ(l)
]K−1(υ)
∂K(υ)
∂υk
), (16)
υ(l+1) can be defined as the unique root of this gradientwhenever it is the global maximum. Another strategy is toperform one iteration of a Newton-Raphson algorithm startingfrom υ(l) with a step size chosen in order to satisfy the EMcondition (14). See e.g. [30, Section 4.14] for EM combinedwith Newton-Raphson procedures. In Section IV-B2, we willgive an example of structured covariance matrix and will derivethe Newton-Raphson strategy to update one of the parameters.
5
III. REM EXTENDED TO MULTICELLULAR NETWORK
We now consider a multicellular LTE network. In realnetwork, UEs measure the received power of several BSs inorder to choose the best serving one: the UE, this procedureis called the cell selection. In LTE, cell selection is applied bycomparing the instant measured RSRP from all potential cellsand choosing the cell providing the highest RSRP value [32].In this section, we adapt the FRK model and the REMprediction technique described in Section II-B in order toaddress this multicellular use-case.
We assume that the reported measurements correspond tothe RSRP of the best serving cell: each measurement consistsin the RSRP measure, the location information and the corre-sponding cell identifier (CID). The received power Zi(x) fromthe i-th BS at location x is given by Zi(x) = 0 is x /∈ Di andif x ∈ Di,Zi(x) = pt,i−10κi ln10(disti(x))+ςiGi(x)+si(x)Tηi (17)
where Di ⊆ R2, pt,i is the transmitted power of the i-thBS, κi is the path loss exponent corresponding to the i-thBS and disti(x) is the distance from x to the i-th BS. Wecan choose Di 6= R2 to model geographic area which are notcovered by the i-th BS. ηi is a Gaussian variable with zeromean and covariance matrix Ki. si(x) : R2 → Rri collectsri deterministic spatial basis functions.ςiGi(x) is the antenna gain which depends on the mobile
location x. In our use-case, the antennas used for each BS aretri-sectored; we use a typical antenna pattern proposed in the3GPP standard [1] with a horizontal gain only since we areusing a 2-dimensional model:
Gi(x) = −min
[12
(ψx,iψ3dB
)2
, Am
], (18)
where ψx,i is the angle between the UE location x, and thei-th BS antenna azimuth. ψ3dB denotes the angle at which theantenna efficiency is 50% and Am is the maximum antennagain. For a tri-sectorial antenna, the parameter ψ3dB is usuallytaken equal to 65◦ and Am = 30dB.
We have Ni observations Yi(x) having the i-th BS asthe best serving cell. They are located at x1,i, · · · , xNi,i
and are noisy measurements of Zi(x): Yi(x) = Zi(x) +σiεi(x) where (εi(x))x is a zero mean standard Gaussianprocess, independent of ηi. Following the same lines as insection II-B, we define the Ni × 1 column vector Yi =(Yi(x1,i), · · · , Yi(xNi,i))
T , and have Yi = T iαi+Siηi+σiεiwhere
T i =
1 −10 ln10(disti(x1,i)) Gi(x1,i)...
......
1 −10 ln10(disti(xNi,i)) Gi(xNi,i)
,
αi =
[pt,iκiςi
], εi =
εi(x1,i)
...εi(xNi,i)
.
The parameters pt,i, κi, σi, ςi and Ki are unknown and are
estimated from Yi by applying the EM technique describedin Section II-C (see also Section IV-B for the implementation).
For any x such that x ∈ Di, set Zi(x) = E [Zi(x)|Yi], theexpression of which can easily be adapted from (8). In themulticellular case, the inter-site shadowing correlation can beexplained by a partial overlap of the large-scale propagationmedium as explained in [33]. Hence, for any x such thatx ∈ Di, we write Zi(x) = Z ′i(x) +W (x), where W (x) is therandom cross-correlated shadowing term which depends onlyon the mobile location (also called overlapping propagationterm) and Z ′i(x) is the random correlated shadowing relatedto the i-th BS at the location x (also called non-overlappingpropagation term). As explained in [33], the r.v. (Z ′i(x))i areindependent, which implies that the probability that a UElocated at x is attached to the i-th BS (which is denoted byCID(x) = i) is given by
P(CID(x) = i) = E
∏
j 6=i:x∈Dj
1Zj(x)≤Zi(x)
. (19)
A simple approximation consists in approximating this expec-tation by ∏
j 6=i:x∈Dj
1Zj(x)≤Zi(x).
This yields the estimation rules for the CID and the RSRPvalue at x
CID(x) = argmaxj:x∈DjZj(x),
Z(x) = ZCID(x)
(x) = maxj:x∈Dj
Zj(x).
IV. APPLICATIONS TO CELLULAR COVERAGE MAP
A. Data sets description
For the single cell use-case, we consider a simulated dataset and a real data set. The first data set consists of simulatedmeasurement points generated with a very accurate planningtool, which uses a sophisticated ray-tracing propagation modeldeveloped for operational network planning [34]. This data isconsidered as the ground-truth of the coverage in the areaof interest. The collected data set corresponds to the LTERSRP values in an urban scenario located in the Southwestof Paris (France). The environment is covered by a macro-cell with an omni-directional antenna. These measurementpoints are located on a 1000 m×1000 m surface, regularlyspaced on a cartesian grid consisting of 5 m ×5 m squares;this yields a total of 40401 measurement points (see Fig. 1a,where the antenna location is (595 416 m, 2 425 341 m)). Inorder to model the noise measurements, a zero mean Gaussiannoise with variance equal to 3 dB is added to the simulatedmeasurements. This yields what we called in Section II theprocess {Y (x), x ∈ D}, where D ⊂ R2.
The second data set corresponds to real measurement pointsreported from Drive Tests (DT) done by Orange France teams,in a rural area located in southwestern France. The BS isabout 30 m height and covers an area of 22 km×10 km.7800 measurement points have been collected in the 800
6
MHz frequency band using a typical user’s mobile deviceconnected to a software tool for data acquisition.The locationsof the measurement points are shown on Fig. 1b - notethat they are along the roads and the antenna is located at(408 238 m, 1 864 600 m). For the multicellular use-case, weconsider a simulated data set provided by the aforementionedOrange planning tool. This planning tool calculates RSRPvalues in a sub-urban environment shown in Fig. 2a, consistingof 12 antennas grouped into 4 sites of 3 directional antennas.The inter-site distance is bigger than 1 km. The antennas aretri-sectored. The RSRP values are computed over a regulargrid of size 25 m×25 m over a 12.4 km2 geographic area,which results in a total of 20 008 locations; and it is realizedover a 2.6 GHz frequency band. The planning tool returns, ateach location of the regular grid, both the RSRP value and theID of the best serving cell. Fig. 2b displays the RSRP valuesand Fig. 2c shows the best serving cell map where each colorcorresponds to a cell coverage area.
B. EM implementation1) Choice of the basis functions s: The basis functions
x 7→ s(x) = (S1(x), . . . , Sr(x)) and their number r bothcontrol the complexity and the accuracy of the FRK predictiontechnique. Following the suggestions in [14], we choose the l-th basis function x 7→ Sl(x) as a symmetric function centeredat locations x′l: Sl is a bi-square function defined as
Sl(x) =
{[1− (‖x− x′l‖ /τ)
2]2, if ‖x− x′l‖ 6 τ ,
0, otherwise .(20)
The parameter τ controls the support of the function. In thenumerical applications below, the centers of the basis functionsx′l and their number r are chosen as follows: rmax functionsare located on a Cartesian grid where the elements are τ × τsquares covering the whole geographic area of interest. Then,for each function Sl, if none of the N locations x1, · · · , xN isin a τ -neighborhood of the center x′l, this function is removed.The number of the remaining basis function is r. On Fig. 3aand Fig. 3b, we show the locations of the N observations (redcircle) and the locations of the r basis function centers (bluecrosses) for two different data sets. In Fig. 3a, τ = 100 mand r = rmax (and N = 2000) while in Fig. 3b, τ = 250 m,rmax = 2660 and r = 467.
2) Structured covariance matrix K: Several examples ofstructured covariance matrix K can be chosen. In the radiocellular context, the shadowing term can be modeled as azero-mean Gaussian random variable with an exponentialcorrelation model [35]. Thus, K is given by
K(β, φ) =K(φ)
β, (21)
with Ki,j(φ) = exp
(−∥∥x′i − x′j
∥∥exp(φ)
), (22)
where∥∥x′i − x′j
∥∥ is the Euclidean distance between the twolocations x′i and x′j (related to the basis functions, see Sec-tion IV-B1). 1/β and exp(φ) are respectively the variance of
ηl, 1 ≤ l ≤ r; and a rate of decay of the correlation (thechoice of the parametrization exp(φ) avoids the introductionof a constraint of sign when estimating φ). We therefore haveυ = (β, φ) ∈ R+
? ×R. For this specific parametric matrix (21-22), a possible update of the parameters (β, φ) which ensuresthe monotonicity property of the EM algorithm is (see e.g. [12,Appendix B]): β(l+1) = r/Tr
(K−1(l) V(l)
)and
φ(l+1) = φ(l) −a(l)
H(l)· · ·
× Tr((β(l+1)K
−1(l) V(l) − Ir
)K−1(l) ∆ ◦ K(l)
)
where K(l) is a shorthand notation for K(φ(l)), ∆ is the r×rmatrix with entries (‖x′i− x′j‖)ij , V(l) is a shorthand notationfor E
[ηηT |Y;θ(l)
], ◦ denotes the Hadamard product and
H(l) = −Tr(K−1l ∆ ◦ K
(β(l+1)KlV(l) − Ir
))
+ exp(−φ(l))Tr(K−1l ∆ ◦∆ ◦ Kl
(β(l+1)KlV(l) − Ir
))
+exp(−φ(l))Tr
((K−1l ∆ ◦ Kl
)2 (Ir − 2β(l+1)KlV(l)
));
a(l) ∈ (0, 1) is chosen so that Q(θ(l+1);θ(l)) ≥Q(θ(l);θ(l)).
3) EM convergence: EM converges whatever the initialvalue θ(0) (see [31]); the limiting points of the EM sequencesare the stationary points of the log-likelihood of the observa-tions Y. We did not observe that the initialization θ(0) playsa role on the limiting value of our EM runs. A natural initialvalue for α is the Ordinary Least Square estimator given by
α(0) =(T TT
)−1T TY. We choose φ(0) large enough so that
the matrix K(φ(0)) looks like the identity matrix; in practice,we choose τ/ exp(φ) in the order of 5. Finally, we compute theempirical variance V of the components of the residual vectorY − Tα(0) and choose β−1(0) + σ2
(0) = V; roughly speaking,we start from a model with uncorrelated shadowing term. Thealgorithm is stopped when
∥∥θ(l) − θ(l−1)∥∥ < 10−5 over 100
successive iterations. We report in Table I the values of theparameters at convergence of EM for the simulated data set.
TABLE I. SIMULATED DATA SET, WHEN τ = 50 M, r = 400 ANDN = 32000
σ2 α 1/β φ18.15 −49.55 2.73 12.5 3.63
C. Prediction Error Analysis for the single cell use-caseEach data set is splitted into a learning set and a test set.
Using the data in the learning set, the parameters are estimatedby the method described in Section II-C. The performancesare then evaluated using the data in the test set. In order tomake this analysis more robust to the choice of the learningand test sets, we perform a k-fold cross validation [36] (here,we choose k = 5) with a uniform data sampling of the
7
595000 595400 595800
2425
000
2425
400
2425
800
(m)
(m)
−140
−130
−120
−110
−100
−90
−80
(a) Simulated data set.
400000 410000
1862
000
1866
000
1870
000
(m)
(m)
−120
−100
−80
−60
(b) Rural data set.
Fig. 1. One cell case: the measurements (Y (x))x.
(a)
765000 766000 7670002413
000
2414
000
2415
000
2416
000
(m)
(m)
−90
−80
−70
−60
−50
−40
−30
(b)
765000 766000 76700024
13
00
02
41
40
00
24
15
00
02
41
60
00
(m)
(m)
(c)
Fig. 2. Multicellular case: (a) BS locations; (b) the simulated RSRP map; (c) measurements grouped in 12 clusters, according to their best serving cell ID
×105
5.95 5.952 5.954 5.956 5.958
×106
2.4249
2.4251
2.4253
2.4255
2.4257
2.4259
(a) Simulated data set
×105
3.95 4 4.05 4.1 4.15 4.2
×106
1.86
1.862
1.864
1.866
1.868
1.87
1.872
(b) Real data set
Fig. 3. Locations of the N observations (red circles) and locations of the rcenters x′l (blue crosses) of the basis functions.
subsets (typical values for k are in the range 3 to 10 [25, seeSection 5.3.]). Therefore, at each step of this cross-validationprocedure, we have a learning set consisting of 80% of theavailable measurement points (making a learning sets withresp. 32000 and 6000 points for resp. the simulated data set
and the real data set).In order to evaluate the prediction accuracy, we compare
the measurements Y (x) to the predicted values Y (x) fromthe model (6). We consider the locations x in the test setT . The model (6) implies that the conditional expectation ofY (x) given Y at such locations x is equal to the conditionalexpectation of Z(x) given Y since ε(x) is independent ofY. Therefore, for any x ∈ T , the error (with sign) isY (x) − Y (x) = Z(x) − Y (x) where Z(x) is given by (8).We evaluate the Root Mean Square Error (RMSE) which isa commonly used prediction error indicator (see e.g. [37]),defined as
RMSE =
[1
|T |∑
x∈T
(Y (x)− Y (x)
)2] 1
2
, (23)
where |T | denotes the number of observations in the test setT . The RMSE is computed for each of the k successive testsets in the cross-validation analysis. In Tables II and III, wereport the mean value of the RMSE over the k partitions andits standard deviation in parenthesis. We compare differentstrategies for modeling the observations (Y (x))x, for the
8
parameter estimation of the model and for the prediction:• Log-Normal: the log-normal shadowing model (see
(2)) when the parameters pt, κ, σ2 are estimated by
MLE. Z(x) is given by pt − 10κ log10(dist(x)); thismethod does not depend on r.
• FRK: the FRK model (see section II-B) when the param-eters are estimated by MLE (see Sections II-C and IV-B)and Z(x) is given by (8), for different values of r.
In tables II and III, we report the mean RMSE over the k splitsof the data set and its standard deviation between parenthesis.These tables show that the FRK model improves on the log-
TABLE II. SIMULATED DATA SET: MEAN RMSE AND STANDARDDEVIATION IN PARENTHESIS.
Log-Normal FRK FRKr = 1089 r = 100
5.08 3.98 4.67(6.08e-02) (5.18e-02) (4.46e-02)
TABLE III. REAL DATA SET: MEAN RMSE AND STANDARDDEVIATION IN PARENTHESIS
Log-Normal FRK FRKr = 1000 r = 150
8.95 3.51 5.57(1.46e-01) (1.24e-01) (6.23e-02)
normal model. For the real data set, it yields a considerablylow RMSE (in the order of 3− 5 dB) when compared to thelog-normal shadowing model which has a RMSE in the orderof 9 dB. For the simulated data set, we have a similar behavior.
The computational complexity of the FRK approach isessentially related to r, the number of basis functions. Onthe one hand, the computational cost increases with r andon the other hand, the prediction accuracy increases withr. We report on Fig. 4 the running time and the predic-tion accuracy measured in terms of mean RMSE over thek splitting of the data set into a learning and a test set,as a function of r; by convention, the running time is setto 1 when r = 64. The plot is obtained with 7 differentanalysis, obtained with τ ∈ {30, 40, 50, 60, 80, 100, 120} - orequivalently, r ∈ {1089, 625, 400, 289, 169, 100, 64}. It showsthat the running time is multiplied by a factor 130 and theprediction accuracy is increased by 20% when moving fromτ = 120 (r = 64) to τ = 30 (r = 1089).
D. Prediction Error Analysis for the multicellular use-caseThe data set is splitted into a learning set with 16 000
points and a test set. Based on their best serving cell ID,these 16 000 points are clustered into 12 subsets. The sizeof these subsets varies between 1000 and 3500. In Fig. 5aa learning subset associated to a given BS is displayed: notethat the observations with a given best serving cell ID are notuniformly distributed over the geographical area of interest.We choose the same initial basis functions for the 12 sub-models (defined by Eq.(20) with τ = 150, which yields
r
0 200 400 600 800 1000 1200
Ru
nn
ing
Tim
e
0
50
100
150
RM
SE
3.5
4
4.5
5
RMSE
Running Time
Fig. 4. Simulated Data set: for different values of r, the running time andthe mean RMSE
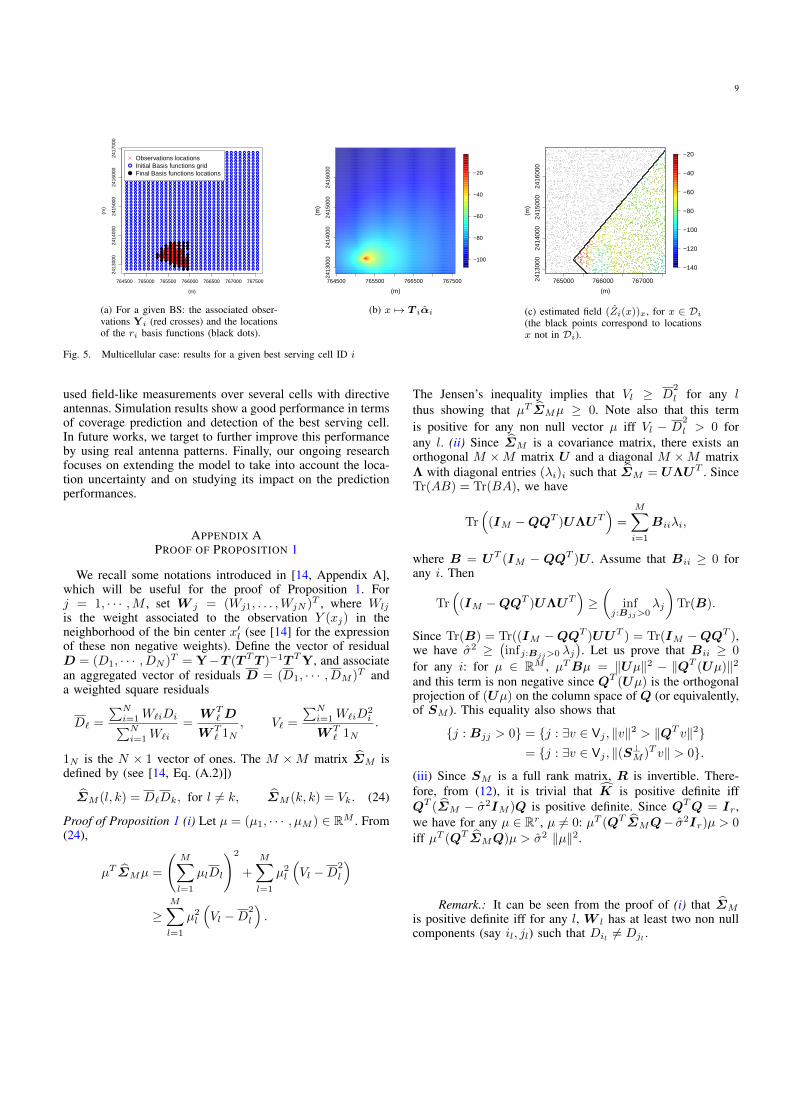
rmax = 588). For each sub-model, some of the basis functionsare canceled as described in Section IV-B1 (see the blue circlesand black dots in Fig. 5a). Fig. 5b shows the path-loss functionx 7→ pt,i−10κi ln10 disti(x)+ ςiGi(x): note that, as expected,T iαi is bigger in the direction of the antenna spread. InFig. 5c, we display {Zi(x), x ∈ Di}. Di is defined as thearea covering the main direction of the i-th antenna radiation.
The best serving cell ID (CIDbs) for any location x ∈ Di isdefined as the ID of the BS having the biggest probability thatthe ME is attached to it at location x as detailed in Eq. 19.Then the predicted received power at location x correspondsto the predicted received power of the best serving cell atthat location. For performance evaluation, we first consideran omni-directional antenna model (similar to the one insection IV-C). We compare the predicted cell ID for eachlocation x (that is the index j such that Z(x) = Zj(x))to the real one. We obtain an error rate of 53 % over thelocations x in the test set. When we consider the domainclustering introduced in (17) (the antennas are still assumedto be omnidirectional), the error rate on cell ID selection is31.23% over the test set locations. Finally, we consider thedirectional model together with the same domain restrictionDi. The error rate is drastically decreased to 12.64%. This errorrate is expected to further decrease when using real antennapatterns (the impact of approximating real antenna patternswith the 3GPP model is studied for example in [38]).
V. CONCLUSION
In this work we have studied the performance of theFRK algorithm applied to coverage analysis in cellular net-works. This method has a good potential when performingprediction using massive data sets (order of thousands andhigher) as it offers a good trade-off between prediction qualityand computational complexity compared to classical Krigingtechniques. This study has been performed using field-likemeasurements obtained from an accurate planning tool andreal field measurements obtained from drive tests. In additionwe have adapted the model to a more practical application: we
(a) For a given BS: the associated obser-vations Yi (red crosses) and the locationsof the ri basis functions (black dots).
764500 765500 766500 767500
2413
000
2414
000
2415
000
2416
000
(m)
(m)
−100
−80
−60
−40
−20
(b) x 7→ T iαi
765000 766000 7670002413
000
2414
000
2415
000
2416
000
(m)
(m)
−140
−120
−100
−80
−60
−40
−20
(c) estimated field (Zi(x))x, for x ∈ Di
(the black points correspond to locationsx not in Di).
Fig. 5. Multicellular case: results for a given best serving cell ID i
used field-like measurements over several cells with directiveantennas. Simulation results show a good performance in termsof coverage prediction and detection of the best serving cell.In future works, we target to further improve this performanceby using real antenna patterns. Finally, our ongoing researchfocuses on extending the model to take into account the loca-tion uncertainty and on studying its impact on the predictionperformances.
APPENDIX APROOF OF PROPOSITION 1
We recall some notations introduced in [14, Appendix A],which will be useful for the proof of Proposition 1. Forj = 1, · · · ,M , set W j = (Wj1, . . . ,WjN )T , where Wlj
is the weight associated to the observation Y (xj) in theneighborhood of the bin center x′l (see [14] for the expressionof these non negative weights). Define the vector of residualD = (D1, · · · , DN )T = Y−T (T TT )−1T TY, and associatean aggregated vector of residuals D = (D1, · · · , DM )T anda weighted square residuals
D` =
∑Ni=1W`iDi∑Ni=1W`i
=W T
` D
W T` 1N
, V` =
∑Ni=1W`iD
2i
W T` 1N
.
1N is the N × 1 vector of ones. The M ×M matrix ΣM isdefined by (see [14, Eq. (A.2)])
ΣM (l, k) = D`Dk, for l 6= k, ΣM (k, k) = Vk. (24)
Proof of Proposition 1 (i) Let µ = (µ1, · · · , µM ) ∈ RM . From(24),
µT ΣMµ =
(M∑
l=1
µlDl
)2
+
M∑
l=1
µ2l
(Vl −D
2
l
)
≥M∑
l=1
µ2l
(Vl −D
2
l
).
The Jensen’s inequality implies that Vl ≥ D2
l for any lthus showing that µT ΣMµ ≥ 0. Note also that this termis positive for any non null vector µ iff Vl − D
2
l > 0 forany l. (ii) Since ΣM is a covariance matrix, there exists anorthogonal M ×M matrix U and a diagonal M ×M matrixΛ with diagonal entries (λi)i such that ΣM = UΛUT . SinceTr(AB) = Tr(BA), we have
Tr(
(IM −QQT )UΛUT)
=M∑
i=1
Biiλi,
where B = UT (IM − QQT )U . Assume that Bii ≥ 0 forany i. Then
Tr(
(IM −QQT )UΛUT)≥(
infj:Bjj>0
λj
)Tr(B).
Since Tr(B) = Tr((IM −QQT )UUT ) = Tr(IM −QQT ),we have σ2 ≥
(infj:Bjj>0 λj
). Let us prove that Bii ≥ 0
for any i: for µ ∈ RM , µTBµ = ‖Uµ‖2 − ‖QT (Uµ)‖2and this term is non negative since QT (Uµ) is the orthogonalprojection of (Uµ) on the column space of Q (or equivalently,of SM ). This equality also shows that
(iii) Since SM is a full rank matrix, R is invertible. There-fore, from (12), it is trivial that K is positive definite iffQT (ΣM − σ2IM )Q is positive definite. Since QTQ = Ir,we have for any µ ∈ Rr, µ 6= 0: µT (QT ΣMQ− σ2Ir)µ > 0iff µT (QT ΣMQ)µ > σ2 ‖µ‖2.
Remark.: It can be seen from the proof of (i) that ΣM
is positive definite iff for any l, W l has at least two non nullcomponents (say il, jl) such that Dil 6= Djl .
10
ACKNOWLEDGMENT
The authors would like to acknowledge Emmanuel DeWailly and Jean-Francois Morlier for their help in data ac-quisition.
REFERENCES
[1] 3GPP TSG-RAN WG4 meeting # 62 R4-120908, Proposal to modelingactive antennas, Katherein, Feb 2012.
[2] 3GPP TR 36.805 v1.3.0 1, “Study on minimization of drive-tests in next generation networks; (release 9),” 3rd GenerationPartnership Project, Tech. Rep., 2009. [Online]. Available: http://www.3gpp.org/ftp/Specs/html-info/23141.htm
[3] J. Mitola, “Cognitive radio: An integrated agent architecture for soft-ware defined radio,” (Doctoral dissertation), Royal Institute of Technol-ogy (KTH), Stockholm, Sweden, 2000.
[4] Y. Zhao, J. Gaeddert, K. K. Bae, and J. H. Reed, “Radio environmentmap enabled situation-aware cognitive radio learning algorithms,” Soft-ware Defined Radio Forum (SDRF) technical conference, 2006.
[5] A. Alaya-Feki, S. Ben Jemaa, B. Sayrac, P. Houze, and E. Moulines,“Informed spectrum usage in cognitive radio networks: Interferencecartography,” IEEE Conference on Personal, Indoor and Mobile RadioCommunications (PIMRC), pp. 1–5, 2008.
[6] A. Alaya-Feki, B. Sayrac, S. Ben Jemaa, and E. Moulines, “Inter-ference cartography for hierarchical dynamic spectrum access,” IEEEConference on New Frontiers in Dynamic Spectrum Access Networks(DySPAN), pp. 1–5, 2008.
[7] J. Riihijarvi, P. Mahonen, M. Wellens, and M. Gordziel, “Characteri-zation and modelling of spectrum for dynamic spectrum access withspatial statistics and random fields,” IEEE Conference on Personal,Indoor and Mobile Radio Communications (PIMRC), pp. 1–6, 2008.
[8] 3GPP TR 102 947 V1.1.1, “Reconfigurable Radio Systems(RRS); Use Cases for building and exploitation of RadioEnvironment Maps (REMs) for intra-operator scenarios ,” EuropeanTelecommunications Standards Institute, Tech. Rep., 2013. [Online].Available: http://www.etsi.org/deliver/etsi tr/102900 102999/102947/01.01.01 60/tr 102947v010101p.pdf
[9] B. Sayrac, J. Riihijarvi, P. Mahonen, S. Ben Jemaa, E. Moulines,and S. Grimoud, “Improving coverage estimation for cellular networkswith spatial bayesian prediction based on measurements,” Proceedingsof the ACM SIGCOMM workshop on Cellular networks: operations,challenges, and future design, pp. 43–48, 2012.
[10] A. Galindo-Serrano, B. Sayrac, S. Ben Jemaa, J. Riihijarvi, andP. Mahonen, “Automated coverage hole detection for cellular networksusing radio environment maps,” IEEE Conference on Modeling andOptimization in Mobile, Ad Hoc & Wireless Networks, pp. 35–40, 2013.
[11] B. Sayrac, A. Galindo-Serrano, S. B. Jemaa, J. Riihijarvi, andP. Mahonen, “Bayesian spatial interpolation as an emerging cognitiveradio application for coverage analysis in cellular networks,” Transac-tions on Emerging Telecommunications Technologies, 2013.
[12] H. Braham, S. Ben Jemaa, B. Sayrac, G. Fort, and E. Moulines, “Lowcomplexity spatial interpolation for cellular coverage analysis,” IEEEConference on Modeling and Optimization in Mobile, Ad Hoc, andWireless Networks (WiOpt), 2014.
[13] ——, “Coverage mapping using spatial interpolation with field mea-surements,” IEEE Conference on Personal, Indoor and Mobile RadioCommunications (PIMRC), 2014.
[14] N. Cressie and G. Johannesson, “Fixed rank kriging for very largespatial data sets,” Journal of the Royal Statistical Society: Series B(Statistical Methodology), vol. 70, no. 1, pp. 209–226, 2008.
[15] T. S. Rappaport et al., Wireless communications: principles and prac-tice. prentice hall PTR New Jersey, 1996, vol. 2.
[16] C. Phillips, D. Sicker, and D. Grunwald, “Bounding the error of pathloss models,” IEEE Conference on New Frontiers in Dynamic SpectrumAccess Networks (DySPAN), pp. 71–82, 2011.
[17] E. Perahia, D. C. Cox, and S. Ho, “Shadow fading cross correlationbetween base stations,” IEEE Conference on Vehicular TechnologyConference (VTC), vol. 1, pp. 313–317, 2001.
[18] N. A. Cressie, “Statistics for spatial data,” 1993.[19] J. Riihijarvi and P. Mahonen, “Estimating wireless network properties
with spatial statistics and models,” IEEE Conference on Modeling andOptimization in Mobile, Ad Hoc and Wireless Networks (WiOpt), pp.331–336, 2012.
[20] C. Phillips, M. Ton, D. Sicker, and D. Grunwald, “Practical radioenvironment mapping with geostatistics,” IEEE Conference on DynamicSpectrum Access Networks (DySPAN), pp. 422–433, 2012.
[21] E. Anderson, C. Phillips, D. Sicker, and D. Grunwald, “Modeling envi-ronmental effects on directionality in wireless networks,” Mathematicaland Computer Modelling, vol. 53, no. 11, pp. 2078–2092, 2011.
[22] R. Ramanathan, “On the performance of ad hoc networks with beam-forming antennas,” Proceedings of the ACM international symposiumon Mobile ad hoc networking & computing, pp. 95–105, 2001.
[23] Y. Chen, Z. Zhang, and V. K. Dubey, “Effect of antenna directivity onangular power distribution at mobile terminal in urban macrocells: Ageometric channel modeling approach,” Wireless Personal Communica-tions, vol. 43, no. 2, pp. 389–409, 2007.
[24] E. Anderson, G. Yee, C. Phillips, D. Sicker, and D. Grunwald, “Theimpact of directional antenna models on simulation accuracy,” IEEEConference on Modeling and Optimization in Mobile, Ad Hoc, andWireless Networks, WiOPT, pp. 1–7, 2009.
[25] C. Rasmussen and C. Williams, Gaussien Processes for MachineLearning. MIT Press, 2006.
[26] H. V. Henderson and S. R. Searle, “On deriving the inverse of a sumof matrices,” Siam Review, vol. 23, no. 1, pp. 53–60, 1981.
[27] M. Katzfuss and N. Cressie, “Tutorial on Fixed Rank Kriging (FRK)of CO2 data,” Department of Statistics Technical Report No. 858, TheOhio State University, Columbus, OH, Tech. Rep., 2011.
[28] ——, “Maximum likelihood Estimation of Covariance Parameters in theSpatial-Random-Effects Model,” in Proceedings of the Joint StatisticalMeetings, American Statistical Association, 2009.
[29] A. Sengupta and N. Cressie, “Hierarchical statistical modeling of bigspatial datasets using the exponential family of distributions,” SpatialStatistics, vol. 4, pp. 14–44, 2013.
[30] J. M. Geoffrey and K. Thriyambakam, The EM algorithm and exten-sions. Wiley-Interscience, 2007, vol. 382.
[31] C. Wu, “On the convergence properties of the EM algorithm,” TheAnnals of statistics, vol. 11, no. 1, pp. 95–103, 1983.
[32] 3GPP TS 136.304 V8.6.0, “Evolved universal terrestrial radio access(E-UTRA); user equipment (UE) procedures in idle mode,” 3rdGeneration Partnership Project, Tech. Rep., 2009. [Online]. Available:http://www.3gpp.org/ftp/Specs/html-info/23141.htm
[33] S. S. Szyszkowicz, H. Yanikomeroglu, and J. S. Thompson, “On thefeasibility of wireless shadowing correlation models,” IEEE TRANSAC-TIONS ON VEHICULAR TECHNOLOGY, vol. 59, no. 9, 2010.
[35] M. Gudmundson, “Correlation model for shadow fading in mobile radiosystems,” Electronics letters, vol. 27, no. 23, pp. 2145–2146, 1991.
[36] R. Kohavi et al., “A study of cross-validation and bootstrap for accuracyestimation and model selection,” IJCAI, vol. 14, no. 2, pp. 1137–1145,1995.
[37] J. Li and G. Australia, A review of spatial interpolation methods forenvironmental scientists. Geoscience Australia Canberra, 2008, vol.137.
[38] F. Gunnarsson, M. N. Johansson, A. Furuskr, M. Lundevall, A. Simon-sson, C. Tidestav, and M. Blomgren, “Downtilted base station antennasa simulation model proposal and impact on hspa and lte performance,”IEEE Conference on Vehicular Technology (VTC Fall), 2008.