FURTHER EVALUATION OF LIMITING STRAIN CRITERIA FOR PERPETUAL 1 ASPHALT PAVEMENT DESIGN 2 3 4 5 6 Alfredo J. Castro 7 Graduate Research Assistant 8 National Center for Asphalt Technology 9 277 Technology Parkway, Auburn, AL, 36830 10 Tel: 334-332-2657; Email: [email protected]11 12 Nam Tran, PhD, PE 13 Associate Research Professor 14 National Center for Asphalt Technology 15 277 Technology Parkway, Auburn, AL, 36830 16 Tel: 334-844-7322; Email: [email protected]17 18 Mary Robbins, PhD 19 National Center for Asphalt Technology 20 277 Technology Parkway, Auburn, AL, 36830 21 Email: [email protected]22 23 David H. Timm, PhD, PE 24 Brasfield & Gorrie Professor 25 Department of Civil Engineering, Auburn University 26 238 Harbert Engineering Center, Auburn, AL, 36849 27 Tel: 334-844-6282; Email: [email protected]28 29 Chris Wagner, PE 30 Team Leader, Senior Pavement and Materials Engineer 31 Federal Highway Administration 32 61 Forsyth Street, SW Suite 17T26, Atlanta, GA, 30303 33 Tel: 404-562-3693; Email: [email protected]34 35 36 Word count: 3624 text + 247 abstract + 10 tables/figures x 250 (each) = 6371 words 37 38 39 40 41 42 43 Submission Date: August 1, 2016 44 Revised Date: November 14, 2016 45
Transcript
FURTHER EVALUATION OF LIMITING STRAIN CRITERIA FOR PERPETUAL 1 ASPHALT PAVEMENT DESIGN 2 3 4 5 6 Alfredo J. Castro 7 Graduate Research Assistant 8 National Center for Asphalt Technology 9 277 Technology Parkway, Auburn, AL, 36830 10 Tel: 334-332-2657; Email: [email protected] 11 12 Nam Tran, PhD, PE 13 Associate Research Professor 14 National Center for Asphalt Technology 15 277 Technology Parkway, Auburn, AL, 36830 16 Tel: 334-844-7322; Email: [email protected] 17 18 Mary Robbins, PhD 19 National Center for Asphalt Technology 20 277 Technology Parkway, Auburn, AL, 36830 21 Email: [email protected] 22 23 David H. Timm, PhD, PE 24 Brasfield & Gorrie Professor 25 Department of Civil Engineering, Auburn University 26 238 Harbert Engineering Center, Auburn, AL, 36849 27 Tel: 334-844-6282; Email: [email protected] 28 29 Chris Wagner, PE 30 Team Leader, Senior Pavement and Materials Engineer 31 Federal Highway Administration 32 61 Forsyth Street, SW Suite 17T26, Atlanta, GA, 30303 33 Tel: 404-562-3693; Email: [email protected] 34 35 36 Word count: 3624 text + 247 abstract + 10 tables/figures x 250 (each) = 6371 words 37 38 39 40 41 42 43 Submission Date: August 1, 2016 44 Revised Date: November 14, 201645
Castro, Tran, Robbins, Timm and Wagner 2 ABSTRACT 1 Perpetual asphalt pavements have been designed using single threshold values for the horizontal 2 strains at the bottom of the asphalt concrete layer and for vertical strains on top of the subgrade 3 to prevent the occurrence of bottom-up fatigue cracking and subgrade rutting. Several thresholds 4 have been utilized for design based on laboratory and field test results. Recently, limiting strain 5 distributions were proposed for perpetual pavement design instead of single threshold values for 6 controlling the horizontal and vertical strains. These design criteria were developed using data 7 collected from test sections at the NCAT Pavement Test Track. The objective of this study was to 8 conduct additional analyses of eight perpetual pavement sections located in different climatic 9 regions to support the proposed limiting strain criteria. These sections were simulated in the 10 PerRoad perpetual pavement design software to determine the horizontal strains at the bottom of 11 the AC layer and the vertical strains on top of the subgrade. The strains were then analyzed to 12 further evaluate the proposed limiting strain criteria. Based on the simulations, the limiting 13 horizontal strain distribution above 60th percentile can effectively differentiate the calculated 14 strain distributions of the eight perpetual pavement sections from those of the test sections that 15 failed due to bottom-up fatigue cracking on the Test Track. In addition, the calculated vertical 16 strains on top of the subgrade at the 50th percentile were lower than the proposed 200-microstrain 17 limit. These results provide additional support for utilizing the proposed strain criteria in 18 perpetual asphalt pavement design. 19 20 21 22 23 Keywords: perpetual asphalt pavement, pavement design, bottom-up fatigue cracking, subgrade 24
rutting 25 26
Castro, Tran, Robbins, Timm and Wagner 3 INTRODUCTION 1 For several decades, transportation agencies around the country have conducted their design and 2 analysis of asphalt pavements based on the American Association of State Highway and 3 Transportation Officials (AASHTO) Guide for Design of Pavement Structures. This design 4 method was primarily developed using data collected from the AASHO Road Test from 1958 5 through 1962 (1). Various limitations to the method have been pointed out, mainly brought by 6 the specific testing conditions that the Road Test experienced (2). 7
The concept of Perpetual Pavements was introduced by the Asphalt Pavement Alliance 8 (APA) to address the various shortcomings that exist in the AASHTO method. Perpetual 9 pavements are designed to keep the stresses, strains, and displacements in the pavement structure 10 below certain thresholds at which structural distresses begin to occur. A perpetual pavement can 11 be designed to sustain heavy loads for more than 50 years, and even in perpetuity without 12 increasing the pavement structure (2). 13
Perpetual pavement designs usually focus on structural distresses, including bottom-up 14 fatigue cracking and subgrade rutting. A perpetual pavement is designed to avoid the occurrence 15 of these distresses by limiting the horizontal strains at the bottom of the asphalt concrete (AC) 16 layer and the vertical strains on top of the subgrade to established thresholds. By keeping these 17 strains below the determined thresholds, it is ensured that the stresses induced will not affect the 18 pavement performance, even as the number of load repetitions increase in perpetuity. 19
Previous studies have analyzed and proposed limiting strain thresholds for bottom-up 20 fatigue cracking and subgrade rutting distresses. In perpetual pavement design, the limiting strain 21 value at which bottom-up fatigue cracking initiates and propagates is commonly referred to as 22 fatigue endurance limit (FEL). According to Thompson and Carpenter (3), the FEL represents 23 the balance point between damage and healing. Bonaquist (4) stated that the FEL is “a level of 24 strain below which there is no cumulative damage over an indefinite number of load cycles.” To 25 prevent the occurrence of bottom-up fatigue cracking, perpetual pavements have been designed 26 to keep strains at the bottom of the AC layer below a certain FEL. 27
FELs have been determined by laboratory testing and field evaluation. Field evaluation 28 has been done on existing long-life asphalt pavements to determine the strain levels that 29 undamaged pavements endure, and those strains have been proposed as FELs (5). 30
Monismith and McLean (6) reported that 70 microstrain could be considered as a FEL. 31 Thompson and Carpenter (3) determined that there was no data to support FELs below 70 32 microstrain, and recommended FELs between 70 and 100 microstrain. Thompson and Carpenter 33 (7) later deemed 70 microstrain FELs “very conservative”, as laboratory studies had 34 demonstrated that most HMA mixes have FELs well over that limit. Prowell et al. (8) reported 35 the existence of FELs up to 200 microstrain based on laboratory testing. Carpenter and Shen (9) 36 conducted research on 120 different mixes, obtaining FEL values of up to 300 microstrain. A 37 FEL of 200 microstrain was found in active pavements in Japan by Nishizawa et al. (10). Wu et 38 al. (11) analyzed long life pavements in Kansas and determined FELs that ranged between 96 39 and 158 microstrain. In China, 125 microstrain has been used as FEL to design perpetual 40 pavements with positive results (12). 41
The common theme to all of the studies discussed above was identifying a single strain 42 value at an effective AC temperature on which to base a pavement design. While relatively 43 straightforward, using a single strain value may oversimplify the complexity of pavement 44 responses to actual loadings under constantly changing environmental conditions. In reality, 45 asphalt pavements exhibit a wide spectrum of response and it was documented in a series of 46 NCAT Pavement Test Track studies (13, 14, 15) that perpetual pavements could be designed on 47
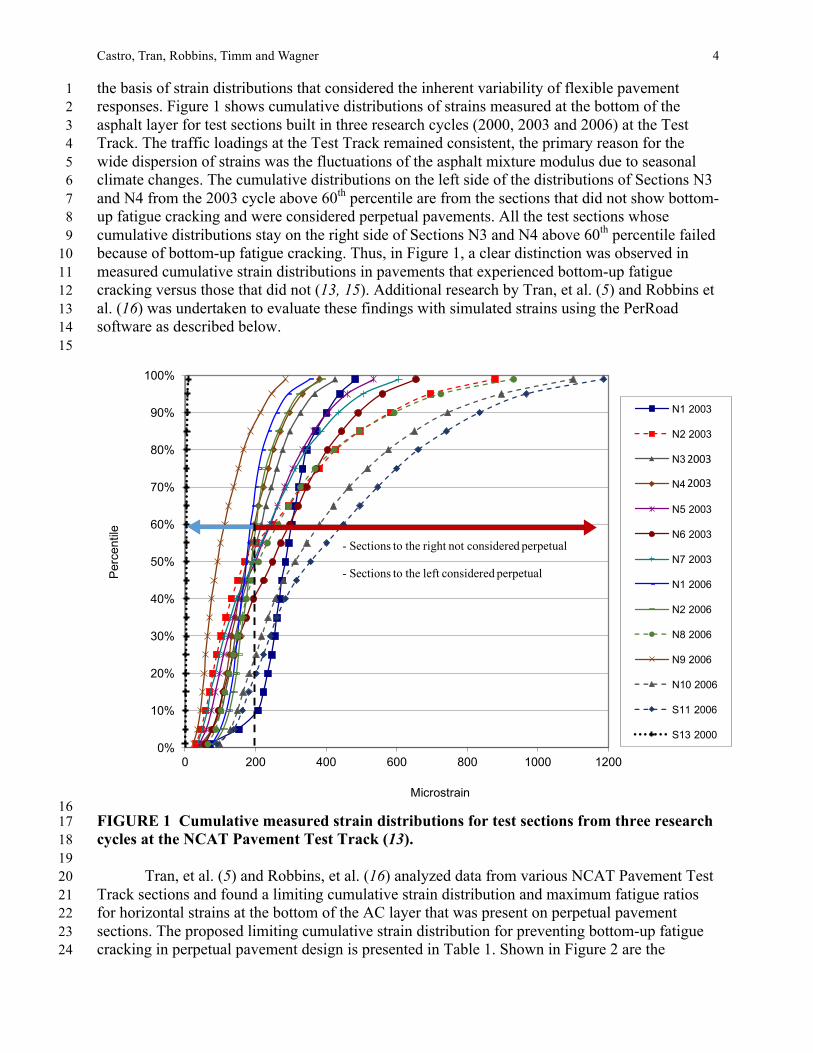
Castro, Tran, Robbins, Timm and Wagner 4 the basis of strain distributions that considered the inherent variability of flexible pavement 1 responses. Figure 1 shows cumulative distributions of strains measured at the bottom of the 2 asphalt layer for test sections built in three research cycles (2000, 2003 and 2006) at the Test 3 Track. The traffic loadings at the Test Track remained consistent, the primary reason for the 4 wide dispersion of strains was the fluctuations of the asphalt mixture modulus due to seasonal 5 climate changes. The cumulative distributions on the left side of the distributions of Sections N3 6 and N4 from the 2003 cycle above 60th percentile are from the sections that did not show bottom-7 up fatigue cracking and were considered perpetual pavements. All the test sections whose 8 cumulative distributions stay on the right side of Sections N3 and N4 above 60th percentile failed 9 because of bottom-up fatigue cracking. Thus, in Figure 1, a clear distinction was observed in 10 measured cumulative strain distributions in pavements that experienced bottom-up fatigue 11 cracking versus those that did not (13, 15). Additional research by Tran, et al. (5) and Robbins et 12 al. (16) was undertaken to evaluate these findings with simulated strains using the PerRoad 13 software as described below. 14
15
16 FIGURE 1 Cumulative measured strain distributions for test sections from three research 17 cycles at the NCAT Pavement Test Track (13). 18
19 Tran, et al. (5) and Robbins, et al. (16) analyzed data from various NCAT Pavement Test 20
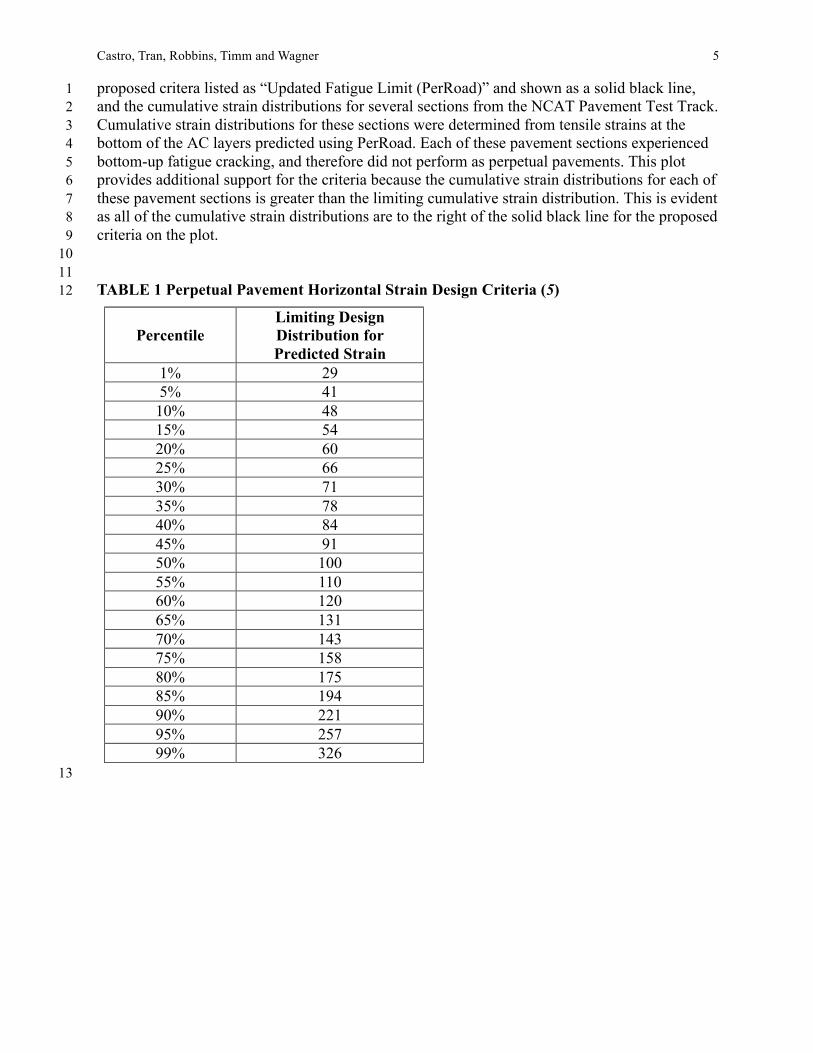
Track sections and found a limiting cumulative strain distribution and maximum fatigue ratios 21 for horizontal strains at the bottom of the AC layer that was present on perpetual pavement 22 sections. The proposed limiting cumulative strain distribution for preventing bottom-up fatigue 23 cracking in perpetual pavement design is presented in Table 1. Shown in Figure 2 are the 24
0%
10%
20%
30%
40%
50%
60%
70%
80%
90%
100%
0 200 400 600 800 1000 1200
Perc
entil
e
Microstrain
N1 2003
N2 2003
N3
N4
N5 2003
N6 2003
N7 2003
N1 2006
N2 2006
N8 2006
N9 2006
N10 2006
S11 2006
S13 2000
- Sections to the right not considered perpetual
- Sections to the left considered perpetual
2003
2003
Castro, Tran, Robbins, Timm and Wagner 5 proposed critera listed as “Updated Fatigue Limit (PerRoad)” and shown as a solid black line, 1 and the cumulative strain distributions for several sections from the NCAT Pavement Test Track. 2 Cumulative strain distributions for these sections were determined from tensile strains at the 3 bottom of the AC layers predicted using PerRoad. Each of these pavement sections experienced 4 bottom-up fatigue cracking, and therefore did not perform as perpetual pavements. This plot 5 provides additional support for the criteria because the cumulative strain distributions for each of 6 these pavement sections is greater than the limiting cumulative strain distribution. This is evident 7 as all of the cumulative strain distributions are to the right of the solid black line for the proposed 8 criteria on the plot. 9 10 11 TABLE 1 Perpetual Pavement Horizontal Strain Design Criteria (5) 12
Percentile Limiting Design Distribution for Predicted Strain
1 FIGURE 2 Cumulative distributions of six cracked sections failed to pass the limiting 2 strain distribution (5). 3
4 To prevent the occurrence and further accumulation of structural rutting in perpetual 5
pavements, Monismith et al. (17) proposed limiting the vertical strains at the top of the subgrade 6 layer to 200 microstrain. This coincides with studies and recommendations by Walubita et al. 7 (18). Based on these studies and data obtained from various sections at the NCAT Pavement Test 8 Track, Tran, et al. (5) proposed for perpetual pavement design that the 50th percentile of the 9 vertical strain distribution at the top of the subgrade must be below 200 microstrain. 10
The limiting cumulative strain distribution was developed and calibrated using data 11 collected from the NCAT Pavement Test Track, which was conducted under a closely monitored 12 environment (5). All the analyzed sections were under similar loading and climatic conditions. 13 Further evaluation of the proposed criteria should be done using existing pavements that have 14 experienced different load conditions and different climatic conditions than those present at the 15 NCAT Pavement Test Track. As the NCAT Pavement Test Track is in Alabama, which is in the 16 wet-nonfreeze climate zone in the Long-Term Pavement Performance (LTPP) program, existing 17 pavement sections that won APA’s Perpetual Pavement Award and are in other LTPP climate 18 zones can be considered suitable candidates to prove the reliability of the proposed criteria. 19 20 OBJECTIVE AND SCOPE 21 The objective of this study was to further evaluate the bottom-up fatigue cracking and subgrade 22 rutting design criteria for perpetual pavement design proposed by Tran, et al. (5). This was 23 conducted by analyzing pavements that won APA’s Perpetual Pavement Awards in various 24 LTPP climate zones using the perpetual pavement design software PerRoad. Selected perpetual 25 pavement sections were simulated to obtain the predicted horizontal strains at the bottom of the 26
0%
10%
20%
30%
40%
50%
60%
70%
80%
90%
100%
0 200 400 600 800 1000 1200
Percen
tile
PredictedTensileStrain(microstrain)
N10-09(Cracked)
N11-09(Cracked)
S8-09(Cracked)
S9-09(Cracked)
S10-09(Cracked)
S11-09(Cracked)
UpdatedFatigueLimit(PerRoad)
Castro, Tran, Robbins, Timm and Wagner 7 AC layer and vertical strains on top of the subgrade layer. These results were then analyzed to 1 further evaluate the proposed design criteria. 2 3 PERPETUAL PAVEMENTS SELECTED FOR ANALYSIS 4 The pavement sections selected for this analysis were all winners of APA’s Perpetual Pavement 5 Award. This annual award is given to pavement sections that have shown remarkable 6 performance over a period of at least 35 years, without requiring any major rehabilitation that 7 would result in structural improvements for the pavement (defined as an increase in overall 8 pavement thickness greater than 4 inches). To date, the APA has awarded over 100 pavements 9 from around the country with this distinction. 10 Eight pavement sections were selected for the analysis from the list of winners. These 11 pavements were selected based on two factors. First, the pavements selected are from areas that 12 experience diverse climatic conditions, which would assist in proving the validity of the 13 proposed criteria for pavements located not only in places with climatic conditions similar to the 14 ones experienced at the NCAT Pavement Test Track, where the criteria were developed. The 15 second factor was the traffic conditions experienced by the pavements. The selected sections 16 have been subjected to loading conditions different from the controlled traffic that the NCAT 17 Pavement Test Track sections experience. These pavements consist of interstate highways and 18 are among the sections that have withstood the most severe levels of traffic of all the Perpetual 19 Pavement Award winners. 20
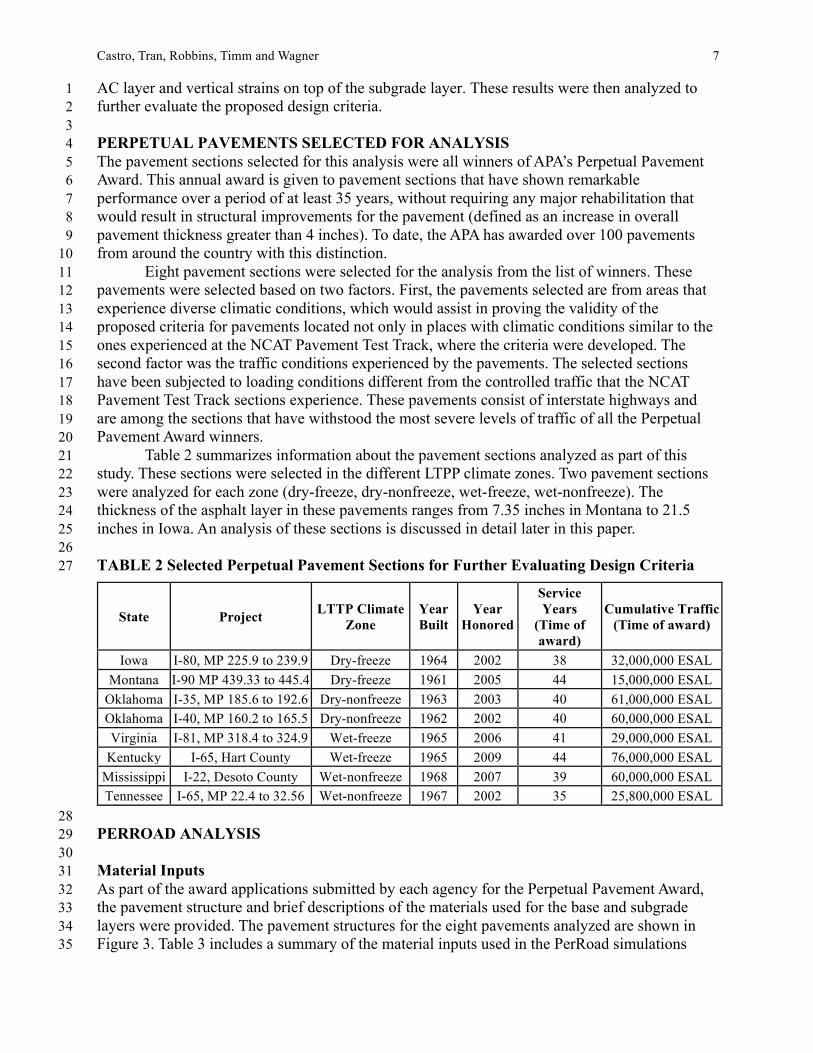
Table 2 summarizes information about the pavement sections analyzed as part of this 21 study. These sections were selected in the different LTPP climate zones. Two pavement sections 22 were analyzed for each zone (dry-freeze, dry-nonfreeze, wet-freeze, wet-nonfreeze). The 23 thickness of the asphalt layer in these pavements ranges from 7.35 inches in Montana to 21.5 24 inches in Iowa. An analysis of these sections is discussed in detail later in this paper. 25 26 TABLE 2 Selected Perpetual Pavement Sections for Further Evaluating Design Criteria 27
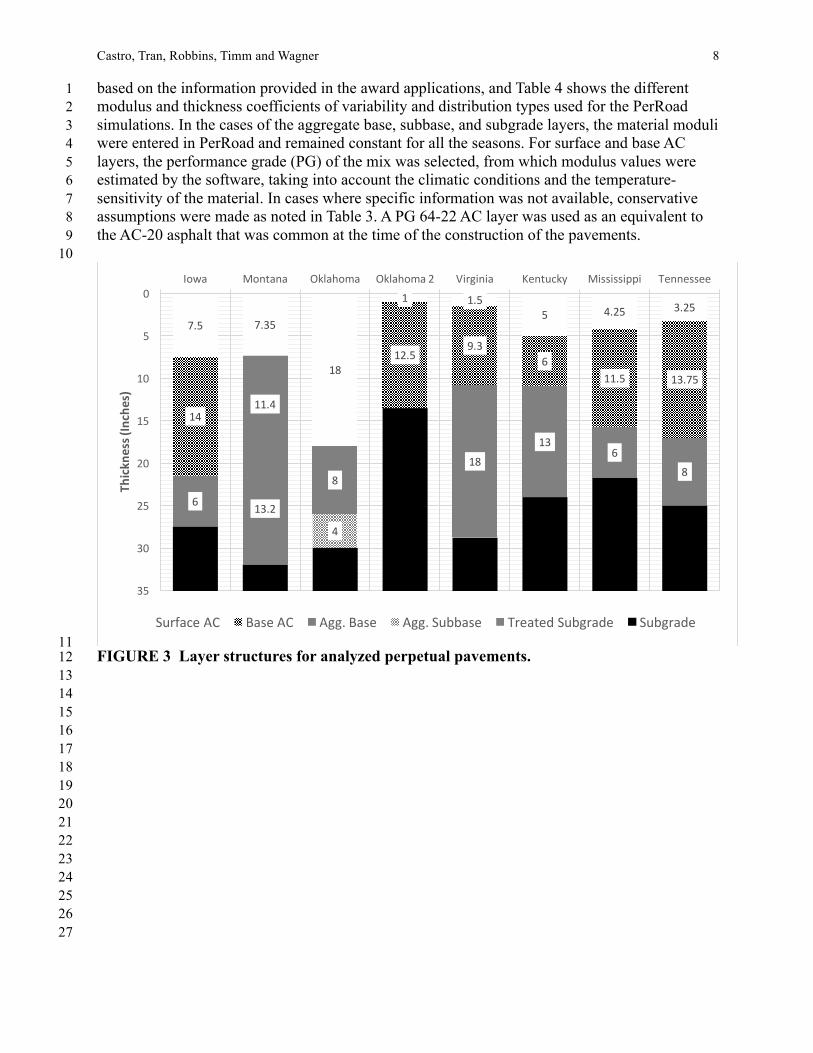
28 PERROAD ANALYSIS 29 30 Material Inputs 31 As part of the award applications submitted by each agency for the Perpetual Pavement Award, 32 the pavement structure and brief descriptions of the materials used for the base and subgrade 33 layers were provided. The pavement structures for the eight pavements analyzed are shown in 34 Figure 3. Table 3 includes a summary of the material inputs used in the PerRoad simulations 35
Castro, Tran, Robbins, Timm and Wagner 8 based on the information provided in the award applications, and Table 4 shows the different 1 modulus and thickness coefficients of variability and distribution types used for the PerRoad 2 simulations. In the cases of the aggregate base, subbase, and subgrade layers, the material moduli 3 were entered in PerRoad and remained constant for all the seasons. For surface and base AC 4 layers, the performance grade (PG) of the mix was selected, from which modulus values were 5 estimated by the software, taking into account the climatic conditions and the temperature-6 sensitivity of the material. In cases where specific information was not available, conservative 7 assumptions were made as noted in Table 3. A PG 64-22 AC layer was used as an equivalent to 8 the AC-20 asphalt that was common at the time of the construction of the pavements. 9 10
Surface AC AC-20 (PG 64-22) Base AC AC-20 (PG 64-22)
Aggregate Base 15,000 psi* Crushed stone aggregate Subgrade 5,000 psi* High plasticity soil
* These inputs are typical design values used for crushed aggregate (adjusted for adjacent unbound 2 layers) and some soil classifications. These inputs were utilized, as they were not provided in the PPA 3 applications. 4
Castro, Tran, Robbins, Timm and Wagner 10 1
TABLE 4 Material Input Variabilities 2
Modulus Variability Thickness Variability
Project Layer Distribution Type COV Distribution
Type COV
Iowa
Surface AC Log Normal 30% Normal 5% Base AC Log Normal 30% Normal 8%
Aggregate base Log Normal 40% Normal 15% Subgrade Log Normal 50%
Montana Surface AC Log Normal 30% Normal 5%
Aggregate base Log Normal 40% Normal 8% Subgrade Log Normal 50%
Oklahoma
Surface AC Log Normal 30% Normal 5% Aggregate base Log Normal 40% Normal 8% Select borrow Log Normal 50% Normal 15%
Subgrade Log Normal 50%
Oklahoma 2 Surface AC Log Normal 30% Normal 5%
Base AC Log Normal 30% Normal 8% Subgrade Log Normal 50%
Virginia
Surface AC Log Normal 30% Normal 5% Base AC Log Normal 30% Normal 8%
Aggregate base Log Normal 40% Normal 15% Subgrade Log Normal 50%
Kentucky
Surface AC Log Normal 30% Normal 5% Base AC Log Normal 30% Normal 8%
Aggregate base Log Normal 40% Normal 15% Subgrade Log Normal 50%
Mississippi
Surface AC Log Normal 30% Normal 5% Base AC Log Normal 30% Normal 8%
Treated Subgrade Log Normal 50% Normal 15% Subgrade Log Normal 50%
Tennessee
Surface AC Log Normal 30% Normal 5% Base AC Log Normal 30% Normal 8%
Aggregate Base Log Normal 40% Normal 15% Subgrade Log Normal 50%
Castro, Tran, Robbins, Timm and Wagner 11 1
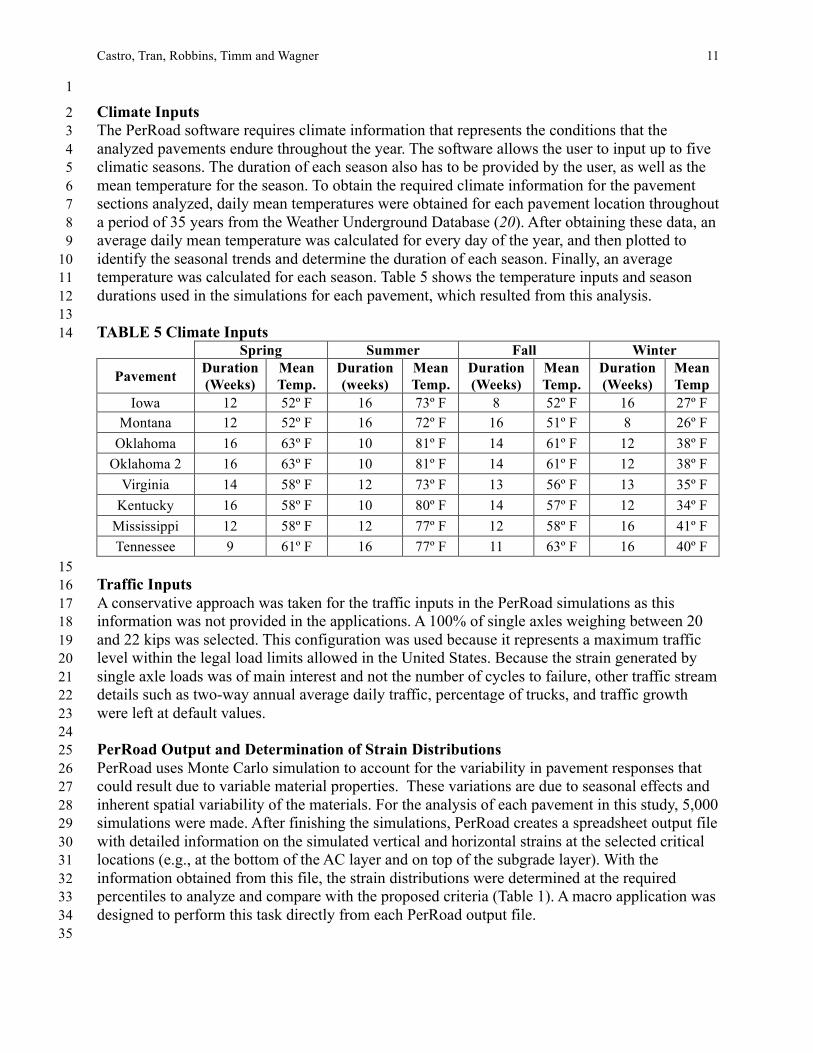
Climate Inputs 2 The PerRoad software requires climate information that represents the conditions that the 3 analyzed pavements endure throughout the year. The software allows the user to input up to five 4 climatic seasons. The duration of each season also has to be provided by the user, as well as the 5 mean temperature for the season. To obtain the required climate information for the pavement 6 sections analyzed, daily mean temperatures were obtained for each pavement location throughout 7 a period of 35 years from the Weather Underground Database (20). After obtaining these data, an 8 average daily mean temperature was calculated for every day of the year, and then plotted to 9 identify the seasonal trends and determine the duration of each season. Finally, an average 10 temperature was calculated for each season. Table 5 shows the temperature inputs and season 11 durations used in the simulations for each pavement, which resulted from this analysis. 12 13 TABLE 5 Climate Inputs 14
Spring Summer Fall Winter
Pavement Duration (Weeks)
Mean Temp.
Duration (weeks)
Mean Temp.
Duration (Weeks)
Mean Temp.
Duration (Weeks)
Mean Temp
Iowa 12 52º F 16 73º F 8 52º F 16 27º F Montana 12 52º F 16 72º F 16 51º F 8 26º F
Oklahoma 16 63º F 10 81º F 14 61º F 12 38º F Oklahoma 2 16 63º F 10 81º F 14 61º F 12 38º F
Virginia 14 58º F 12 73º F 13 56º F 13 35º F Kentucky 16 58º F 10 80º F 14 57º F 12 34º F
Mississippi 12 58º F 12 77º F 12 58º F 16 41º F Tennessee 9 61º F 16 77º F 11 63º F 16 40º F
15 Traffic Inputs 16 A conservative approach was taken for the traffic inputs in the PerRoad simulations as this 17 information was not provided in the applications. A 100% of single axles weighing between 20 18 and 22 kips was selected. This configuration was used because it represents a maximum traffic 19 level within the legal load limits allowed in the United States. Because the strain generated by 20 single axle loads was of main interest and not the number of cycles to failure, other traffic stream 21 details such as two-way annual average daily traffic, percentage of trucks, and traffic growth 22 were left at default values. 23 24 PerRoad Output and Determination of Strain Distributions 25 PerRoad uses Monte Carlo simulation to account for the variability in pavement responses that 26 could result due to variable material properties. These variations are due to seasonal effects and 27 inherent spatial variability of the materials. For the analysis of each pavement in this study, 5,000 28 simulations were made. After finishing the simulations, PerRoad creates a spreadsheet output file 29 with detailed information on the simulated vertical and horizontal strains at the selected critical 30 locations (e.g., at the bottom of the AC layer and on top of the subgrade layer). With the 31 information obtained from this file, the strain distributions were determined at the required 32 percentiles to analyze and compare with the proposed criteria (Table 1). A macro application was 33 designed to perform this task directly from each PerRoad output file. 34 35
Castro, Tran, Robbins, Timm and Wagner 12 RESULTS AND DISCUSSION 1 2 Further Evaluation of Horizontal Strain Criteria 3 After obtaining the strain distributions resulting from the simulated pavements in PerRoad, the 4 results were analyzed and compared to the criteria shown in Table 1. The results for the 5 horizontal strain distributions obtained for the perpetual pavements are presented in Figure 4. 6 7
8 FIGURE 4 Horizontal strain distribution results. 9 10
Figure 4 also shows the cumulative strain distributions (dotted curves) for the test 11 sections on the NCAT Pavement Test Track (Figure 2) used for evaluating the proposed design 12 criteria by Tran, et al. (5). As noted earlier, all of these test sections failed due to bottom-up 13 fatigue cracking, and their cumulative strain distributions were greater than (i.e., on the right of) 14 the limiting strain criteria. 15
As shown in Figure 4, the cumulative strain distributions for all the perpetual pavements, 16 except for those of the Virginia, Kentucky and Montana sections, were less than (i.e., on the left 17 of) the limiting cumulative strain distribution. The cumulative strain distributions for the 18 Virginia and Kentucky sections had some instances, around the 1st and 30th percentiles, where 19 their simulated strains surpassed the criteria. The silumated strains for the Montana section 20 exceeded the criteria between the 30th and 35th percentiles. 21
The results in Figure 4 show that the cumulative strain distributions for all the perpetual 22 pavements were in the recommended area to the left of the limiting cumulative strain distribution 23 starting at the 60th percentile. When the simulated strains exceeded the criteria by a low margin 24 below the 60th percentile, the simulated strains were less than 120 microstrain; at the low strain 25
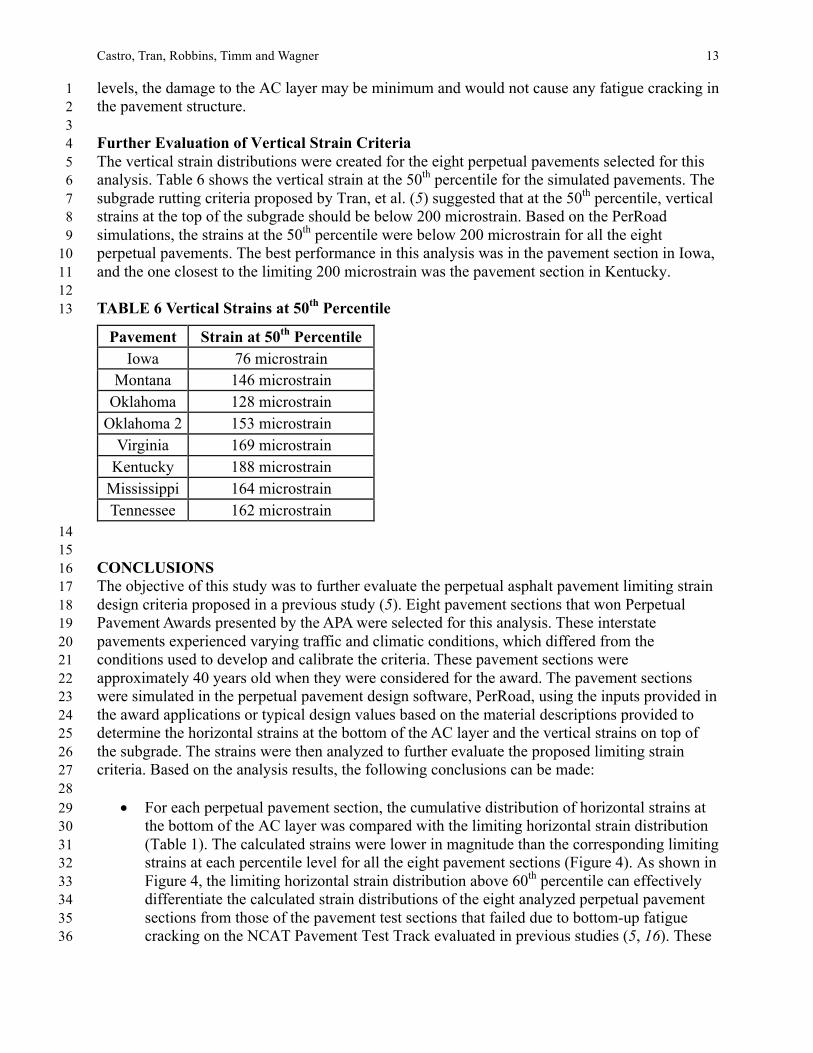
Castro, Tran, Robbins, Timm and Wagner 13 levels, the damage to the AC layer may be minimum and would not cause any fatigue cracking in 1 the pavement structure. 2 3 Further Evaluation of Vertical Strain Criteria 4 The vertical strain distributions were created for the eight perpetual pavements selected for this 5 analysis. Table 6 shows the vertical strain at the 50th percentile for the simulated pavements. The 6 subgrade rutting criteria proposed by Tran, et al. (5) suggested that at the 50th percentile, vertical 7 strains at the top of the subgrade should be below 200 microstrain. Based on the PerRoad 8 simulations, the strains at the 50th percentile were below 200 microstrain for all the eight 9 perpetual pavements. The best performance in this analysis was in the pavement section in Iowa, 10 and the one closest to the limiting 200 microstrain was the pavement section in Kentucky. 11 12 TABLE 6 Vertical Strains at 50th Percentile 13
Pavement Strain at 50th Percentile Iowa 76 microstrain
Montana 146 microstrain Oklahoma 128 microstrain
Oklahoma 2 153 microstrain Virginia 169 microstrain
14 15 CONCLUSIONS 16 The objective of this study was to further evaluate the perpetual asphalt pavement limiting strain 17 design criteria proposed in a previous study (5). Eight pavement sections that won Perpetual 18 Pavement Awards presented by the APA were selected for this analysis. These interstate 19 pavements experienced varying traffic and climatic conditions, which differed from the 20 conditions used to develop and calibrate the criteria. These pavement sections were 21 approximately 40 years old when they were considered for the award. The pavement sections 22 were simulated in the perpetual pavement design software, PerRoad, using the inputs provided in 23 the award applications or typical design values based on the material descriptions provided to 24 determine the horizontal strains at the bottom of the AC layer and the vertical strains on top of 25 the subgrade. The strains were then analyzed to further evaluate the proposed limiting strain 26 criteria. Based on the analysis results, the following conclusions can be made: 27 28
• For each perpetual pavement section, the cumulative distribution of horizontal strains at 29 the bottom of the AC layer was compared with the limiting horizontal strain distribution 30 (Table 1). The calculated strains were lower in magnitude than the corresponding limiting 31 strains at each percentile level for all the eight pavement sections (Figure 4). As shown in 32 Figure 4, the limiting horizontal strain distribution above 60th percentile can effectively 33 differentiate the calculated strain distributions of the eight analyzed perpetual pavement 34 sections from those of the pavement test sections that failed due to bottom-up fatigue 35 cracking on the NCAT Pavement Test Track evaluated in previous studies (5, 16). These 36
Castro, Tran, Robbins, Timm and Wagner 14
perpetual sections are located at different geographical locations and experiencing 1 different climatic conditions. When combined with the test sections on the NCAT 2 Pavement Test Track evaluated in previous studies, all the sections represent the four 3 LTPP climate zones. 4
• The cumulative distribution of vertical strains on top of the subgrade was also determined 5 for each of the eight perpetual pavement sections. The vertical strains at the 50th 6 percentile were lower than 200 microstrain as proposed in a previous study (5, 16). 7
8 In summary, the analysis conducted in this study provides additional support for the 9
limiting strain criteria proposed in previous studies (5, 16). It is recommended that the limiting 10 strain distributions be considered for future perpetual pavement design instead of single 11 threshold values for controlling the horizontal and vertical strains. 12 13 ACKNOWLEDGEMENT AND DISCLAIMER 14 This research project was sponsored by the Federal Highway Administration. The contents of 15 this paper reflect the views of the authors who are responsible for the facts and accuracy of the 16 data presented herein. The contents do not necessarily reflect the official views or policies of the 17 sponsor, the National Center for Asphalt Technology or Auburn University. This paper does not 18 constitute a standard, specification, or regulation. Comments contained in this paper related to 19 specific testing equipment and materials should not be considered an endorsement of any 20 commercial product or service; no such endorsement is intended or implied. 21
22
Castro, Tran, Robbins, Timm and Wagner 15 REFERENCES 1 1. AASHTO. AASHTO Guide for Design of Pavement Structures, AASHTO, 2
Washington, DC, 1993. 3 2. Newcomb, D., R. Willis, and D. Timm. Perpetual Asphalt Pavements: A 4
Synthesis, APA, Lanham, MD, 2010. 5 3. Thompson, M.R. and S.H. Carpenter. “Considering How Mix Asphalt Fatigue 6
Endurance Limits in Full Depth Mechanistic Empirical Pavement Design”, 7 International Conference on Perpetual Pavements, Columbus, OH, 2006. 8
4. Bonaquist, R. “Developing a Plan for Validating an Endurance Limit for HMA 9 Pavements”, NCHRP 9W44, National Cooperative Highway Research Program, HMA 10 Workshop Executive Summary, 2007. 11
5. Tran, N., M. Robbins, D. Timm, R. Willis, and C. Rodezno. “Refined Limiting Strain 12 Criteria and Approximate Ranges of Maximum Thicknesses for Designing Long-Life 13 Asphalt Pavements”, NCAT Report 15-05, National Center for Asphalt Technology, 14 Auburn, AL, 2015.. 15
6. Monismith, C. and D. McLean. “Structural Design Considerations”, Proceedings of 16 the Association of Asphalt Paving Technologists, Vol. 41, 1972. 17
7. Thompson, M.R. and S.H. Carpenter. “Perpetual Pavement Design: An Overview”, 18 International Conference on Perpetual Pavements, Columbus, OH, 2009. 19
8. Prowell, B., E.R. Brown, E.M. Anderson, J.S. Daniel, H. Von Quintus, S. Shen, S. 20 Carpenter, S. Bhattacharjee, and S. Maghsoodlo. Validating the Fatigue 21 Endurance Limit for Hot Mix Asphalt, NCHRP Report 646, 2010. 22
9. Carpenter, S.H. and S. Shen. “Effect of Mixture Variables on the Fatigue 23 Endurance Limit for Perpetual Pavement Design”, International Conference on 24 Perpetual Pavements, Columbus, OH, 2009. 25
10. Nishizawa, T., S. Shimeno, and M. Sekiguchi. “Fatigue Analysis of Asphalt 26 Pavements with Thick Asphalt Mixture Layer”, Proceedings of the 8th International 27 Conference on Asphalt Pavements, Vol. 2, University of Washington, Seattle, WA, 28 1997. 29
11. Wu, Z., Z. Q. Siddique, and A. J. Gisi. “Kansas Turnpike – An Example of Long 30 Lasting Asphalt Pavement”, Proceedings of the International Symposium on Design 31 and Construction of Long Lasting Asphalt Pavements, National Center for Asphalt 32 Technology, Auburn, AL, 2004.. 33
12. Yang, Y., X. Gao, W. Lin, D.H. Timm, A.L. Priest, G.A. Huber, and D.A. Andrewski. 34 “Perpetual Pavement Design in China”, Proceedings of the International Conference 35 on Perpetual Pavements, Ohio University, 2006. 36
13. Willis, J.R. and D.H. Timm, “Field-Based Strain Thresholds for Flexible Perpetual 37 Pavement Design,” Report No. 09-09, National Center for Asphalt Technology, 38 Auburn University, 2009. 39
14. Wu, Z., Z. Q. Siddique, and A. J. Gisi. “Kansas Turnpike – An Example of Long 40 Lasting Asphalt Pavement”, Proceedings of the International Symposium on 41 Design and Construction of Long Lasting Asphalt Pavements, National Center for 42 Asphalt Technology, Auburn, AL, 2004. 43
15. Willis, J.R. and D.H. Timm, “Development of Stochastic Perpetual Pavement 44 Design Criteria”, Journal of the Association of Asphalt Paving Technologists, 45 Volume 79, 2010, pp. 561-596. 46
Castro, Tran, Robbins, Timm and Wagner 16 16. Robbins, M. N. Tran, D. Timm, and R.J. Willis, “ Adaptation and validation of 1
stochastic limiting strain distribution and fatigue ratio concepts for perpetual 2 pavement design”, Road Materials and Pavement Design, Volume 16, Issue sup2, 3 2015, pp. 100-124. 4
17. Monismith, C., J. Harvey, T. Bressette, C. Suszko, and J. St. Martin. “The IW710 5 Freeway Rehabilitation Project: Mix and Structural Section Design, Construction 6 Considerations and Lessons Learned”, International Symposium on Design and 7 Construction of Long Lasting Asphalt Pavements, National Center for Asphalt 8 Technology, Auburn, AL, 2004. 9
18. Walubita, L.F., W. Liu, T. Scullion, and J. Leidy. “Modeling Perpetual Pavements 10 Using the Flexible Pavement System Software”, Proceedings of the 87th Transportation 11 Research Board Meeting, Transportation Meeting Board, Washington, D.C., 2008. 12
19. Weaver, Chaz. “I-81 Perpetual Pavement Section Forensic Investigation”, NCHRP 13 01-49 Report, Virginia Department of Transportation, Staunton, VA, 2012. 14
20. Weather Underground. www.wunderground.com, Accessed on March 1st, 2016. 15