62
Good Practice Guide on Port Area Noise Mapping and Management NoMEPorts
1
Good Practice Guide onPort Area Noise Mappingand Management
NoMEPorts
1
This Good Practice Guide on Port Area Noise Mapping and Manage-ment has been developed by the partners of the NoMEPorts (Noise Management in European Ports) Project. It not only provides guidance and examples of best practice on noise management in ports, but also for other industrial areas. The six steps involved take into considera-tion the geographical situation and future developments, inventory of noise sources, noise modelling, noise mapping and action planning. These lead to the final step of ongoing noise management.
The NoMEPorts project was based on the concept of shared knowl-edge on noise issues with the aim of creating a level playing field between European Ports in terms of implementation of the Environ-mental Noise Directive. Throughout the Project from the start of the opening meeting in Amsterdam, there was a great willingness to share knowledge and experience. This level of collaboration was sustainedthroughout the Project.
Dr. Chris Wooldridge of Cardiff University together with his Research Assistants Antonis Michail and Joe Green, compiled the contributions from the project partners (see box on next page). The overall structure and strategic perspectives were provided by the Editorial Board.
The Project Partners acknowledge with grateful thanks the profes-sional assistance and valuable contributions of the Core Management team members Ton van Breemen, André Blikman, Nina van Vulpen, and Rob Smit from the Port of Amsterdam, Herman Journée and
Narasha Bakkers of the EcoPorts Foundation, and Menno van Rijn and José Conde of Bax and Willems. The research and development activi-ties necessary to deliver the products of NoMEPorts have been driven by a positive team spirit of support and collaboration.
NoMEPorts was part funded by support from the EU LIFE Environment 2005 Programme. This facilitated the development of the research team and supported the investigative programme that has lead to the production of this Guide.
The Partners hope that the Guide itself will be viewed as a positive contribution to the highly significant issue of noise management in its widest context. As Project Leader, I would like to thank everybody who has contributed their knowledge, skills and experience to the NoMEPorts project in such a whole heartedly friendly and professional manner.
Ton van Breemen.Project Leader, NoMEPorts,Port of Amsterdam
Preface

2
Lead partner Port of AmsterdamTon van BreemenAndré BlikmanNina van vulpenRob Smit
Full partnersPort of HamburgDoris MüllerChristian PoppMarion Bing
Port of LivornoGiovanni MottaPaolo GiovannettiMario MorrettaAndrea Iacoponi
Port of Copenhagen/MalmöGert NørgaardClaus Backalarz
Port of ValenciaFederico Torres MonfortRafael Company
Port of CivitavecchiaStefano GazzanoAlessandro Puppini
Observer partners Port of RotterdamFrank Wolkenfelt
Port of BremenJochen Kress
Port of TenerifeElisa Moratinos Espinosa
Port of GothenburgBjorn Sigström
Port of OsloCharlotte Iversen
Other partnersEcoPorts Foundation Herman JournéeNarasha Bakkers
Cardiff UniversityChris WooldridgeAntonis MichailJoe Green
DGMR consultansRob Witte
Editorial BoardTon van BreemenPort of Amsterdam Amsterdam
Christian Popp Lärmkontor GmbHHamburg
Rob Witte DGMR ConsultantsThe Hague
Frank Wolkenfelt Port of RotterdamRotterdam
Chris Wooldridge Cardiff UniversityCardiff
NoMEPorts partners:

3
This Guide has been compiled as a synthesis and user-friendly inter-pretation of the Environmental Noise Directive (END) and as a sum-mary of the management response options available for the effective implementation of its provisions with a focus on port areas. However, the guide may also be applied to other industrial areas.
The concepts and research pathway that shaped the development of the Guide through the NoMEPorts Project are given along with iden-tifi cation of the target audience. The context of the issue of noise is set against changes in the role of ports with discussion on policy and reasons to act in response to environmental challenges. The implica-tions of END and the timescale for implementation are summarized in the second chapter.
The criteria for defi ning the boundaries of noise maps and the meth-ods required to produce the maps themselves are described in the third chapter. Considerations of the nature of data and geographi-cal information required, and the steps involved in the modelling of noise sources are outlined in sequence. Additional, more detailed ex-planation is available in the Technical Annex to the Project. Calcula-tion methods and the presentation of results are summarized with examples.
The topic of noise management itself is addressed through considera-tions of analysis of noise maps, the options available for noise reduc-tion, and the development of action plans for current activities and
future development. Guidance is given on effective methods for dis-semination to, and involvement of, the public in terms of dealing with noise issues. The Guide concludes with a perspective on evaluation of action plans and their implementation.
Abstract
Figure 1: Port of Amsterdam: East part of the port area, buffer zone, existing residential area and plans for new residential areas.

4
5
Abstract 3
Chapter 1 Introduction 71.1 Background and legislation 71.2 Purpose of the guide 71.3 Target groups 71.4 Good Practice Guide Approach 81.4.1 Concepts 81.4.2 Changes in the role of ports 91.4.3 Reasons to act 121.5 The environmental imperative 131.6 Policy 131.7 Noise management 141.8 Port sector response 15
Chapter 2 Responsibilities and legislation 172.1 Introduction and implications 172.2 Timescales for implementation 19
Chapter 3 Methods: Definition of boundaries and noise mapping 213.1 Geographical boundaries in port area noise studies 213.2 Noise source boundaries in port area studies 213.3 Port area noise mapping 23
3.3.1 Geographical information 243.3.2 Data collection and modelling of noise sources 253.3.3 Defining calculation aspects and parameters 273.3.4 Running calculations 273.3.5 Presentation of results 28
Chapter 4 Noise Management 394.1 Introduction 394.2 Analysis of noise maps 394.2.1 Screening for noise source significance 404.2.2 High priority areas 404.2.3 Number of people affected 434.2.4 General principles of noise planning 434.3 Noise mitigation 434.3.1 Source mitigating measures 444.3.2 Propagation measures 46 4.3.3 Receiver measures 474.4 Action plans and future developments 474.5 Dissemination to the public 494.5.1 Introduction 494.5.2 Informing the Public 50 4.5.3 Participation of the public 514.6 Evaluation of Action Plans 524.6.1 Consideration of future developments 524.6.2 Evidence of effective mitigation 53
Table of contents

6
4.6.3 Polluter pays principle 544.7 Review of current action and future plans 544.7.1 Principles for reviewing the measures taken 55
Chapter 5 Conclusions and recommendations 59

7
1.1 Background and legislationThe Environmental Noise Directive 2002/49/EC (END) has several implications for those agencies and institutions responsible for the health and environmental management of port areas. The purpose of this Guide is to provide a synthesis of the major provisions of the Directive and to summarize the management options that may be available to the professional tasked with avoiding, preventing or re-ducing the harmful effects of noise, including annoyance.
The major goal of the Directive is to achieve a high level of protection for communities and the environment through mapping, dissemina-tion of information, and the adoption of action plans. Details of the Directive are summarized in Chapter 2.
1.2 Purpose of the GuideThis ‘Good practice guide on port area noise mapping and manage-ment’ has been compiled as a synthesis and user-friendly interpreta-tion of END, and a summary of management response options for the effective implementation of its provisions with a focus on port areas. However, the guide may also be applied to other industrial areas.
The research and development underpinning the Guide has its origins in the NoMEPorts project (http://nomeports.ecoports.com/) that had as its main objective the reduction of noise, in and around port industrial areas through demonstrations of a noise mapping and management system. The project was funded by the LIFE-Environmental Programme
of the European Commission. Partner ports were: Amsterdam (Project Leader), Civitaveccia, Copenhagen/Malmo, Hamburg, Livorno, and Va-lencia. Observer ports were Bremen, Gothenburg, Oslo, Rotterdam and Tenerife. The partners were assisted by the EcoPorts Foundation (EPF, project management and dissemination), DGMR, Netherlands (noise specialists), and Cardiff University, UK (science coordination).
1.3 Target groupThe Guide has been prepared for senior port managers, port environ-mental managers, policy-makers, environmental authorities, spatial planners and strategic decision-makers. There is a separate, but linked, Technical Annex for acousticians and those requiring more technical detail and explanation. As with other significant environmental issues, the number and range of stakeholders with an interest or concern with noise management is wide and diverse. Within the port area, port authorities themselves should be mindful of their liabilities and responsibilities in terms of compliance and implementation. Where the port authority has the status of a landlord, their port operators and tenants may need to be involved. Other stakeholders with an interest in the port authority’s policy and action plans concerning noise may include the groups mentioned in table 1.
Chapter 1: Introduction
8
1.4 Good Practice Guide Approach
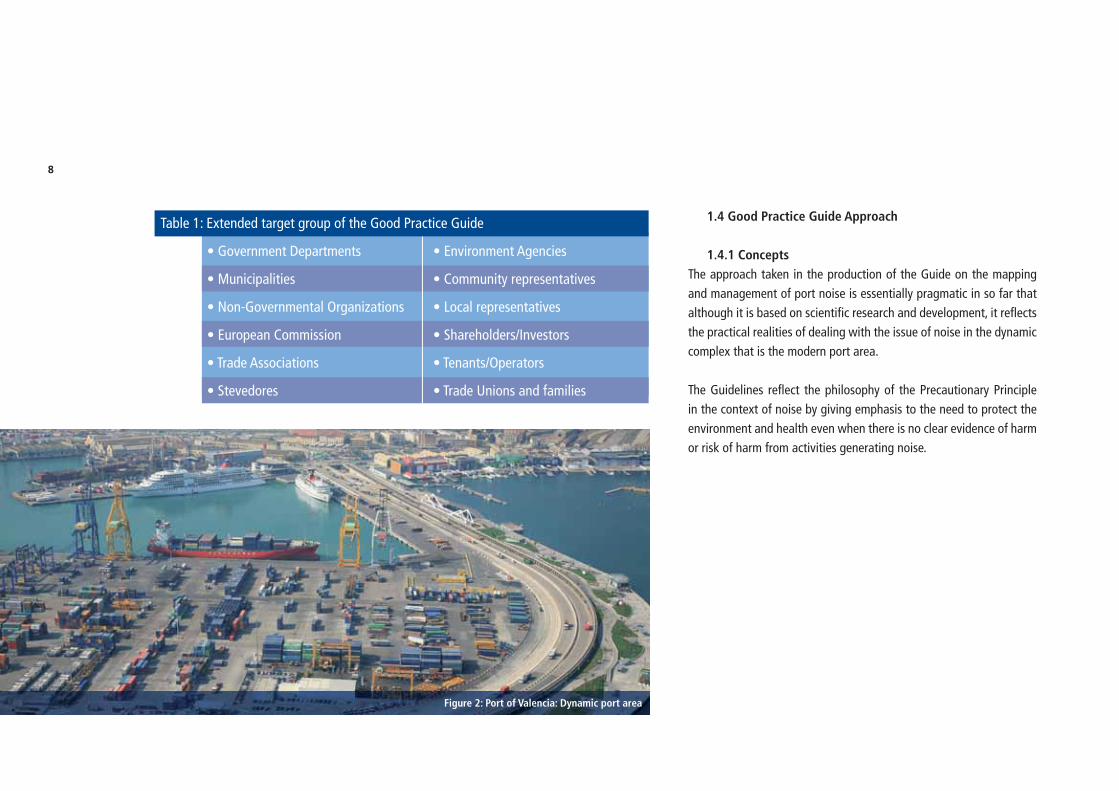
1.4.1 ConceptsThe approach taken in the production of the Guide on the mapping and management of port noise is essentially pragmatic in so far that although it is based on scientifi c research and development, it refl ects the practical realities of dealing with the issue of noise in the dynamic complex that is the modern port area.
The Guidelines refl ect the philosophy of the Precautionary Principle in the context of noise by giving emphasis to the need to protect the environment and health even when there is no clear evidence of harm or risk of harm from activities generating noise.
Table 1: Extended target group of the Good Practice Guide
• Government Departments • Environment Agencies
• Municipalities • Community representatives
• Non-Governmental Organizations • Local representatives
• European Commission • Shareholders/Investors
• Trade Associations • Tenants/Operators
• Stevedores • Trade Unions and families
Figure 2: Port of Valencia: Dynamic port area

9
The following figure schematically represents the phased approach of the NoMEPorts project with regard to port area noise mapping and management. The figure also indicates the sections of the Good Prac-tice Guide where the relevant issues are explained and analysed.
Chapter 2 focuses on the legislative framework in relation to noise in port areas. In Chapter 3, the Guide examines methodologies and practices for defining the geographical boundaries of the area of inter-est as well as the nature and range of noise sources to be taken into consideration. A generic methodology for noise mapping in port areas is then presented. Chapter 4 focuses on the analysis of the noise map-ping results, noise action planning, and how all those components
can be integrated into a noise management system for port areas to deliver continual environmental improvement.
The Guide recognizes that each port may be considered unique in terms of its commercial profile and physical characteristics (often accentu-ated by peculiarities of ownership, organization, culture and national legislation), and yet they face many environmental challenges in com-mon, including that of noise. Over recent years, the situation facing the professional port environmental manager has been successively compounded by the increasing significance, diversity and complex-ity of environmental issues. The growing demands and expectations of society in terms of the port authority’s response to environmental protection and the concept of sustainable development has added a further dimension to the range of stakeholder scrutiny focussing on the sector’s environmental credentials.
1.4.2 Changes in the role of portsThe nature of the port sector’s activities and operations have evolved significantly from just the handling of ships and their cargoes to the pursuance of a wide range of interests including the management of individual estates that has exposed them to the environmental issues typical of other large industrial and manufacturing operations. Port professionals are increasingly tasked with managing the port area rather than site-specific operations as was traditionally the case.As well as evolving into industrial areas in their own right, ports are highly significant logistic nodes. These are the nodal points in the
Figure 3: The NoMEPorts phased approach to port area noise mapping and management
Liability, responsibility, and stakeholder framework (Chapters 1 and 2)
Area and noise sources boundaries (Sections 3.1 and 3.2)
Noise predicting and mapping (Section 3.3)
Analysis of noise maps (Section 4.2)
Noise action planning (Sections 4.3 and 4.4)
Integrated noise management system (Chapter 4)

10
logistic chain where the functions of cargo handling, warehousing and modal transferring take place. This introduces a much broader spectrum to the consideration of sources of noise within and around the legal defi nition of the port area. Logistic nodes can be dry ports, seaports, inland ports, airports, warehouses, stores, production and manufacturing sites.Seaports and their port areas are thus important nodes within the whole chain complex through virtue of concentration, diversity of op-eration and critical connectivity of the chain operation. Seaports are characterized by a higher degree of complexity and variety of opera-tions in comparison with other logistic nodes. Many port areas dem-onstrate intense intermodal concentration as several transport modes coalesce to form the functioning node (see fi gure 5).
Additionally, in most cases port areas are situated in close juxtaposi-tion to urban areas and may even be bounded by, or include, areas of special environmental signifi cance due to the presence of protected habitats and ecosystems. The diversity of types of cargo, the range of activities, products and services conducted within the port area, the multiple use of the land and sea areas, and the physical impact of the associated infrastructure all identify seaports as major logistic nodes with the attendant implications of the generation and impact of noise.
Manufacturingsite
Store
Store
Manufacturingsite
Manufacturingsite
Store
Store
Manufacturingsite
Figure 4: Signifi cance of ports as links in the logistic chain
Port Port

11Road
Figure 5: Seaport area characteristics1
Multiple types of cargo• Bulk• Liquid bulk• Ro-Ro• Lo-Lo• General cargo
Multiple types of operations• Cargo handling• Warehousing• Modal transferring• Forwarding
Special areal characteristics:• Intensity and concentration of operations• Proximity to urban areas and other areas of special attention
(habitats, tourism)• High risk (concentration of activities, hazardous cargo)• Limited space (restricted development)• Speed and effi ciency requirements
Seaport Area
Seaport Area
1: The fi gure demonstrates the complexity of infrastructure and activities that may contribute to the ambient noise of a port area agglomeration. Qualifying components for END are identifi ed in Chapter 2.
Rail
Marine
Canal
Pipelines
Road
Rail
Marine
Canal
Pipelines

12
1.4.3 Reasons to actMany port authorities have the fi rst and most direct contact with the tenants of land in the port area. Port authorities may not be obliged from a legal point of view to implement the END Directive (depending on circumstances and qualifying criteria) but increasingly, may benefi t from undertaking noise mapping, action planning and management.
For example, noise mapping provides the port authorities with the basic information necessary to identify sources of noise generated in the port area that cause the greatest impact. There are a wide range of potential sources including industrial activities and transport opera-tions such as road, rail and air.
Noise maps provide a tool to analyse the noise situation. They are the basis for developing action plans in order to minimise the im-pact of noise. As such, action plans provide a tool for planning future port development in terms of implications of noise issues related to expansion, investment and compliance with legislation. Future noise impacts cannot be measured in absolute terms but they can be pre-dicted by accurate noise calculations, using strategic noise mapping software. When future developments outside the port area are also in-corporated into the noise mapping software, prediction of future noise impact can be made for new residential areas. This provides the port authorities with crucial information for port development and plan-ning applications.
The graphic representation of noise values and impacts in 2-D and 3-D images (see examples Chapter 3) may prove to be powerfully per-suasive documents in the often contentious issues of port expansion and city development. Their strategic value is increasingly recognized in terms of investment, mitigation of impact, stakeholder negotiation and planning consent.
Figure 6: Port of Livorno: Residential area in the proximity of the Port

13
Noise mapping and the resultant action plans derived from their analysis may provide port managers with authoritative, science-based calculations that may be used to demonstrate their environmental credentials and to bring some quantified objectivity to what is often a controversial, and passionate environmental debate. Noise manage-ment tools may be used by the port authorities to help select the best location in the port area for a particular activity.
The production, analysis and interpretation of noise maps in conjunc-tion with associated noise management tools can provide the port manager with a suite of useful decision-making options specifically designed to assist with compliance with legislation (noise limits), the mitigation of the impacts of operations and activities, and the delivery of high standards of health and environmental quality through the implementation of best practice solutions.
1.5 The environmental imperativeMany port authorities are increasingly active in applying environmen-tal management to their port area, not just to the immediate vicinity of the waterfront or areas devoted solely to port-related activities. They have been driven by their liabilities and responsibilities as land-lords in so far that in the interpretation of some environmental leg-islation port authorities may reasonably be expected to bring some influence to bear on the environmental performance of their tenants and operators.
In identifying their significant environmental aspects, elements of the authority’s activities, products or services that can interact with the environment (EN ISO 14001:1996), ports should take into account as-pects for which they are legally liable, those of their tenants and op-erators over which they could reasonably be expected to bring some influence, and issues of national or local significance pertinent to the port area. Functional organization of an environmental programme for the port area ipso facto implies consideration of the issue of noise.
1.6 PolicyIn terms of environmental management, the policy of the European Sea Ports Organisation (ESPO) is firmly established as being that of compliance with legislation and the achievement of high standards of environmental quality through voluntary, self-regulation.
It is widely acknowledged within the sector that effective environmen-tal management, the functional organization necessary to attain such objectives, must produce compliance with increasingly international and European legislation whilst reflecting the local circumstances of the individual port area. ESPO seeks a ‘level playing-field’ in terms of standards, and the enforcement of legislation and regulation.
14
1.7 Noise managementNoise pollution, the excessive or annoying degree of unwanted sound in a particular area has become an increasingly signifi cant environ-mental issue for many port authorities.
Noise levels are measured in decibels (dB), based on a logarithmic scale correction for ear sensitivity at lower levels that is expressed by the A-weighting dB(A). Noise indicators are typically an average of volume and duration over a fi xed period of time. Because noise level changes all the time, averaging is termed equivalent noise level (Leq). LAeq refers to the energy equivalent average sound pressure level measured using the A-weighting which is most sensitive to speech in-telligibility frequencies of the human ear. As the same noise is judged differently between day time and night time, the EU proposed time periods for calculations are:
• Lday is the A-weighted long-term average sound level 07:00-19:00 (12 hours)• Levening is the A-weighted long-term average sound level 19:00-23:00 (4 hours)• Lnight is the A-weighted long-term average sound level 23:00-07:00 (8 hours)
The overall day-evening-night noise level is expressed by the Lden in-dicator. Lden is a descriptor of noise level based on energy equivalent
noise level (Leq) over a whole 24 hour day with a penalty of 10 dB(A) for night time noise (23.00-7.00) and an additional penalty of 5 dB(A) for evening noise (19.00-23.00).
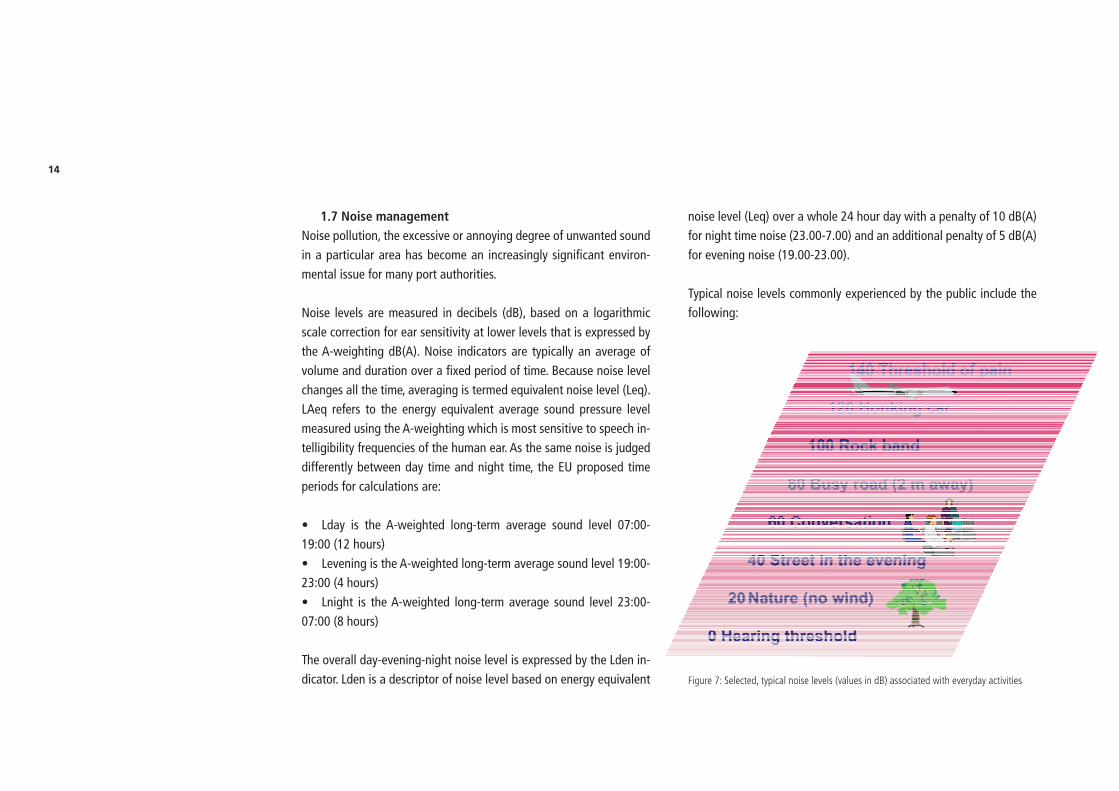
Typical noise levels commonly experienced by the public include the following:
Figure 7: Selected, typical noise levels (values in dB) associated with everyday activities

15
According to the World Health Organization the following noise levels have to be taken into account (Guidelines for Community Noise, ed-ited by Birgitta Berglund, Thomas Lindvall, Dietrich H. Schwela, World Health Organization 1999). They state that at night, sound pressure levels at the outside façades of living spaces should not exceed 45 dB Lnight and 60 dB LAmax, so that people may sleep with bedroom windows open. These values have been obtained by assuming that the noise reduction from outside to inside with the window partly open is 15 dB.
The Lden and Lnight are chosen by the EU as indicators for evaluating noise levels in strategic noise maps. In many countries in Europe also peak levels (hammering, falling materials, etc) and tonal noise (tim-ber saw, high voltage transformer) are part of legislation. These peak levels (LAmax) and tonal noise contribute highly to annoyance and should be avoided when possible.
Ten years ago, in the 1996-7 survey on behalf of the European Sea Ports Organization (ESPO), port managers themselves identified noise as a major item in the environmental agenda ranking it, on average, 7th out of thirty priority topics. From its inception, END was always going to be significant to port authorities because it was focused on road, rail and air traffic, industries and ports. The port sector’s role as a critical trans-port node in the whole logistic chain guaranteed direct implications of END for port authorities in terms of implementation of appropriate management responses in order to deliver compliance with legislation.
The concept of area management is pertinent because noise is argua-bly one of the most trans-boundary phenomena requiring operational control, is an issue throughout the logistic chain and a major consid-eration in the often sensitive relationship between port and city. The END therefore has direct significance for port environmental manage-ment in terms of port sector policy and port authority implementation, where appropriate.
1.6.1 Port sector response In order to play an active role in the implementation of the END proc-ess, the port sector pursued its established approach of collaborative research and development. The NoMEPorts Project was established to produce practicable methodologies for port-based implementation of the new legislation. The project was managed by the EcoPorts Founda-tion (EPF, a non profit network of ports and port related stakeholders sharing environmental experience) which was established in 1999 by European ports for the benefit of ports and the port community.
The significance of this background to the recommendations of the Guide is that they are derived from the application of science-based methodology within the operational domain of commercial port ar-eas and reflect the experience of port managers and scientific practi-tioners. NoMEPorts drew on noise calculation methods developed in previous EU Projects HARMONOISE and IMAGINE to produce a new EU methodology, evaluated and validated in the partner ports.

16
Fundamental to the project was the imperative to take a generic, har-monized approach to data collection and to produce a set of guide-lines for response options to the challenges of noise management that are transferable to the wider port community. This latter point is the essence of the EPF approach where ports help ports for the mutual benefits of demonstrating compliance with legislation, and the reduc-tion of costs and risks through the application of practicable tools and methodologies.
Port noise maps in 2-D and 3-D (see Chapter 3) have the potential to be valuable resources for effective environmental management de-cision-making in the complex that is the port-city area. However, in terms of planning future port development, it should be noted that careful compilation and calculation of data in combination with criti-cal analysis of results is essential for predicting impacts of any expan-sion of port area activities.

17
2.1 Introduction - the implicationsOn 18 July 2002, the Directive 2002/49/EC (Environmental Noise Direc-tive - END) entered into force by publication in the Official Journal of the European Communities. Thus, the European Community followed the noise protection policy outlined in the Green Paper “Future Noise Policy” by means of legal regulations including the issue of environ-mental noise emissions.
The fundamental goal of the Directive is “to achieve a high level of health and environmental protection…” For this, it is necessary “to avoid, prevent or reduce on a prioritized basis the harmful effects, including annoyance”. To reach this goal the following measures are set out:
Chapter 2: Responsibilities and Legislation
Table 2: Key END provisions
• The determination of exposure to environmental noise, through noise mapping, by methods of assessment common to
Member States
• Ensuring that information on environmental noise and its effects is made available to the public
• Adoption of action plans by Member States, based upon noise-mapping results, with a view to preventing and reducing
environmental noise where necessary and particularly where exposure levels can induce harmful effects on human health and to
preserving environmental noise quality where it is good
• Furthermore, the Member States have to ensure that the public is consulted about proposals for action plans (END, Article 8).
Also, early and effective opportunities to participate in the preparation and review of the action plans have to be offered to the
public

18
It is important to note that the results of the public consultation have to be taken into account in the process of action planning. At the end of the planning process the public has to be informed on the decisions taken. Reasonable time-frames have to be provided allowing suffi-cient time for each stage of public participation.The Directive is the basis for the implementation of measures to re-duce the noise emission of the most important sources of noise and to inform the Commission about the impact by environment noise in the Member States.
The END has six annexes:• Annex I defines the day-evening-night level (Lden) and the night-
time noise indicator( Lnight)• Annex II describes the interim computation and the interim meas-
urement methods for Lden and Lnight.• Annex III gives a very brief overview over possible assessment
methods for harmful effects such as annoyance or sleep distur-bance.
• Annex IV providing the Member States with the minimum require-ments for strategic noise mapping.
• Annex V is about the minimum requirements for action plans.• Annex VI is listing the data to be sent to the Commission
distinguishing between agglomerations and major traffic noise sources.
The Directive 2002/49EC applies to environmental noise to which humans are exposed in particular in built-up areas, in public parks or other quiet areas in an agglomeration, in quiet areas in the open country, near schools, hospitals and other noise-sensitive buildings and areas. For this reason strategic noise maps have to be made for:
1. Agglomerations(part of a territory having a population exceeding more than 100.000 persons and a typical population density for urbanized area). Noise mapping for agglomerations has to consider traffic on roads, railways, and airports as well as industrial activities including noise from port areas. However, it may be advisable that ports in smaller cities or in isolated areas outside agglomera-tions should be mapped to help these ports to get a reliable basis for discussions with urban planners trying to plan residential areas in the direct vicinity of the port area, or to assist planning applica-tions for port development.
2. Major roads (a regional, national or international road, which has more than
three million vehicle passages a year)3. Major railways (a railway, which has more than 30 000 train passages per year)4. Major airports
(a civil airport, with more than 50 000 movements per year(a movement being a take-off or a landing), excluding those exclusively used for training purposes on light aircraft)

19
2.2 Timescales for implementationThe requirements of the END have to be fulfilled according to the time-scale as shown in Table 3.
Industrial noise is only mentioned as a noise to be taken into account by the agglomerations. Industrial areas in themselves are not men-tioned as a major noise source. Ports can be seen as industrial areas or can be a part of an industrial area.
END defines ‘agglomeration’, as detailed above, but it does not specify the body responsible for overseeing the requirements of the Directive. This may vary from State to State.
Table 3: Time-scale for the preparation of strategic noise maps and action plans
Area / source to be investigated Strategic noise maps until Action plans until
Agglomerations
>250,000 inhabitants 30 June 2007 18 July 2008
>100,000 inhabitants 30 June 2012 18 July 2013
Major roads
>6,000,000 vehicle passages 30 June 2007 18 July 2008
per year
>3,000,000 vehicle passages 30 June 2012 18 July 2013
per year
Major railways
>60,000 train passages per year 30 June 2007 18 July 2008
>30,000 train passages per year 30 June 2012 18 July 2013
Major airports
>50,000 movements per year 30 June 2007 18 July 2008

20

21
This chapter focuses on tools and methodologies that can assist port noise management. It follows a phased approach, starting with the definition of the geographical boundaries of the noise study area, continuing with the discussion on relevant noise sources to be taken into consideration in the study, and concluding by setting a generic, principles - based approach to port area noise mapping.
3.1 Geographical boundaries in port area noise studiesA common point of debate with regard to port area noise manage-ment is defining the boundaries of the area to be managed. Ports may well have clearly defined geographical limits based on legal designa-tion, but when examining noise, one of the more trans-boundary and multi-source environmental aspects, the definition of the boundaries
of a noise study in line with the port area physical boundaries does not appear to be a sensible approach. Port noise, the noise coming from inside the port area, influences the surrounding areas that also need to be taken into consideration. The noise study area should there-fore include (1) the port area where the noise sources of interest are located, (2) residential and other noise sensitive neighbouring areas influenced by the port, and (3) areas between the port area sources and the neighbouring noise sensitive areas.
The locations of residential areas do not have to include the whole city. In principle, the area with an Lden > 55 dB and Lnight > 50 dB should be taken into account. This area can be estimated by making initial calculations without screening and reflections from buildings for the residential areas. This will give information on where the limits of the region of interest may reasonably be located.
3.2 Noise source boundaries in port area studiesNoise sources in port areas can broadly be divided into those of indus-trial or traffic related. Examples are provided in tables 4 and 5.
Although there is a broad agreement that industrial noise sources that are located in port areas have to be taken into consideration in noise studies, there is on-going debate as to whether or not traffic related sources should also be considered, and if so, to what physical extent.
Chapter 3 Methods: Definition of boundaries and noise mapping
Table 4: Examples of industrial noise sources in port areas
Industrial noise sources:
• Port services and facilities
• Terminals (cargo handling, warehousing)
• Industrial areas
• Machinery, workshop
• Vessel repair or maintenance
• Shunting yards
• Vessels when berthed (engine noise)
22
The main argument for not considering it at all, or for partly consid-ering traffi c related sources in noise studies, is based on the limited degree of responsibility of port authorities for the generated traffi c. Although a certain percentage of the traffi c is logically port generated, part of it cannot be considered as such. After discussions between the NoMEPorts project partners, it was decided to take into consideration all traffi c related sources within the limits of the defi ned noise study area (see section 3.1).
Taking into account noise sources (most noticeably roads or railways) devoted exclusively to port activities which extend beyond the study area as defi ned in previous section, the end user may choose to pro-duce more comprehensive coverage and detail and enlarge the study area accordingly. It is considered useful for any noise study to fi rst pro-vide a representative picture of the general noise situation. The issues of assessing the relative contribution of different groups of sources and then allocating responsibilities are signifi cant, but should be tack-led during the analysis of the noise studies and the action planning phases.
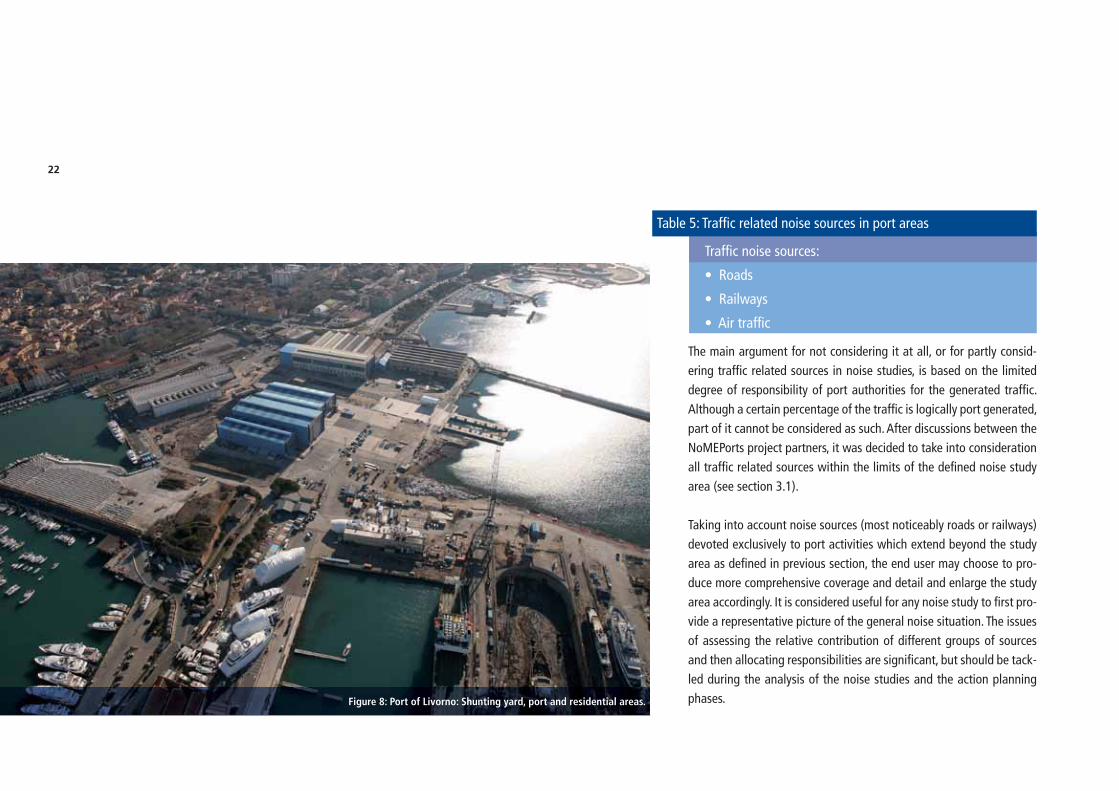
Table 5: Traffi c related noise sources in port areas
Traffi c noise sources:
• Roads
• Railways
• Air traffi c
Figure 8: Port of Livorno: Shunting yard, port and residential areas.

23
3.3 Port area noise mapping This section outlines and explains the process of port area noise map-ping. For every distinct step in the process a generic methodology is presented and selected good practice examples are highlighted. In ad-dition, some of the main challenges and lessons learned derived from the ports’ experiences and other relevant case studies are discussed. Noise mapping is assisted by specialised software. The generic, sche-matic function of any noise prediction software is presented in the graph (fi gure 10).
The software’s input requirements include a 3-dimensional physical model of the area under examination, the inventory and then mod-elling of the main noise sources that occur in the area and fi nally, the setting of the calculation parameters (for example, meteorological data, and locating the calculation points) to be taken into considera-tion. Outputs of the software calculations could include predictions of noise levels in specifi c locations in the area and overall colour coded two and three-dimensional noise maps.
The phased approach to port area noise mapping follows a systematic pathway and involves distinct steps in terms of decision making, data collection and application. These include: selecting the appropriate calculation methods, collecting geographical information, identify-ing and then modelling noise sources (noise data collection required), setting up the calculation parameters, running the calculations and fi nally, presenting the results.Figure 9: Port of Copenhagen/Malmö: Ships at berth.

24
3.3.1 Geographical informationAn essential step of noise mapping is that of acquiring geographical information of the area in 3-D format. A three-dimensional model of the area forms the base for inserting the various noise sources and then calculating the noise maps. Such a model should include all sorts
of morphological and topographical data together with the main structures (buildings, infrastructure) that are present in the area (Table 6). Ideally, this model would be already available in the port in formats such as AutoCAD and GIS. In that case the model can be imported into the noise mapping software.
3Dgeographicalinformation
Meteorologicalinformation
Noisemeasurement, inventory of
operation times
Data on traffi c(road and rail)
Housing areas,ground regions
Model making: Specialised Noise Prediction Software
Input
• Noise sources• Receivers• Calculation parameters• 3D Geogrphical model
Output
• Predicted levels• Noise maps• Affected people
• Hotspots• Noise complaints• Mitigating measures
* L den and L nights* peak levels, tonal noise
• Developments
Interpretation of results
Figure 10: General schematic function of noise prediction software. Note: Calculation methods are specifi ed by each Member State
Calculations
Gathering information

25
3.3.2 Data collection and modelling of noise sourcesAn inventory of the main noise sources is the logical precondition in any attempt to produce a noise map. The noise sources in port areas can be broadly categorised into those of industry and traffic related activities as stated in section 3.2. The process of modelling the identi-fied noise sources involves decision-making and action at two lev-els: (1) selecting the appropriate modelling option for each identified source, and (2) collecting the relevant noise and operational data that would allow attribution of representative values to each source.
In any case, the user has to provide the necessary information that would determine the noise values (sound power levels) for the noise sources under examination. In most cases this process involves rel-evant noise data collection. The following tables 7 and 8 summarise some of the data requirements for modelling industrial and traffic re-lated sources respectively.
It is important to ensure the reliability and accuracy of the noisesources and operational data collection. Inaccuracies during the data collection phase can result in poor quality maps that in turn could impair the value of action plans derived from their interpretation.
Table 6: Geographical data requirements
•Spot heights and contours
•Residential and industrial buildings (including height dimensions)
•Other obstacles in the study area (e.g. containers’ formations)
•Location of noise sources: industry, main roads, secondary roads
and railways.
•Location of noise sensitive areas (schools, hospitals, recreational areas)
•Identification of surface characteristics of ground
Table 7: Data requirements for modelling industrial noise sources
•Location of every relevant industrial source (cargo handling, container
handling, cranes, vehicles, auxiliary equipment, etc.) including height
•Working hours of every source taken into account for day,
evening and night period
•Sound power level of each industrial source

26
Noise data for industrial sources can be obtained by means of di-rect noise measurements or by using default values (permits, limits, specifi cations) and available noise source databases (e.g. Imagine database – SourceDB). Direct noise measurements, using established techniques and specialised equipment and software, are considered to be the most accurate option. However, measurements can be time consuming and often technically complicated (ideally, a source should be isolated from any other background noise for measurement to be considered accurate). The use of default values and databases offer an easier but less accurate approach. Validation of this type of data can be performed by means of measurements for a small sample of the dominant sources from the complete noise data set. Another vali-dating approach with regard to operational data collection may be to cross-correlate information provided by different authorities and sources (e.g. the number of ships berthed on a specifi c pier may be provided by the terminal operators and/or by the port authority)The following table presents some of the main lessons learned from the data collection process by the partner ports of the NoMEPorts project:
Table 8: Data requirements for modelling traffi c related noise sources
• Location of roads and road surface (e.g. asphalt, bricks)
• Road traffi c data: number of vehicles (light, medium or heavy) per hour for
each time period (day, evening, night), average speed.
• Location of railways
• Railway traffi c data: number of trains of each category per hour for each
t time period (day, evening, night), average speed, rail support (wooden or
concrete sleepers, etc) and data on rail track (joined rail, switches and
crossings, etc)
Figure 11: Port of Amsterdam: Quite a challenge to model this situation, what is the operationtime of the different machinery and equipment?

27
3.3.3 Defining calculation aspects and parametersOnce the 3D model is built and the noise sources are simulated, the user of the noise mapping software is tasked to designate receivers and grids on the model. The receivers and grids define the points where the calculation of the noise levels will take place. The receiv-ers could be placed at specific points of noise interest (e.g. limits of
the port area or at the boundary of residential areas). The grids are horizontal or vertical surfaces that consist of a network of receivers. The colour coding that appears after the calculation of the model ac-tually applies to the defined grid surfaces. Horizontal grids should be located at a height of 4 meters from the ground level according to the END. Their density (distance between the grid’s receivers) could vary according to the application. The next step after locating the grids and receivers is to set the calculation parameters. Those mainly include technical information and meteorological data. Meteorological data includes: the annual averages of temperature, relative humidity, at-mospheric pressure, wind direction and speed (the last two are only relevant for the Harmonoise/Imagine propagation model). Such data can sometimes be provided by the port authority, municipality or re-gional environmental agency.
3.3.4 Running calculationsCalculations of noise may be time consuming depending on the total number of noise sources and the physical or other features in the mod-els that need to be calculated. (Specification of the selected prediction model and the computing resources available will also have a bearing on the time required to complete a set of calculations) Outputs of the calculations are the predictions of noise levels in selected areas or points of interest, 2-dimensional and 3-dimensional noise maps. Some techniques that have been researched and applied in order to reduce the amount of sources in the noise models and the calculation time respectively are given in table 10.
Table 9: Lessons learned during data collection
Data collection – lessons learned:
•Data collection requires good collaboration between all the involved parties,
authorities, companies and agents. The composition of a local working group
consisting of these parties is therefore of great importance for the efficiency
of noise data collection.
•The noise data collection can be a time consuming exercise. In order to
get a realistic approach on noise data collection, it is necessary to get an
overview over the input data requirements and availability. It is also
important to designate responsibilities for the different noise data sets.
•After making an inventory of all noise sources, a screening for significance
is advised in order to avoid unnecessary data collection.
•Gaps within the noise data can be filled by default values
(e.g. Imagine source databases) or following experts’ advice.

28
3.3.5 Presentation of results Some selected results of noise mapping studies from the NoMEPorts project are highlighted in this section. The maps demonstrate the noise situation in and around seaport areas and give an insight into the rel-ative contribution of different groups of sources (e.g. road traffic, rail traffic and industrial noise). These are in line with the requirements of END for the presentation of noise maps (separate noise maps for road, rail and air traffic and for industrial noise). Every source should be checked against its own limit values.
Combining the noise sources is useful to predict the effectiveness of noise mitigating measures for the different noise sources in the reduc-tion of the total noise level.
The examples show that such a display of results (by different groups of sources) can aid decision makers both in analysing noise maps and in identifying problem areas as is demonstrated in section 4.2. They also assist in analysing the impact of different sources on those areas, thus guiding the process of noise action planning (see section 4.3).
Table 10: Techniques applied for reducing the calculation time
Techniques for reducing the calculation time:
•Applying “fetching radius” – a distance limit after which noise sources are
not taken in consideration in the calculations. For the needs of strategic noise
mapping the use of a “fetching radius” of 2000m is suggested.
•Reduction of the amount of sources in use – replacing complicated noise
sources networks with simpler ones

29
Figure 12: Port of Civitavecchia: Multiple noise sources, ships and cranes are more important compared to parking of passenger cars

30
3557500 3560000 3562500 3565000 3567500 3570000 3572500
5927
500
5930
000
5932
500
5935
000
Annex 2aNoise ImissionIndustry: all relevant Companies (Detail level 2)DEN
NoMEPorts
04.06.20072006.187
HAMBURG PORT AUTHORITYNeuer Wandrahm 4
20457 Hamburg
1:15.000
P
0 10,5Kilometer A0
Legend
LDEN 55-dB(A)
Port Boundary
Buildings
Industrial Use
Noise ImissionIndustry: all relevant CompaniesDEN
<= 55 dB(A)
> 55 - 60 dB(A)
> 60 - 65 dB(A)
> 65 - 70 dB(A)
> 70 - 75 dB(A)
> 75 - 80 dB(A)
> 80 - 100 dB(A)
Maßstab:
Projekt:
Planinhalt:
LÄRMKONTOR GmbH
Altonaer Poststraße 13 b 22767 HamburgTel.: 040 - 38 99 94.0 Fax: 040 - 38 99 94.44mail: [email protected]://www.laermkontor.de
Figure 13: Port of Hamburg – Industrial noise sources (Lden)

31
3557500 3560000 3562500 3565000 3567500 3570000 3572500
5927
500
5930
000
5932
500
5935
000
Annex 4a:Noise ImissionRoads (Detail Level 4)DEN
NoMEPorts
04.06.20072006.187
HAMBURG PORT AUTHORITYNeuer Wandrahm 4
20457 Hamburg
1:15.000
i
0 10,5Kilometer A0
Legend
LDEN 55-dB(A)
Port Boundary
Buildings
Roads
Noise ImissionRoadsDEN
<= 55 dB(A)
> 55 - 60 dB(A)
> 60 - 65 dB(A)
> 65 - 70 dB(A)
> 70 - 75 dB(A)
> 75 - 80 dB(A)
> 80 - 100 dB(A)
Maßstab:
Projekt:
Planinhalt:
LÄRMKONTOR GmbH
Altonaer Poststraße 13 b 22767 HamburgTel.: 040 - 38 99 94.0 Fax: 040 - 38 99 94.44mail: [email protected]://www.laermkontor.de
Figure 14: Port of Hamburg – Road traffic noise (Lden)

32
3557500 3560000 3562500 3565000 3567500 3570000 3572500
5927
500
5930
000
5932
500
5935
000
Annex 5a:Noise ImissionRailways (Detail level 5)DEN
NoMEPorts
04.06.20072006.187
HAMBURG PORT AUTHORITYNeuer Wandrahm 4
20457 Hamburg
1:15.000
i
0 10,5Kilometer A0
Legend
LDEN 55-dB(A)
Port Boundary
Buildings
Railways
Noise ImissionRailwayDEN
<= 55 dB(A)
> 55 - 60 dB(A)
> 60 - 65 dB(A)
> 65 - 70 dB(A)
> 70 - 75 dB(A)
> 75 - 80 dB(A)
> 80 - 100 dB(A)
Maßstab:
Projekt:
Planinhalt:
LÄRMKONTOR GmbH
Altonaer Poststraße 13 b 22767 HamburgTel.: 040 - 38 99 94.0 Fax: 040 - 38 99 94.44mail: [email protected]://www.laermkontor.de
Figure 15: Port of Hamburg – Railway noise (Lden)

33
Lden map
All sources
Figure 16: Port of Livorno - All sources (Lden)

34
Lden map
Detail level 1 – Road traffic
Figure 17: Port of Livorno – Road traffic noise (Lden)

35
Lden map
Detail level 2 – Railroad traffic
Figure 18: Port of Livorno – Railway traffic noise (Lden)
36
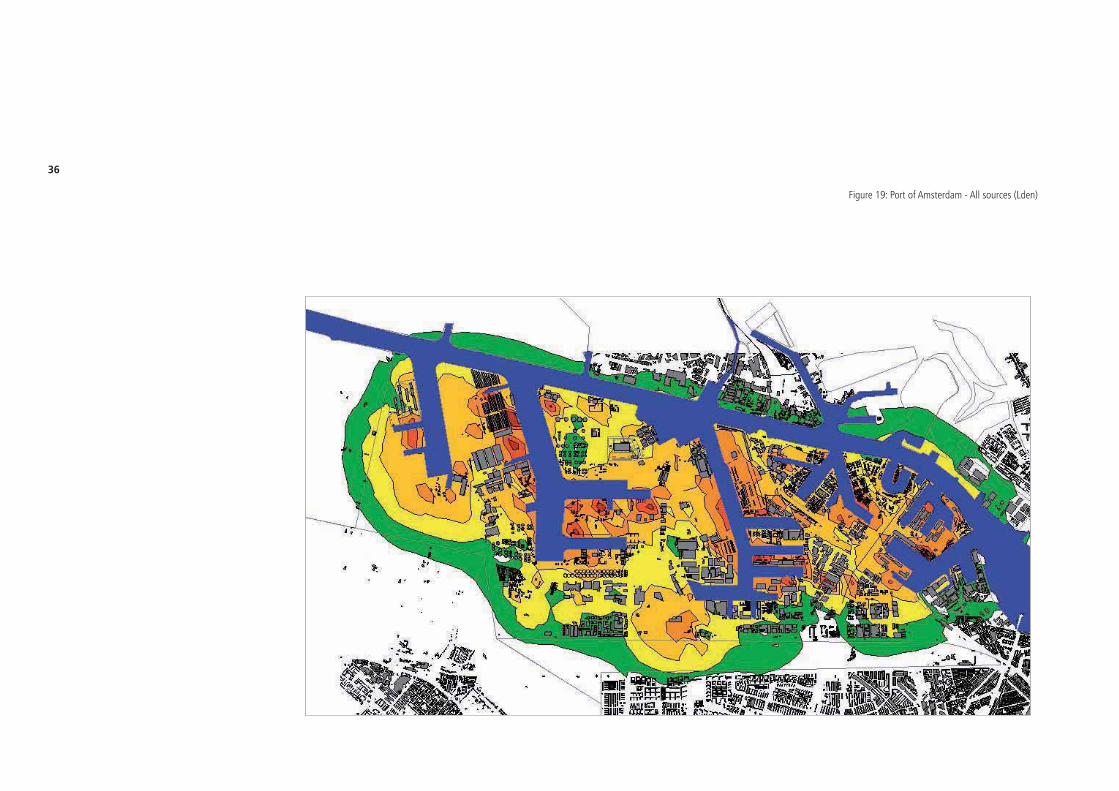
Figure 19: Port of Amsterdam - All sources (Lden)

37
Figure 20: Port of Amsterdam – Road traffic noise (Lden)

38
Figure 21: Port of Amsterdam – Railway noise (Lden)

39
4.1. IntroductionNoise management is an ongoing, systematic and documented way to handle the impacts of noise on people and the environment in or around a company, or a geographic area. The purpose of noise man-agement is to prevent such impacts in the first instance or to reduce the negative impact that such noise may have on a community and its surroundings. The development of action plans and their implemen-tation are the key components of effective noise management. The main benefits of implementing a noise management programme in port areas include:
It is evident that cost-effectiveness is an important issue when per-forming noise management, and to calculate costs and benefits of possible solutions should be an integrated part of noise manage-ment. From this, the best possible environmental performance can be achieved at the lowest possible costs, and a cost-benefit analysis demonstrates which solutions should be carried out.
A more comprehensive description of the steps to take in the noise management cycle is explained in the sections below.
4.2 Analysis of noise mapsAn important tool for action planning is the setting up and analysis of noise maps for the area in question. The analysis may offer decision makers the necessary decision support tools in order to formulate and justify the noise action planning (figure 22). The analysis embraces three main components: (1) the identification of hot spots and prob-lem areas of interest, (2) the identification of the most significant noise sources (both group and individual sources), and (3) the estimation of the number of people exposed in certain noise classes for e.g. LDEN and LNight (by groups of noise sources and/or overall). For each of these components, generic methodologies and relevant guidelines are presented below. Examples of good practices are highlighted where necessary.
Chapter 4: Noise management
Table 11: Benefits of implementing a noise management programme• Cost savings through the prevention of a negative (environmental) influence
from port-city planning on the prospects for the optimum functioning of the port
• Cost savings through prevention of future negative environmental influence of port development by having available evidence to support planning applications for port development
• Better control of production and optimization of port area planning• Enhanced environmental quality of the port surroundings • Greater transparency and, therefore, greater potential for acceptance by the
public of the need for development of the port and its associated industrial activities
• Additional instrument to imporve the working environment by raising awareness of safety, health and environmental issues amongst employees

40
4.2.1 Screening for noise source significanceThe process of screening for the significance of noise sources refers both to the identification of the relative importance of groups of noise sources such as industry, port terminals operations, roads, railways and ship movements (including those at berth) and the identifica-tion of the significance of single sources (e.g. individual company, specific activity, specific road). As “significant noise sources” can be defined the sources that contribute highly on the environmental noise levels, on a number of positioned sensitive receivers. The significant sources can be identified by examining the resultant noise levels at those receivers. For example, receivers can be placed near housing areas around the industrial area where the highest noise levels occur. Depending on the noise mapping programme, group results can be displayed for these receivers as well as the individual sources. This will give the information on the noise source significance. These results might also be visualized by displaying contours.
4.2.2 High priority areasIt can be argued that the identification of high priority areas is port area specific. It requires a good local knowledge of the peculiarities of the area under study and a sensitivity analysis of the included sub-are-as. A high priority area can broadly be defined as a critical point where noise indicators reach the highest values and/or the effect of noise on sensible receptors is significant. Identifying such areas requires com-bining information on noise levels with the number of people that are affected. There is still scientific debate on the evaluation of the combined data. For example, is it worse having 10 people exposed to 70 dB or 100 people exposed to 60dB?
Two examples of priority areas identification in the Ports of Livorno and Amsterdam are highlighted below.
Noise mapping and modeling
outcomes
Analysis
- Hot spots- Significant
noise sources- People affected
Input to noise action
planning
Figure 22: Analysis of noise maps

41
• The spots 1 and 2 are related to the noise emission of industries, liquid terminal and heavy traffic. Despite the high noise values observed, both spots are very distant from the urban context and their contribution to the general acoustic situation is very small. Noise values at spot 3 are mainly influenced by terminal activities (solid bulk and forestry products).
• Spot 4 is particularly interesting because of the presence of port activities near to the city. The noise impact is mainly due to the berthed ships and road traffic. The spot is also of interest because of its LNight observed values (50-55 dB(A) that reach the noise
Identification of High priority areas - Livorno port area example
The figures present the LDEN (left figure) and LNight (right figure) noise maps of the Livorno port area highlighting the identified priority areas.
The priority areas were identified based on two criteria; (1) areas were noise indicators reach their highest values (spots 1, 2 and 3), and (2) sensitive areas were significant noise levels are observed (spots 4 and 5). The following remarks can be further made on the significance of each of the identified priority spots:
limit of 55 dB(A) which is imposed by the present Italianlegislation.
• Noise values at spot 5 are almost entirely dependent on roadtraffic. The traffic in that zone consists of light traffic to and from the passenger station, and light traffic related to accessing andgetting out of the city centre. The nightly contribution of thepassenger station is lower than the daily one because of the lower boarding and landing frequency.
• High priority areas 4 and 5 can be then characterized as “hot spots” within the port area of Livorno
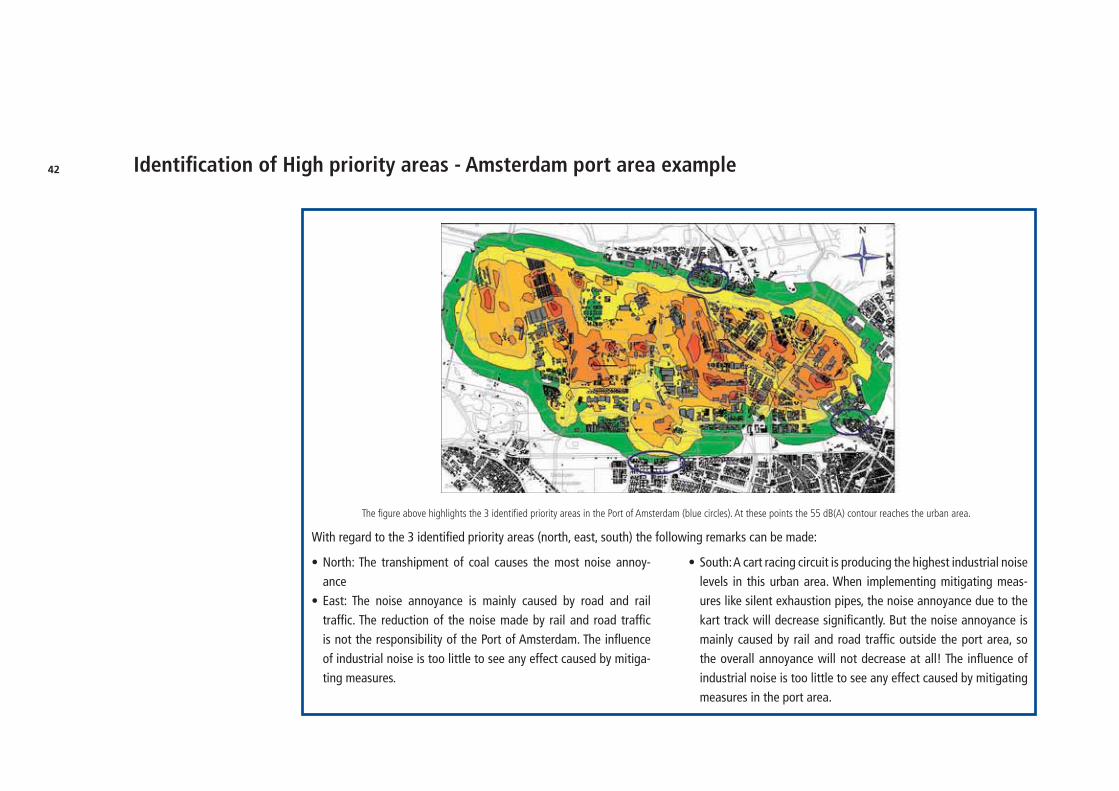
42 Identification of High priority areas - Amsterdam port area example
• North: The transhipment of coal causes the most noise annoy-ance
• East: The noise annoyance is mainly caused by road and rail traffic. The reduction of the noise made by rail and road traffic is not the responsibility of the Port of Amsterdam. The influence of industrial noise is too little to see any effect caused by mitiga-ting measures.
The figure above highlights the 3 identified priority areas in the Port of Amsterdam (blue circles). At these points the 55 dB(A) contour reaches the urban area.
• South: A cart racing circuit is producing the highest industrial noise levels in this urban area. When implementing mitigating meas-ures like silent exhaustion pipes, the noise annoyance due to thekart track will decrease significantly. But the noise annoyance ismainly caused by rail and road traffic outside the port area, sothe overall annoyance will not decrease at all! The influence of industrial noise is too little to see any effect caused by mitigating measures in the port area.
With regard to the 3 identified priority areas (north, east, south) the following remarks can be made:

43
4.2.3 Number of people affected The calculation of the number of people affected by noise in a port area usually requires the use of specialized software or general soft-ware such as GIS that have the ability to synthesize the results of the noise mapping process with information regarding the number of inhabitants in different areas on the noise maps. The general picture in terms of input requirements and output of such software is presented in the following figure.
4.2.4 General principles of noise planningNoise may limit the cost-effective utility of an area due to enforced limitations of the activity when noise limits are reached and people
are affected. Change of present or introduction of new activities may cause bottlenecks to a planned development. Bottlenecks are for ex-ample residential areas nearby the port industrial area. However, fu-ture residential areas or new quiet areas can cause new bottlenecks.
Noise management has to deal with future potential conflicts between the continued city developments in areas close to commercial port ac-tivities and it also opens the possibility for optimisation of both the city development and the port activities. Already affected spots and future conflict areas can be made visible by creation of noise maps. Currently affected sites and potential future areas of conflict can be identified from noise maps where the graphic imagery of the noise maps can be particularly useful in focussing attention on problem locations. The best way to avoid bottlenecks and future conflicts between residential areas and the port activities is to keep the activities clearly separated and at an appropriate distance from each other, even in long-term planning. Noise sources which may cause future conflict may be the subject of a plant moved to another place in the port – preferably with a long-term notice to optimize return of investments made.
4.3 Noise mitigationThere are three main options for reducing the noise distribution: • Source measures• Propagation measures and• Receiver measures.
SpecialisedSoftware or GIS
Output
• Number of people exposed in certain
classes of noise from different groups of
noise sources (industry,road, rail, ships)
Input
• Noise maps and noise level predictions by different groups of
noise sources (industry, road, rail, ships)
• Database containing the number of inhabitants per dwelling or area
Figure 23: Calculation of the number of people affected by noise

44
4.3.1 Source mitigating measuresSource mitigating measures are the first choice, as they reduce or eliminate noise directly at the source. For example, in terminals the main sound sources are cargo handling equipment, trains, trucks and ships at berth. In port industrial areas a sound source can also be a plant. Usually, the operator is responsible for the source mitigating measures (e.g. cranes, conveyers, straddle carriers) at the terminals and in port industrial areas also at plants. The operator and the port authority usually have no influence on other sound sources such as trucks, trains and ships. Land-based sources such as trains and trucks are generally addressed through city planning or at higher, strategic planning levels, and ship noise through area planning and through technical solutions decided globally by international organisations such as IMO (International Maritime Organization).
Noise can be caused for different reasons and by different compo-nents. In order to determine effective source mitigating measures it is recommended to carry out technical sound measurements by an acoustical expert. With regard to terminal equipment, the first step is to carry out measurements at a defined distance to the equipment in order to measure the main operation states such as lifting, lowering, driving and idling. With these measurements it is possible to calculate the entire sound power level of the equipment and the operations state with the main influence.
Example: If the operation state “driving” has the most influence to the sound power level of a Straddle Carrier, it is not necessary to reduce the sound emissions of the operation states lifting and lowering.
A second step may be needed to carry out technical sound measure-ments in the near field to single components of the equipment in order to reveal the components which cause most noise. Single com-ponent noise is usually the responsibility of the manufacturer of the particular type of machinery. To reduce sound emissions, the operator may demand and purchase equipment using low noise techniques. Furthermore, the time span of the single operation should be consid-ered when calculating the sound power level and noise mitigating measures because the entire sound power level depends on the sound intensity and how long the sound occurs.
Example: If putting down a container is at one moment of time, the loudest event, it doesn’t mean that this event also has the most significant influence on the entire sound power level of the equipment. The reason for this is because the noise of this operation is only there for some seconds and not like the operation ´driving´ 50 percent of the whole time.
Noise mitigating measures carried out on operations with significant noise influence on the surroundings should be given priority.

45
Example:Local residents were annoyed by the use of loudspeakers on cruise ships at berth. The cruise ship was requested not to use loudspea-
kers on the side towards the residential area and the noisiest ships were berthed away from residential quarters.
Table 12: Examples of source mitigating measures
Terminals and plants:
• Covering of sound intensive components with insulation • Use absorbing building materials
• Reducing structure-borne sound radiation • Silent equipment (low noise versions cost little extra)
• Reducing the speed of putting down a container and • Low noise driving (ECO-driving)
distance from surface of opening a bulk grab. • Follow up service of noise reduction
• Automatic positioning of the spreader • Avoid night-open terminal (Allow seaside activities,
• Tyre pressures but no land-operations with trailers through gates)
• Put source into a building or barriers around source • GPS of containers so you can reduce sound peaks
• Silent exhaustion pipes • Electricity in stead of diesel or diesel-electric moving equipment
• Planting trees as a barrier • Authority port can request the companies to insulate better their
sources (may act as both physical and perceived barrier) • Use water cooling instead of air cooling
• Use softer ground where activities allows (e.g. quiet asphalt)
Ships:
• Silent exhaustion pipes and ventilators • Prevent loud speakers at berth
• Supply ship-shore energy during berthing

46
Source sound mitigating measures cannot be described generally be-cause the appropriate measure depends on the single case. A choice of existing source mitigating measures is presented on the following table. Some of these measures can also be used to mitigate the sound of industrial plants.
4.3.2 Propagation measuresA propagation measure is a response that reduces the impact of noise during its path from source to receiver. Classically, this takes the form of a type of physical barrier that attenuates or deflects the noise trans-mission. Examples of various response options are summarized in the following table:
Additional considerations may take into account, for instance, a moni-toring system which measures the noise on the terminal as well as the residential area, and alerts the operator when the reference value is exceeded. The results of the measurements can be documented and evaluated regularly, and used to monitor and respond to complaints.
Another measure may be a training concept for the workers as well as for the management level to improve their sensitivity to noise and to explain how to reduce noise. Sound mitigation can be implemented as a separate topic in the team meetings on the terminal. Topics which could be discussed in the framework of a training concept are:
Table 13: Examples of propagation and organizational measures
•Overall port design-planning
•City planning (new residential areas)
•Infrastructure planning (roads, railways)
•Noise barriers, by bounding roads and rails
•Modelling expansion scenarios
•Use noise mapping software as a decision support tool
•Change working period
•Change in production and/or operations
•Accept more noise in a time period waiting for moving a company or new
technology
•Respect the speed limits inside the port area (setting up traffic speed
indicators)
•Turn the source so the noise will be directed away from residential areas
•Reduce transport distances
•New non residential buildings as barriers
•Yard planning, e.g. positioning of container racks so they can act as a barrier
•Relocation of most noisy activities
•Move the entrance gate away from residential areas
•Installing 24 hours noise measuring systems at residential areas (to locate
and document noise peaks)

47
• Basic principles of technical acoustics• Sources of noise• The effect of multiple sources of noise• Options for active noise mitigation in the port or terminal• Graphic presentations of the main sound sources and manage-
ment options via video- and audio recordings
Optimization of the infrastructure and terminal layout may also be a considered as a propagation measure. Noise can be avoided by reduc-ing the driving distances for the handling equipment or by planning noise optimized locations e.g. for cooling container racks and, if pos-sible, moving ships away from the residential areas.
4.3.3 Receiver measuresReceiver or passive measures may be used in residential areas that protect the inhabitants from noise pollution, especially during the night. Based on calculated or measured outside noise levels, passive noise control measures can be installed. Normally, passive measures will only be carried out if source and propagation measures are not sufficient to reduce the noise pollution in the residential areas.
4.4 Action Plans and future developmentBefore making an action plan it is important to set goals and objec-tives that will deliver short and long term policy ambitions. Questions related to the expected commercial profile, commodity mix, nature of tenant companies and the overall demands on space required need to be answered when planning for the future. These criteria will influence the options available to pursue planned economic growth within the specified noise limits. Optimization of land use commensurate with economic targets and commercial activities needs to be considered in the context of spatial planning for the effective designation of noise space for each company.
Table 14: Examples of receiver measures
• Setting up noise barriers between noise sources and dwellings
(e.g. screens and buildings)
• Increasing the insulation of existing houses
• • Sound insulating windows
• Noise mufflers on ventilators
• Decreasing of openings in existing housings
• Change attitude via communication
• Neighbourhood groups
• Introduce community to the port operations, e.g. bring inhabitants
into the port and explain about port operations
• Ensure proactive communication on changes/incidents/plans
• Contact person in the port to increase trust

48
Example: Scenario: Plan for large noise producers to locate or relocate away from present and future residential areas over 10 to 30 years pe-riod. Of course, the decision on whether and where to move com-mercial port activities is made on cost-benefit bases and is often depending on the length and content of lease contracts.
Negative effects can be minimised by: • Choosing the long-term right locations for the companies• Application of technical measures at the noise source (e.g. best
available technology)• Implementation of propagation and organisational measures (e.g.
noise barriers at the source, changing working hours)• Installation of passive measures in the residential (receiver) areas
(e.g. sound proof windows)
Summarised, the goals of noise management are to:• Identify ways of optimizing economic growth within the noise
limits• Reduce the impact of noise through technical or organisational
measures• Identify any potential conflicts between future city developments
in areas close to commercial port activities and identify theoptions for sustainable development
The main target of action planning is to reach a higher quality of life in cities and other adjacent settlements. Action planning is an important instrument within the noise management system to reduce noise ex-posure. Action planning aims to avoid potential health-affecting noise pollutions, to reduce noise annoyance and sleep disturbance to the inhabitants of communities.
Action plans are designed to manage noise issues and to reduce noise where necessary. Noise mitigating measures have to be built out in particular for the most important areas as established by the strate-gic noise mapping (Chapter 3.). The measures should notably address priorities which may be identified as those exceeding any relevant limit value.
According to the Environmental Noise Directive (2002/49/EC), action plans have to be drawn up by:• No later than 18 July 2008 for agglomerations with more than
250 000 inhabitants• No later than 18 July 2013 for all agglomerations with more than
100 000 inhabitants
Under the provisions of END, action plans shall be reviewed and re-vised if necessary, when a major development occurs affecting the existing noise situation, and at least every five years after the date of their approval. The public shall be consulted about proposals for action plans and given early and effective opportunities to participate

49
in the preparation and review of the action plans. The results of that participation should be taken into account and the public be informed on the decisions taken. Reasonable time-frames shall be provided al-lowing sufficient time for each stage of public participation.
In order to obtain an effective noise reduction, individual measures are usually not sufficient. Concepts which consist of different meas-ures and use different noise reduction potentials are more appropriate such as the combination of planning, technical, structural, formative and organizational measures. Preventive measures, generally acknowl-edged as being the most cost-effective, should be given priority.
The following table summarises selected elements of a noise action plan.
Each action plan should contain estimates in terms of the reduction of the number of people affected (annoyed, sleep-disturbed, or other). For border regions, neighbouring Member States shall cooperate on the action plans.
4.5 Dissemination to the public
4.5.1 IntroductionAccording to the Environmental Noise Directive (2002/49/EC), the information and participation of the public is required when setting up action plans for noise mitigation. According to Article 8 of END,
Table 15: Elements of an action plan
• A description of the agglomeration and the noise sources taken into account
• The authority responsible
• The legal context
• Any limit values in place
• A summary of the results of the noise mapping
• An evaluation of the estimated number of people exposed to noise,
identification of problems and situations that need to be improved
• • A record of the public consultations
• Any noise-reduction measures already in force and any projects in
preparation
• Actions which the competent authorities intend to take in the next five years
including any measures to preserve quiet areas
• Long-term strategies
• Future developments in the port area
• Future developments outside the port area (residential and quiet areas
being planned closer to the port)
• Financial information (if available) of budgets, cost-effectiveness
assessment, cost-benefit assessment
• Provisions envisaged for evaluating the implementation and the results of
the action plan.

50
“Actions plans” and Article 9, “Information to the public” the public must be informed in time and given the opportunity to take part in the elaboration and reviewing of the action plans. The authorities have to take into consideration the results of the participation, and they have to inform the public in respect to the decisions taken. In all phases of information and participation “reasonable periods of time” have to be regarded. Also, the results of the participation have to be put on record afterwards.
Noise mitigation planning is normally a long-term process. Recogni-tion of community views promotes the effects and output of planned measures and also encourages the authorities involved. The objective of an accompanying communication process is to inform the public about what is going on from the very beginning of the planning process and to give them the chance to participate before final decisions are made.Experience shows that acceptance of policies and measures are much higher when residents who will be inflicted by the measures have been informed at a very early stage about the objectives, the range and the importance of these measures.
Example:Purchasers of apartments in a new building very near a cruise berthing quay were informed that there would be ship noiseduring ship berthing during summer season. There have been no complaints afterwards from the residents concerned.
Also the “everyday knowledge” of residents about their residential area can be helpful in giving local information to planners. Many prob-lems can be prevented through the dialogue, and the views obtained from neighbours may even improve the solutions that are chosen for noise control.
It is essential in the dialogue with stakeholders that the rules and conditions for the dialogue are precisely defined – time plan, level and details of information, who takes which decisions, etc. This calls for transparency and for commitment. Is the public being passively informed, or are port authorities asking for views, advice and opinion, and if so, what are you doing with it? Expectations must be fulfilled if the dialogue is to succeed, so expectations should be realistic.
Example:It is published in the local newspapers that the port is working on a noise management plan and that interested parties or neighbours may obtain a copy. Furthermore, a public meeting is announced where the draft plans will be described and where views andopinions on the plan can be expressed.
4.5.2 Informing the PublicThere are various ways of publicizing the intention to develop a noise action plan. These include:• TV and radio• Journalists and other media

51
• Direct mail• Announcement of public meetingWhereas information on noise issues is often perceived as a negative message, it can be turned into something more positive by including an invitation to take part in an opening ceremony, public debate, or an equivalent event.
A web-based home page can be used as a supporting instrument for communication in the course of the planning process to inform the community and other stakeholders about:• Announcements of dates and meetings• Legal regulations of noise mitigation planning• Examples, “best practice”• The procedures to be followed during noise reduction planning• Essential technical terms and principles involved• Records of meetings and associated support information
Public meetings (e.g. an “open house” arrangement) can be a very positive way of showing the public what takes place in a port and it can be used also to disseminate information about future develop-ments. However, public meetings are a challenging way of informing the public, calling for response and thus inviting to dialogue and par-ticipation. The course of a public meeting can be less predictable so other means for involving of the public may be preferred.
4.5.3 Participation of the publicThere are different kinds of structures possible for giving the pub-lic/stakeholders the possibility to take part in the elaboration of the action plans. A preliminary step is to define “the public”. The noise directive defines “public” as one or more natural or legal persons, and associations, organisations or groups of these persons. It seems sensible to differentiate between informing the public of the whole area and giving the opportunity of taking part to special groups or representatives.
Advisory boards:Advisory boards usually consist of invited representatives of different social groups such as the political representatives, police, fire depart-ment, citizens’ initiatives, environmental associations, local adminis-trators, churches, schools or others who are affected by ongoing plan-ning processes. The advisory board meets regularly to discuss current conditions, specific cases or incidents and results of noise mitigation planning so far.
Workshops:Workshops can be either public or selective with invited representa-tives. This mode of participation is especially suited to discuss or to develop solutions and proposals for a particular area or aspect.
Public information events:Such events address the public of a city district or a specific municipal
52
quarter. Public events are recommended at the beginning of, and cer-tainly at the completion of a noise reduction planning process.
4.6 Evaluation of Action Plans
4.6.1 Consideration of future developments Noise mitigating measures are relevant to the general situation but particularly to the case of port and city planning where noise manage-ment could prevent future non-compliance through an evaluation of new noise impact on the sensitive receptors (new noise sources or new residential areas). Noise management should thus be regarded as a part of the larger environmental management system (EMS). The strength of this methodology is that all the actions of a manage-ment process, from the design to the implementation of the various noise mitigating actions, can be held under control by the use of a monitoring system.The following topics should be taken into account by the organisation responsible:• The final goal could be gained through some intermediate imple-
mentation steps• Legal requirements or other requirements to which the organi-
zation subscribes should be taken into account. It should alsoconsider its technological options, its financial, operational and business requirements and the views of interested parties
• Designation of responsibility and a time frame should beincluded
Once the measure is implemented, two important tasks to face are (1) the operational control and (2) the monitoring of effects.
The organization should establish specific procedures related to the use of and/or servicing the noise mitigating measure. Their absence could lead to deviation from the conditions on the basis of which the environmental study was carried out. A specific monitoring plan should be implemented. The organization should monitor and meas-ure, on a regular basis, the key environmental and social impacts of the measure implemented. The plan should allow for taking all the actual effects that the measure effectively has on the environment and population into consideration. Unwanted or unforeseen effects should be recorded by the monitoring task so that the organization responsible for the implementation of the noise mitigating measure can have the opportunity to evaluate a need for corrective actions (e.g. re-engineering of the project, other mitigating measures, etc.).
When the port authority plans future expansions or port area re-con-version, the noise management should be taken into account as well. Since many of the noise sources depends on traffic volumes (e.g. road, railway, vessel traffic, container movement, etc.) even the expansion of cargo volumes could cause an increase in the noise propagated.
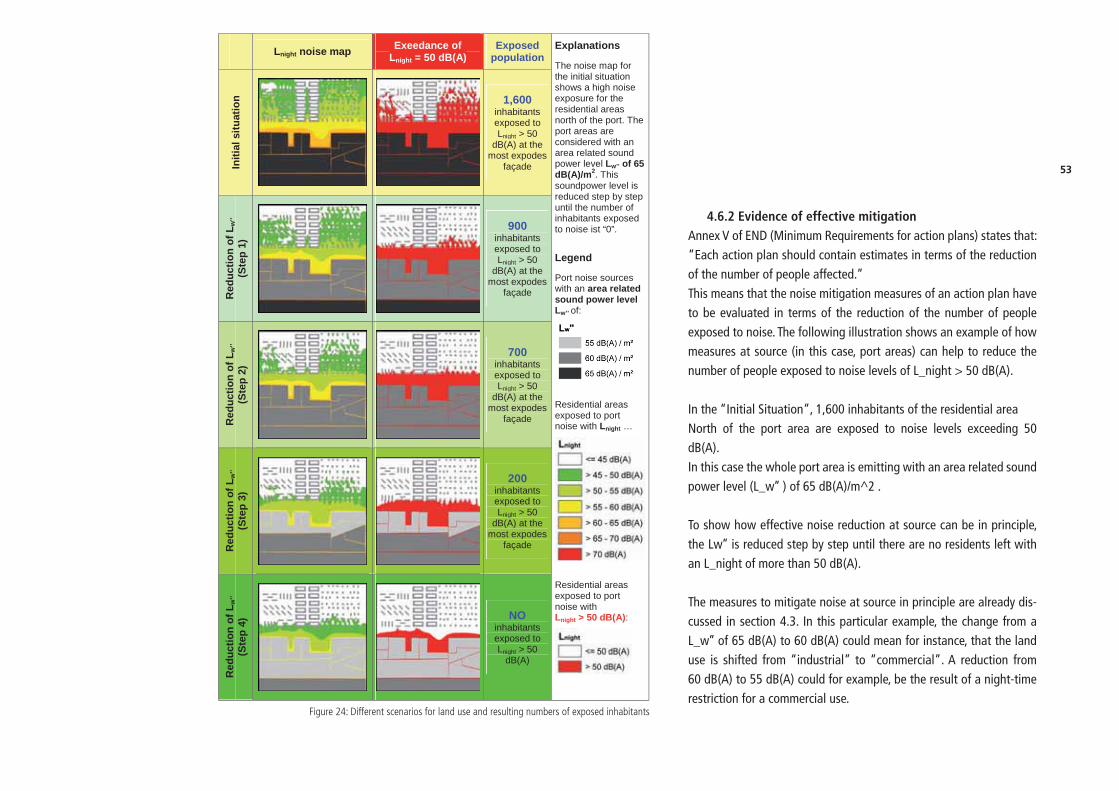
53
4.6.2 Evidence of effective mitigationAnnex V of END (Minimum Requirements for action plans) states that: “Each action plan should contain estimates in terms of the reduction of the number of people affected.”This means that the noise mitigation measures of an action plan have to be evaluated in terms of the reduction of the number of people exposed to noise. The following illustration shows an example of how measures at source (in this case, port areas) can help to reduce the number of people exposed to noise levels of L_night > 50 dB(A).
In the “Initial Situation”, 1,600 inhabitants of the residential area North of the port area are exposed to noise levels exceeding 50 dB(A). In this case the whole port area is emitting with an area related sound power level (L_w’’ ) of 65 dB(A)/m^2 .
To show how effective noise reduction at source can be in principle, the Lw’’ is reduced step by step until there are no residents left with an L_night of more than 50 dB(A).
The measures to mitigate noise at source in principle are already dis-cussed in section 4.3. In this particular example, the change from a L_w’’ of 65 dB(A) to 60 dB(A) could mean for instance, that the land use is shifted from “industrial” to “commercial”. A reduction from 60 dB(A) to 55 dB(A) could for example, be the result of a night-time restriction for a commercial use.
Lnight noise map Exeedance of Lnight = 50 dB(A)
Exposedpopulation
Init
ial s
itu
atio
n 1,600inhabitants exposed to Lnight > 50
dB(A) at the most expodes
façade
Red
uct
ion
of
Lw
’’
(Ste
p 1
)900
inhabitants exposed to Lnight > 50
dB(A) at the most expodes
façade
Red
uct
ion
of
Lw
’’
(Ste
p 2
)
700inhabitants exposed to Lnight > 50
dB(A) at the most expodes
façade
Red
uct
ion
of
Lw
’’
(Ste
p 3
)
200inhabitants exposed to Lnight > 50
dB(A) at the most expodes
façade
Red
uct
ion
of
Lw
’’
(Ste
p 4
) NOinhabitants exposed to Lnight > 50
dB(A)
Explanations
The noise map for the initial situation shows a high noise exposure for the residential areas north of the port. The port areas are considered with anarea related sound power level Lw’’ of 65 dB(A)/m2. This soundpower level is reduced step by step until the number of inhabitants exposed to noise ist “0”.
Legend
Port noise sources with an area related sound power levelLw’’ of:
Residential areas exposed to port noise with Lnight …
Residential areas exposed to port noise with Lnight > 50 dB(A):
Figure 24: Different scenarios for land use and resulting numbers of exposed inhabitants

54
4.6.3 Polluter pays principlePolicy making of environmental protection often stresses the impor-tance of the “polluter pays principle”. The principle is readily under-stood and generally accepted as being the best political tool to reduce unwanted environmental effects of industrial activity. However, it is approached in different ways between the individual European States, and thus it is difficult to generalize on its interpretation and implemen-tation. It is quite easy to determine a production plant or port terminal operations a noise polluter. When a company wants to expand and it leads to higher noise levels and more noise annoyance in residential areas the owner of the company and of the industrial estate are the noise polluters. When a new residential area is planned, the owner/developer of the area must take into consideration the known exist-ing sound picture. This may result in a reduction of use of the area for residential purpose or part of the profit gained from developing the new land may have to be used to pay for the costs of noise mitigat-ing measures at the companies or even moving companies producing noise to another area away from the development area.
Projects on occupation of new areas or port area re-conversion, either on the sea or on the mainland, should be developed carefully taking into accounts the three “pillars” that drive such programmes i.e. eco-nomic, social and environmental needs. An environmental impact as-sessment (EIA) and as part of this – a noise impact assessment (NIA) - could be a tool, voluntary or requested by local or national regula-tions, to take into account the environmental and the social topics.
The most effective way to carry out a NIA is to produce strategic noise maps in order to simulate the new land or sea use and the noise ef-fects on the surroundings.
The noise model developed is a resource for the port authority. Once the noise model of the port or of a significant part of it is done, it could be used to predict any change in the of the port organization or logis-tic. The technical details to set up a noise model are reported in the Chapter 3 of this guide and in the technical annex of the Project.
4.7 Review of current action and future plansMost port authorities have a long term (10-20 years) port develop-ment plan. Furthermore, investments in buildings, quays and terminals often plan 30-50 years, or more, ahead. It is thus important to make an ongoing interaction between the various planning levels i.e. port planning, regional infrastructure planning, and city-planning in order to prevent potentially expensive mistakes and to reduce the need for relocation of companies.
A good methodology in noise management is to translate the future port planning into a noise allocation map. In this map, a noise budget should be allocated to each plot of land according to the foreseen or actual use. Noise levels calculated must be within legal limit values and/or any agreement with the local authorities. Levels that are too high indicate that the future port planning should be adjusted or miti-gation measures should be considered.

55
The noise allocation map should be the outcome of a process between all stakeholders, and adopted by the economic department of the port authorities and representatives of the local municipality. All stake-holders must agree on this map and the noise levels. The implications of the noise allocation map should be applied if the port planning is to be changed and the noise levels/contours calculated with the future acoustical model should be used for city planning purposes.
4.7.1 Principles for reviewing the measures takenIt is important to monitor the acoustical situation for the following reasons:• To demonstrate to the citizens that the port is operating according
to the agreed noise levels and that measures have been imple-mented.
• To show the port authorities (commercial department) that enough noise budget is still available for the development of the port according to the long term (commercial) planning
• To confirm whether or not the noise budget on the leased plots is being fully used. This can give an opportunity to reallocate noise budget (if necessary).
The review of the measures taken can take several years due to the following:• The future port plan will differ from the actual, current situation
and will not be reached for 10-20 years. • The measures will take time (and money) to be implemented• The effect of a single measure will not be discernible or have major i
impact in most cases
It is useful to monitor and review the measures and noise levels on a regular basis using two types of acoustical model:1. a model based on he future noise allocation map 2. a model representing the actual (permitted) situation
Figure 25: Example of noise of a allocation map
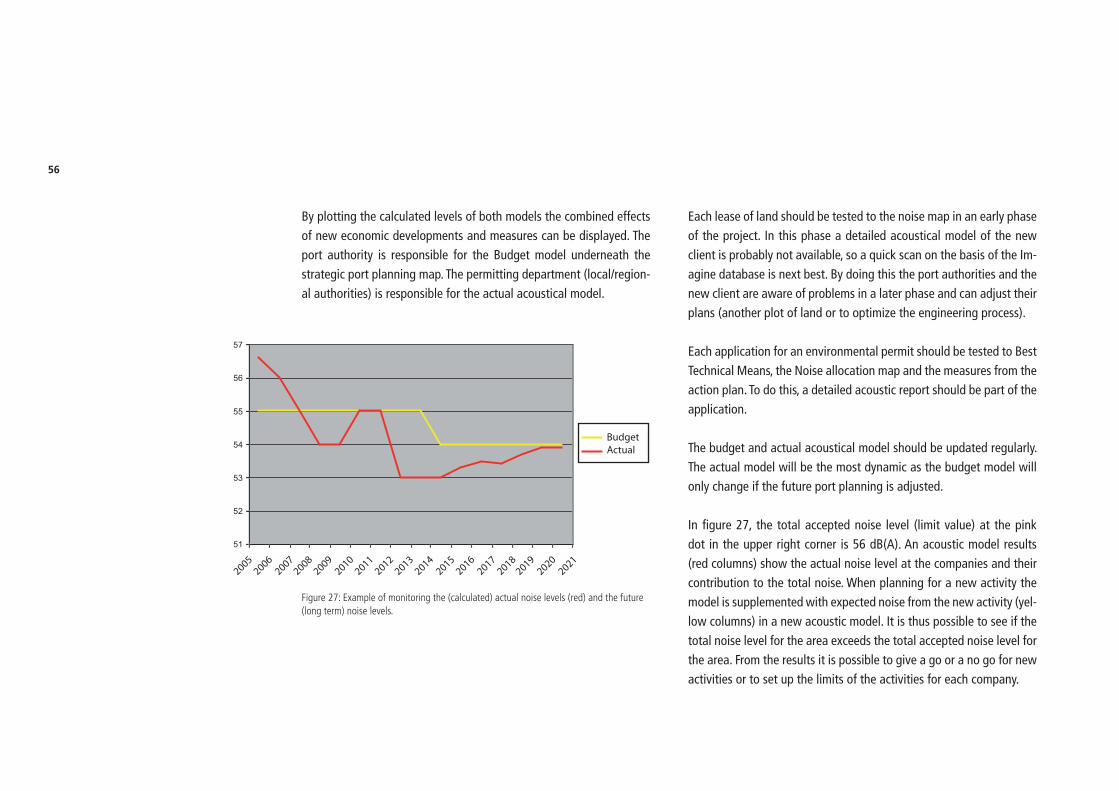
56
By plotting the calculated levels of both models the combined effects of new economic developments and measures can be displayed. The port authority is responsible for the Budget model underneath the strategic port planning map. The permitting department (local/region-al authorities) is responsible for the actual acoustical model.
Each lease of land should be tested to the noise map in an early phase of the project. In this phase a detailed acoustical model of the new client is probably not available, so a quick scan on the basis of the Im-agine database is next best. By doing this the port authorities and the new client are aware of problems in a later phase and can adjust their plans (another plot of land or to optimize the engineering process).
Each application for an environmental permit should be tested to Best Technical Means, the Noise allocation map and the measures from the action plan. To do this, a detailed acoustic report should be part of the application.
The budget and actual acoustical model should be updated regularly. The actual model will be the most dynamic as the budget model will only change if the future port planning is adjusted.
In figure 27, the total accepted noise level (limit value) at the pink dot in the upper right corner is 56 dB(A). An acoustic model results (red columns) show the actual noise level at the companies and their contribution to the total noise. When planning for a new activity the model is supplemented with expected noise from the new activity (yel-low columns) in a new acoustic model. It is thus possible to see if the total noise level for the area exceeds the total accepted noise level for the area. From the results it is possible to give a go or a no go for new activities or to set up the limits of the activities for each company.
51
52
53
54
55
56
57
20052006
20072008
20092010
20112012
20132014
20152016
20172018
20192020
2021
BudgetActual
Figure 27: Example of monitoring the (calculated) actual noise levels (red) and the future (long term) noise levels.

57
Existing companies may have permit to higher noise levels than the actual noise level (plot y, yellow coloumn), to cover future rise in the activity level. The permit level should be taken into consideration when planning new activities, so the total accepted noise level is not exceeded at the receiver point (pink dot) when the activities from the plot y company rise.
Figure 27: Example of the principles of noise management with two acoustical models.
2. Budget noise level (area planning)
1. Actuel noise level
66 68
67Plot x
Plot y
Emission, dB(A)/m2
Immission, dB(A)
y y
x
rest rest
Limited value, e.g. 56 dB(A)

58

59Chapter 5: Conclusions and recommendations
Generic and strategic conclusions• Port areas are major nodes in the logistic chain and important eco-
nomic centres in their own right. As the managing bodies of port areas, port authorities show an increasingly proactive approach to sustainable port development covering many environmental topics including that of industrial noise. Sustainable development needs cost effective and practical tools. The NoMEPorts project developed a protocol for noise management. This approach as-sists in noise mapping, action planning and noise management. It provides the authorities with the information that is needed to play their leading role in stimulating the tenants in the port area to carry out their port, transport and industrial operations in a more sustainable manner. It also provides the instrument to act in a proactive way for instance on new residential activities outside the port area that could restrict developments within the port area and therefore could influence the economic growth of the port. The noise management instrument can assist port authorities to take the lead in getting all relevant information available in the decision making process on new activities outside the port area by using the noise mapping and action planning for port areas.
• Fundamental to the project was the imperative to take a generic, harmonized approach to data collection and to produce a set of guidelines for response options to the challenges of noise man-agement that are transferable to the wider port community.
• The Six-Steps-Methodology for noise management in port areas outlines principles and offers practical guidance to port profession-als and managers. At the same time, this methodology contributes to the creation of a level playing field in ports in implementing the Noise Directive.
• The Guide is made by ports, for ports, and therefore incorporates good practice experience from strategy as well as operations.
• The principle approach of this Guide can also be applied to other industrial areas.
Recommendations to EC:• To formally adopt this good practice guide as a practical tool of
the Environmental Noise Directive for the implementation of in-dustrial noise in agglomerations.
• To continue encouraging the further development of harmonized noise calculation methods and approaches especially those fo-cused on strategic noise mapping, action planning and noise man-agement.
Operational• Noise mapping has proved to be a valuable tool allowing port
managers not only to assess the current noise situation in the port, but also to examine the potential impact of future development plans of the port itself and its surroundings.

60
When future developments outside the port area are also incorpo-rated into the noise model, prediction of future noise impact can be made very easily for new residential areas. This provides the port authorities with crucial information for port development and planning applications.
• Benefits of effective noise management include:• Cost savings through the prevention of a negative (environmen-
tal) influence from port-city planning on the prospects for the op-timum functioning of the port
• Cost savings through prevention of future negative environmen-tal influence of port development by having available evidence to support planning applications for port development
• Better control of production and optimization of port area plan-ning
• Enhanced environmental quality of the port surroundings • Greater transparency and, therefore, greater potential for accept-
ance by the public of the need for development of the port and its associated industrial activities.
• Additional instrument to improve the working environment by raising awareness of safety, health and environmental issues amongst employees.
ColofonEditorial BoardMr. Ton van Breemen, Port of Amsterdam, AmsterdamMr. Christian Popp, Lärmkontor GmbH, HamburgIr. Rob Witte, DGMR Consultants, The HagueMr. Frank Wolkenfelt, Port of Rotterdam, RotterdamDr. Chris Wooldridge, Cardiff University, Cardiff
AddressPort of AmsterdamAttn: NoMEPortsP.O.Box 194061000 GK AMSTERDAMhttp://nomeports.ecoports.com
PrintingJubels bv
Print quantity1250
April 2008
The knowledge, information or data contained in the present document is used at the exclusive risk of the user. The liability of the European Community, the Central Commission and its Secretariat cannot be involved in the event of use of the knowledge information or data contained in the present document nor the resulting consequences. The present document does not constitute in official undertaking in the part of the Commission.
The information contained in this publication has been carefully checked. However NoMEPorts cannot be held responsible for any claims following inaccurate information.

2
Port of Amsterdam P.O. Box 19406 1000 GK Amsterdam The Netherlands


