56
1 Green Remediation: Opening the Door to Field Use Session B (Green Remediation Tools and Examples) December 16, 2008 Carlos Pachon U.S. EPA Superfund Program [email protected]
| Date post: | 24-Dec-2015 |
| Category: |
Documents |
| Upload: | lewis-caldwell |
| View: | 218 times |
| Download: | 0 times |
1
Green Remediation: Opening the Door to Field Use
Session B (Green Remediation Tools and Examples)
December 16, 2008
Carlos Pachon
U.S. EPA Superfund Program
2
What is Green Remediation?
The practice of considering all environmental effects of a cleanup during each phase of
the process, and incorporating strategies to maximize net environmental benefit of the
cleanup.
Focus is on remedy implementation vs. remedy selection
3
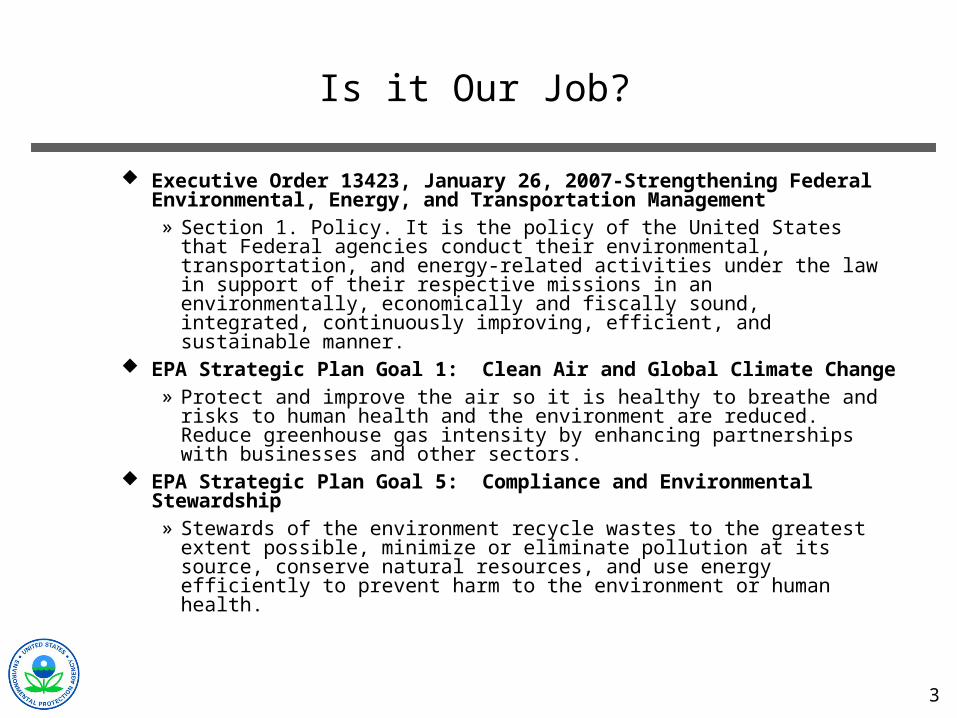
Is it Our Job?
Executive Order 13423, January 26, 2007-Strengthening Federal Environmental, Energy, and Transportation Management» Section 1. Policy. It is the policy of the United States that Federal
agencies conduct their environmental, transportation, and energy-related activities under the law in support of their respective missions in an environmentally, economically and fiscally sound, integrated, continuously improving, efficient, and sustainable manner.
EPA Strategic Plan Goal 1: Clean Air and Global Climate Change» Protect and improve the air so it is healthy to breathe and risks to
human health and the environment are reduced. Reduce greenhouse gas intensity by enhancing partnerships with businesses and other sectors.
EPA Strategic Plan Goal 5: Compliance and Environmental Stewardship» Stewards of the environment recycle wastes to the greatest extent
possible, minimize or eliminate pollution at its source, conserve natural resources, and use energy efficiently to prevent harm to the environment or human health.
4
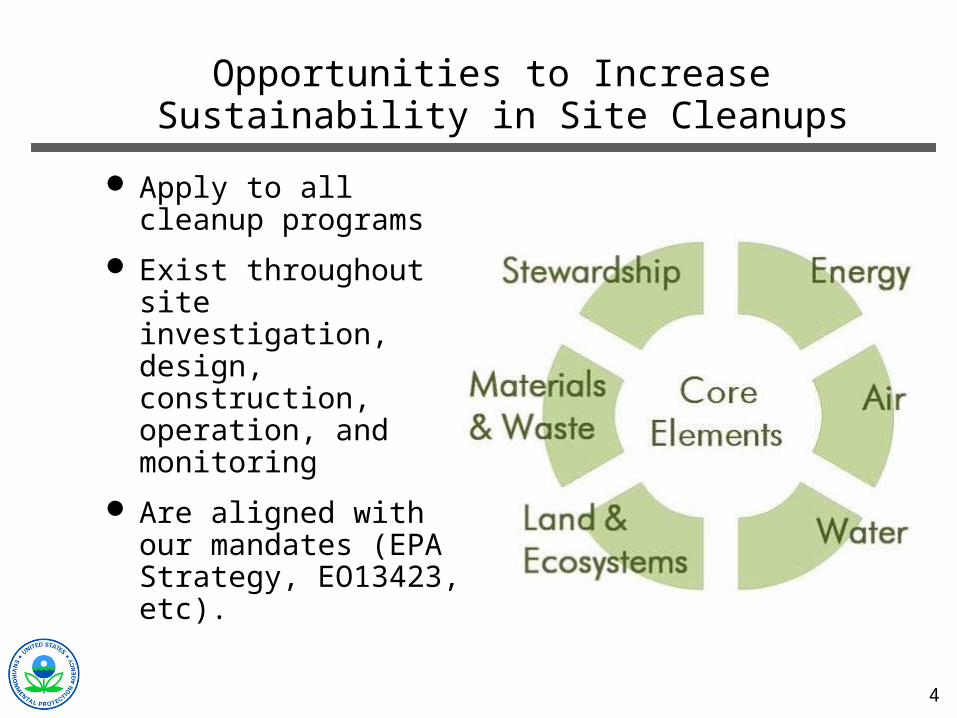
Opportunities to Increase Sustainability in Site Cleanups
Apply to all cleanup programs
Exist throughout site investigation, design, construction, operation, and monitoring
Are aligned with our mandates (EPA Strategy, EO13423, etc).
5
Core Elements: Energy Requirements
Energy efficient equipment operating at peak performance
Periodic evaluation and optimization of equipment with high energy demand
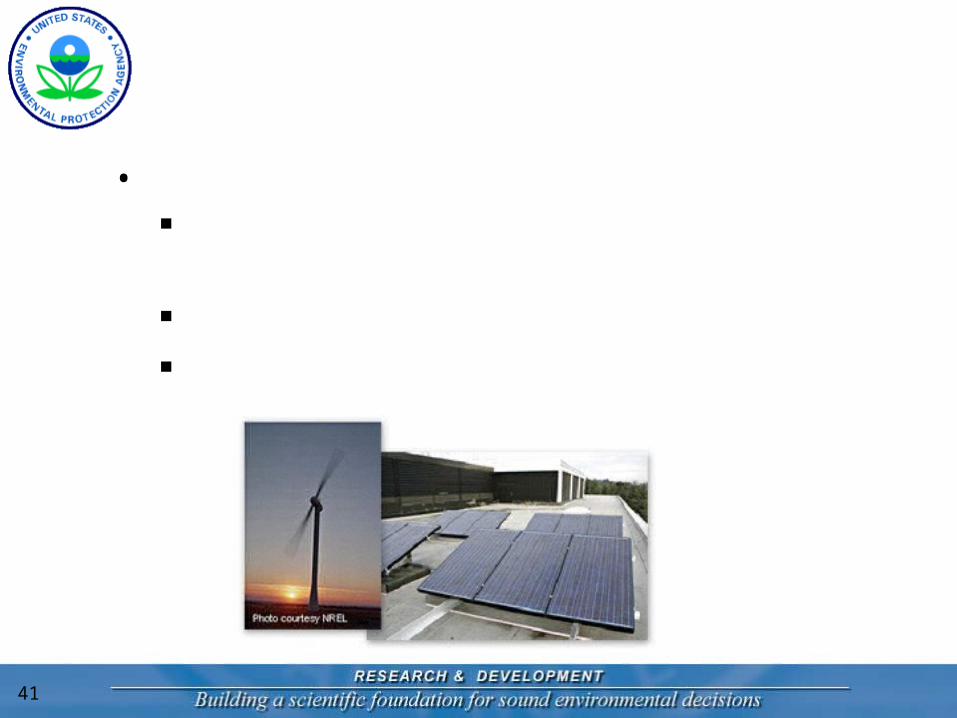
Renewable energy systems to replace or offset grid electricity
Managed demand to leverage low peak capacity and rates
6
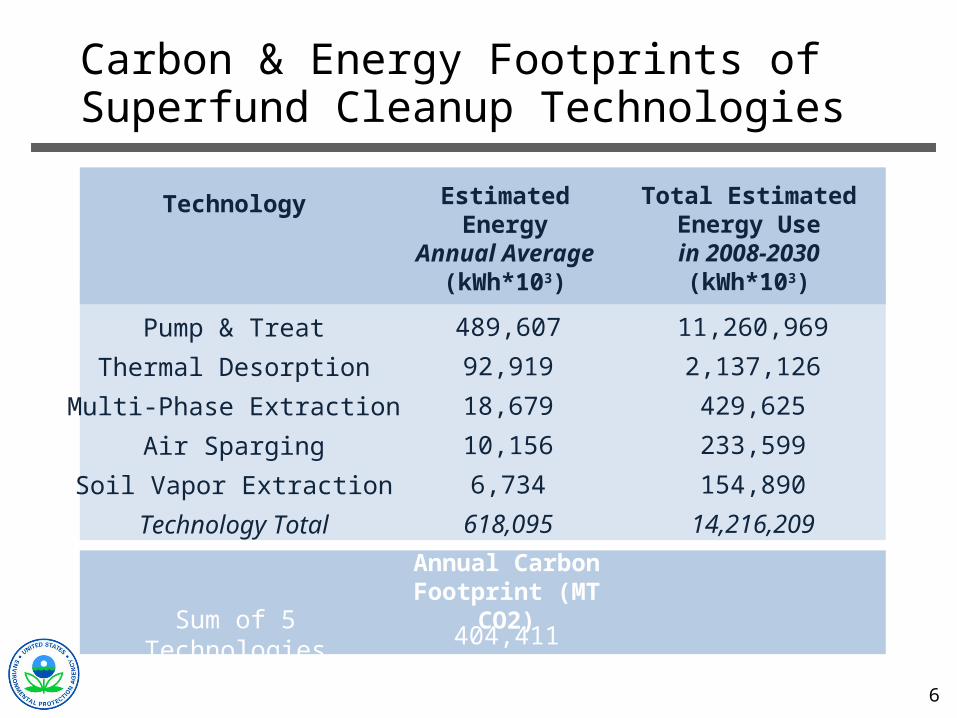
Carbon & Energy Footprints of Superfund Cleanup Technologies
Technology
Pump & Treat
Thermal Desorption
Multi-Phase Extraction
Air Sparging
Soil Vapor Extraction
Technology Total
Estimated EnergyAnnual
Average(kWh*103)
489,607
92,919
18,679
10,156
6,734
618,095
Total EstimatedEnergy Use
in 2008-2030(kWh*103)
11,260,969
2,137,126
429,625
233,599
154,890
14,216,209
Annual Carbon Footprint (MT CO2)
Sum of 5 Technologies 404,411
7
Recap on Energy & Carbon Footprint Strategy
Optimize systems to maximize efficiency and return per unit energy invested
Build renewable energy capacity at contaminated sites to power remedies
Tap into grid renewable energy portfolios
Leverage carbon sequestration from soil amendment treatment (policy vacuum)
8
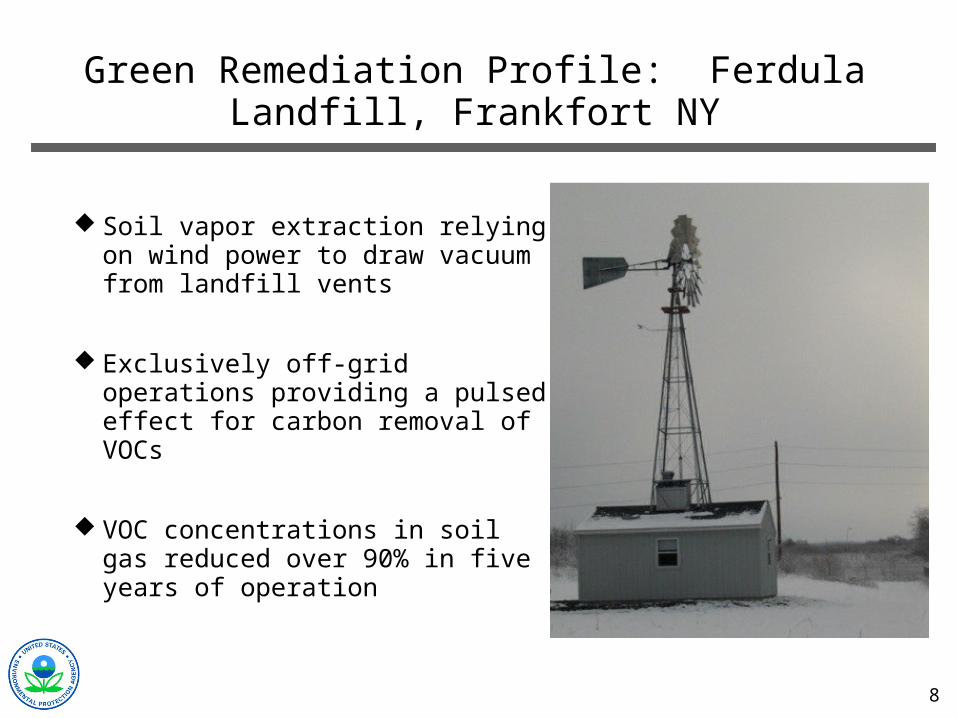
Green Remediation Profile: Ferdula Landfill, Frankfort NY
Soil vapor extraction relying on wind power to draw vacuum from landfill vents
Exclusively off-grid operations providing a pulsed effect for carbon removal of VOCs
VOC concentrations in soil gas reduced over 90% in five years of operation
9
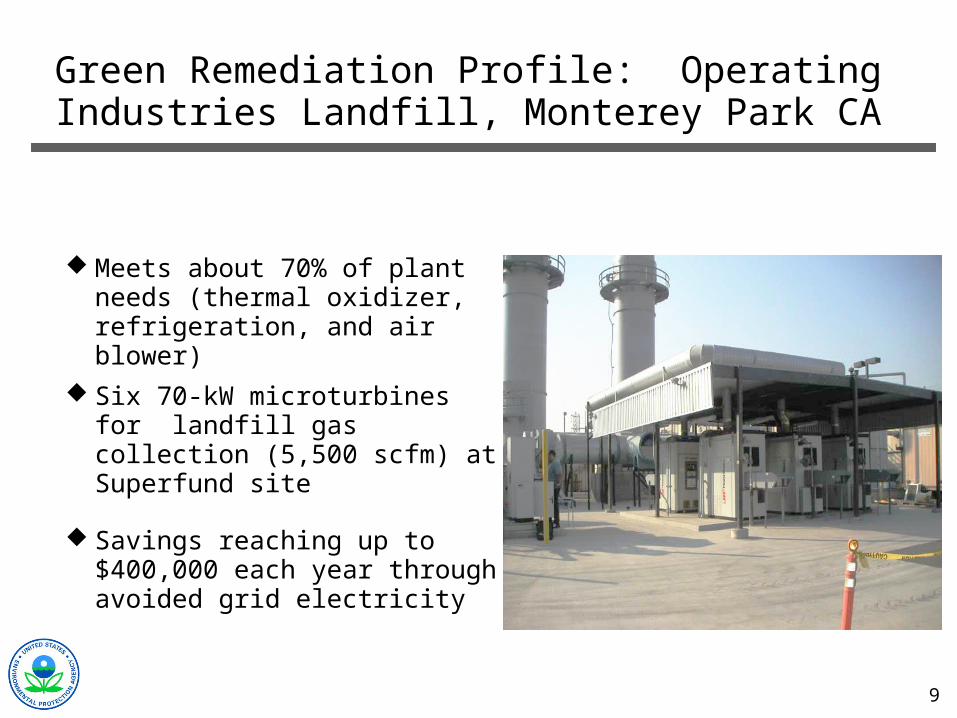
Green Remediation Profile: Operating Industries Landfill, Monterey Park CA
Meets about 70% of plant needs (thermal oxidizer, refrigeration, and air blower)
Six 70-kW microturbines for landfill gas collection (5,500 scfm) at Superfund site
Savings reaching up to $400,000 each year through avoided grid electricity
10
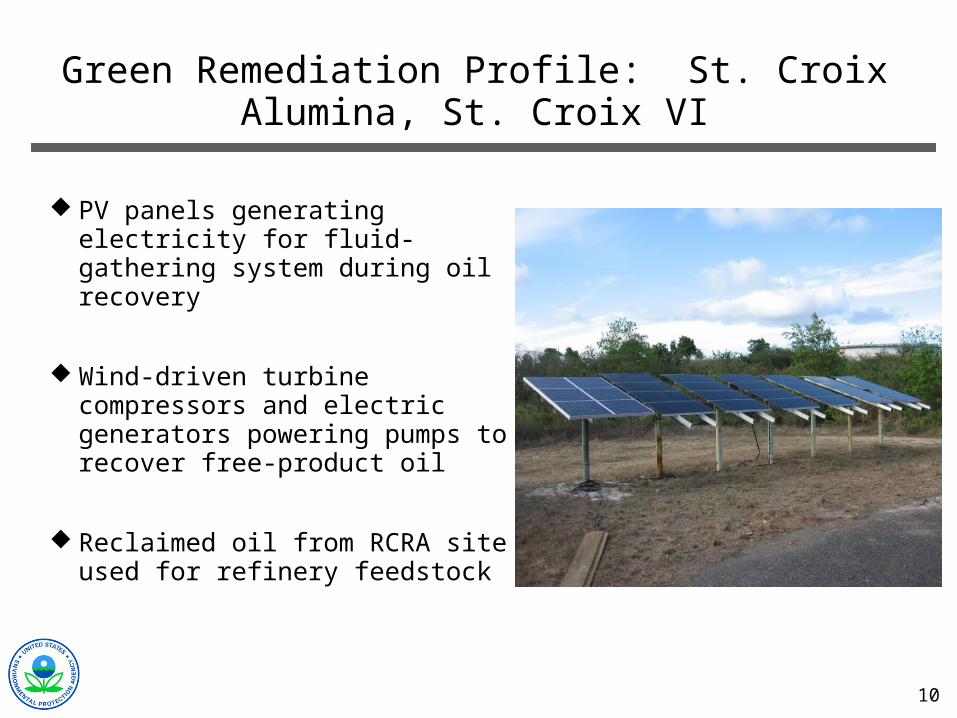
Green Remediation Profile: St. Croix Alumina, St. Croix VI
PV panels generating electricity for fluid-gathering system during oil recovery
Wind-driven turbine compressors and electric generators powering pumps to recover free-product oil
Reclaimed oil from RCRA site used for refinery feedstock
11
“OSWER” Green Remediation Strategy
» Benchmark and document GR best management practices
» Assemble a toolkit of enablers
» Build networks of practitioners
» Develop performance metrics and tracking mechanisms
For the purpose of advancing green remediation best practices across cleanup programs OSWER seeks to:
12
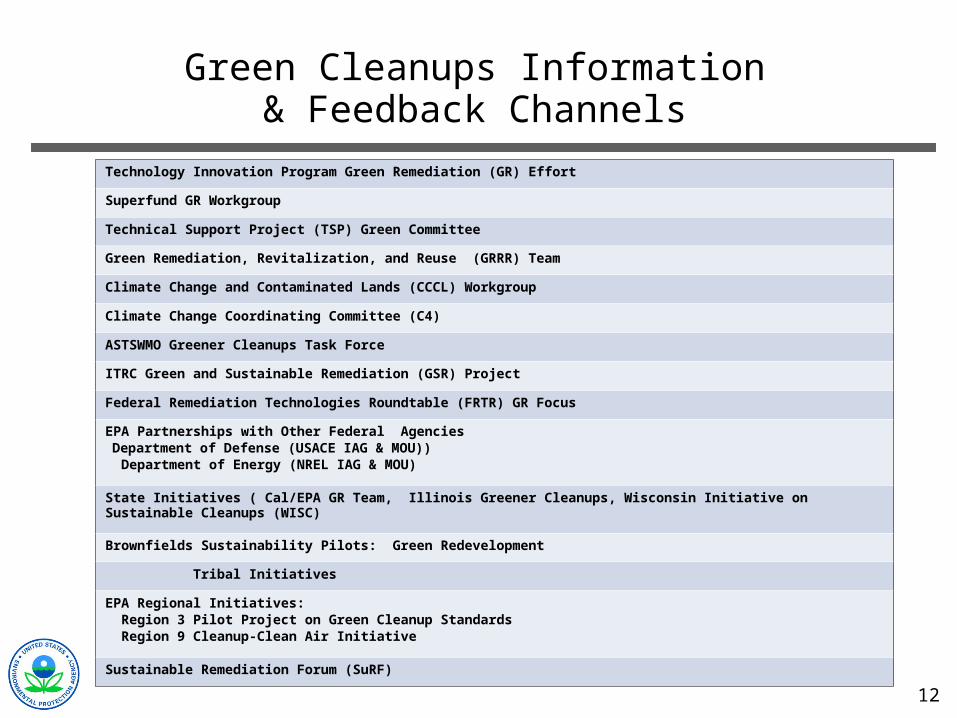
Green Cleanups Information& Feedback Channels
Technology Innovation Program Green Remediation (GR) Effort
Superfund GR Workgroup
Technical Support Project (TSP) Green Committee
Green Remediation, Revitalization, and Reuse (GRRR) Team
Climate Change and Contaminated Lands (CCCL) Workgroup
Climate Change Coordinating Committee (C4)
ASTSWMO Greener Cleanups Task Force
ITRC Green and Sustainable Remediation (GSR) Project
Federal Remediation Technologies Roundtable (FRTR) GR Focus
EPA Partnerships with Other Federal Agencies Department of Defense (USACE IAG & MOU)) Department of Energy (NREL IAG & MOU)
State Initiatives ( Cal/EPA GR Team, Illinois Greener Cleanups, Wisconsin Initiative on Sustainable Cleanups (WISC)
Brownfields Sustainability Pilots: Green Redevelopment
Tribal Initiatives
EPA Regional Initiatives: Region 3 Pilot Project on Green Cleanup Standards Region 9 Cleanup-Clean Air Initiative
Sustainable Remediation Forum (SuRF)
13
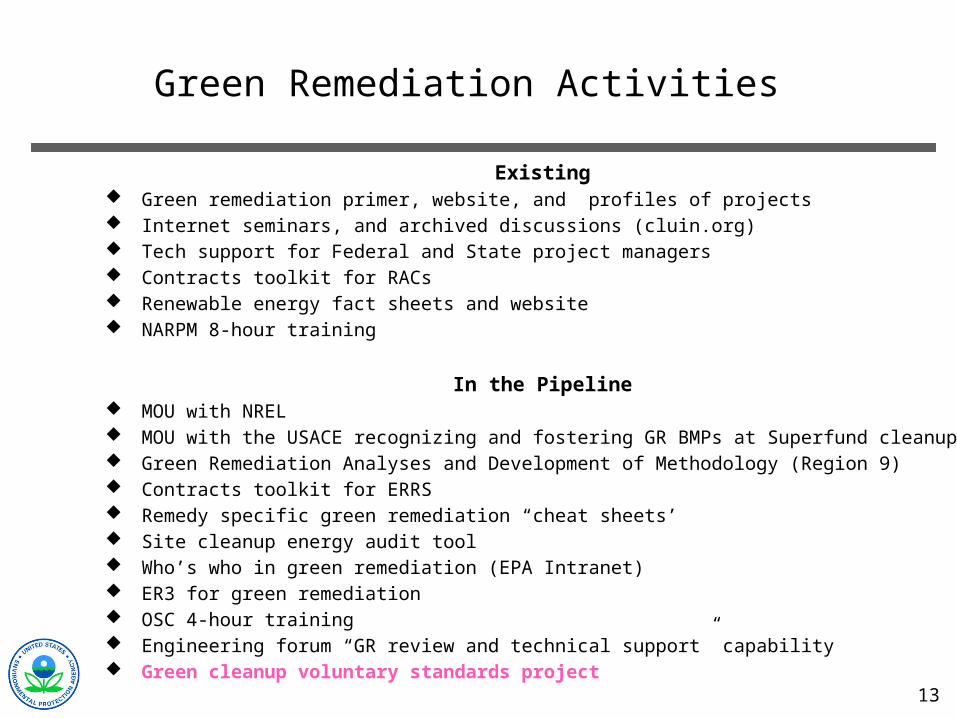
Green Remediation Activities
Existing Green remediation primer, website, and profiles of projects Internet seminars, and archived discussions (cluin.org) Tech support for Federal and State project managers Contracts toolkit for RACs Renewable energy fact sheets and website NARPM 8-hour training
In the Pipeline MOU with NREL MOU with the USACE recognizing and fostering GR BMPs at Superfund cleanups Green Remediation Analyses and Development of Methodology (Region 9) Contracts toolkit for ERRS Remedy specific green remediation “cheat sheets’ Site cleanup energy audit tool Who’s who in green remediation (EPA Intranet) ER3 for green remediation OSC 4-hour training Engineering forum “GR review and technical support” capability Green cleanup voluntary standards project
14
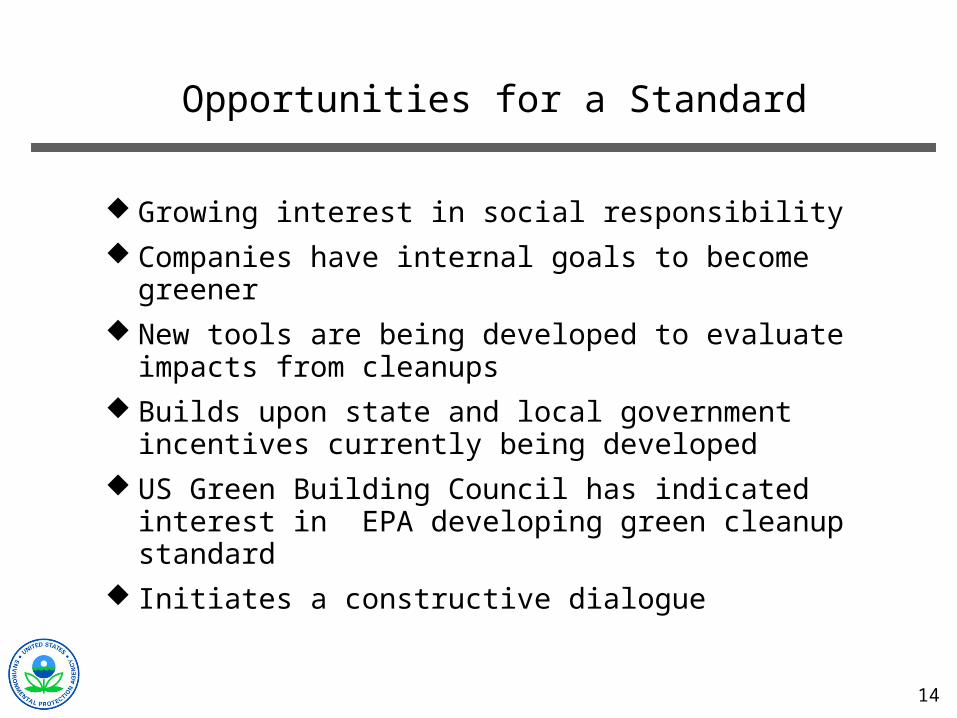
Opportunities for a Standard
Growing interest in social responsibility
Companies have internal goals to become greener
New tools are being developed to evaluate impacts from cleanups
Builds upon state and local government incentives currently being developed
US Green Building Council has indicated interest in EPA developing green cleanup standard
Initiates a constructive dialogue
15
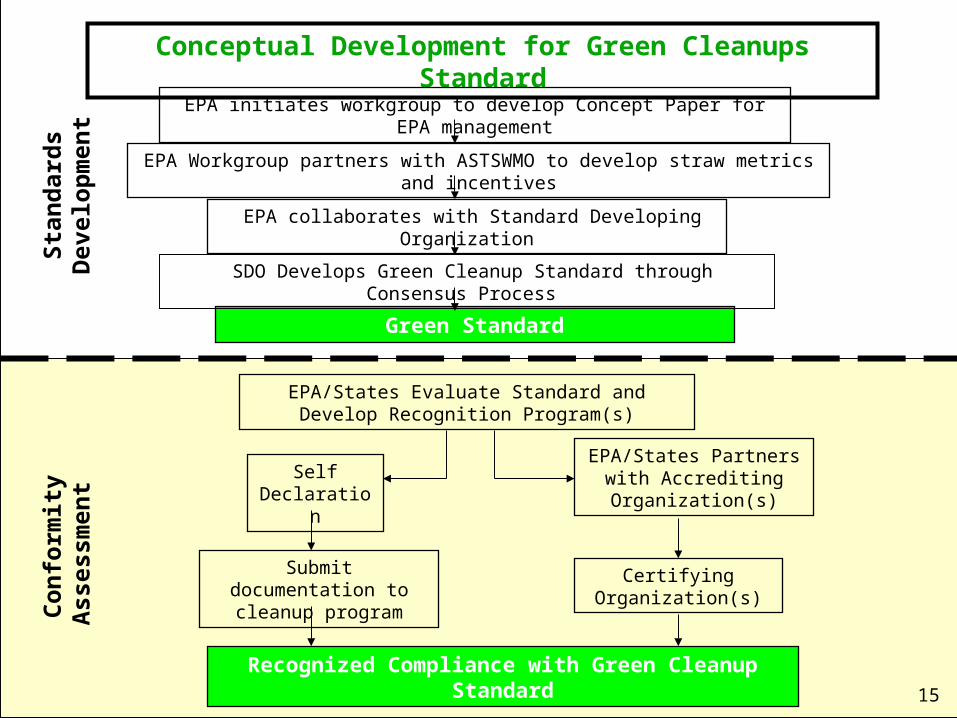
Conceptual Development for Green Cleanups Standard
EPA Workgroup partners with ASTSWMO to develop straw metrics and incentives
EPA collaborates with Standard Developing Organization
Green Standard
EPA/States Evaluate Standard and Develop Recognition Program(s)
EPA/States Partners with Accrediting
Organization(s)
Certifying Organization(s)
Self Declaration
Recognized Compliance with Green Cleanup Standard
EPA initiates workgroup to develop Concept Paper for EPA management
Submit documentation to cleanup program
Sta
nd
ard
s D
evel
op
men
tC
on
form
ity
Ass
essm
ent
SDO Develops Green Cleanup Standard through Consensus Process
15
16
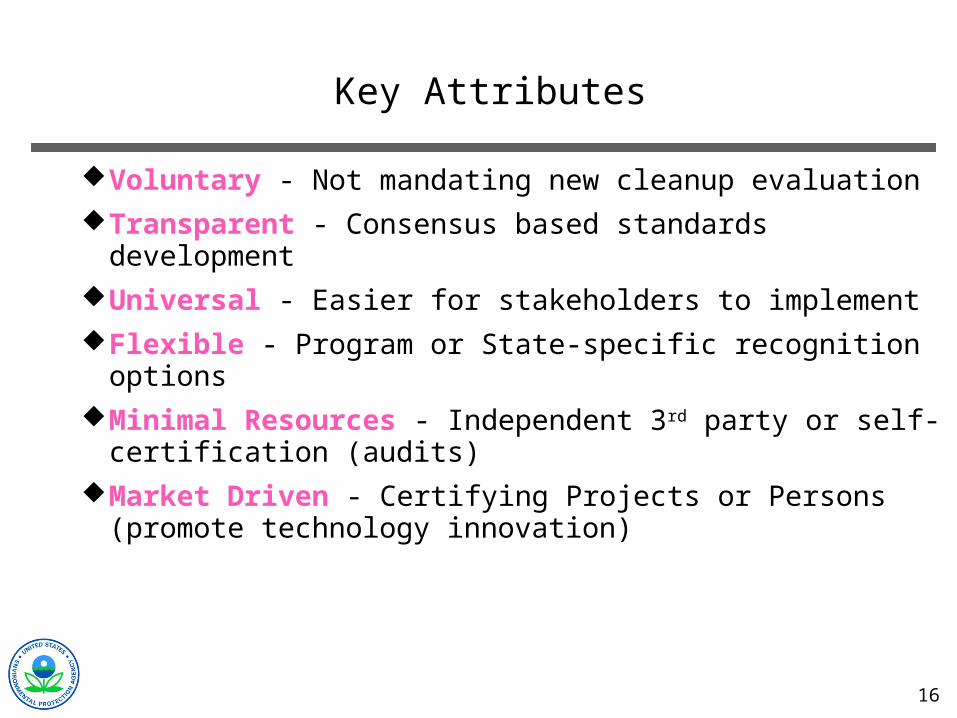
Key Attributes
Voluntary - Not mandating new cleanup evaluation
Transparent - Consensus based standards development
Universal - Easier for stakeholders to implement
Flexible - Program or State-specific recognition options
Minimal Resources - Independent 3rd party or self-certification (audits)
Market Driven - Certifying Projects or Persons (promote technology innovation)
17
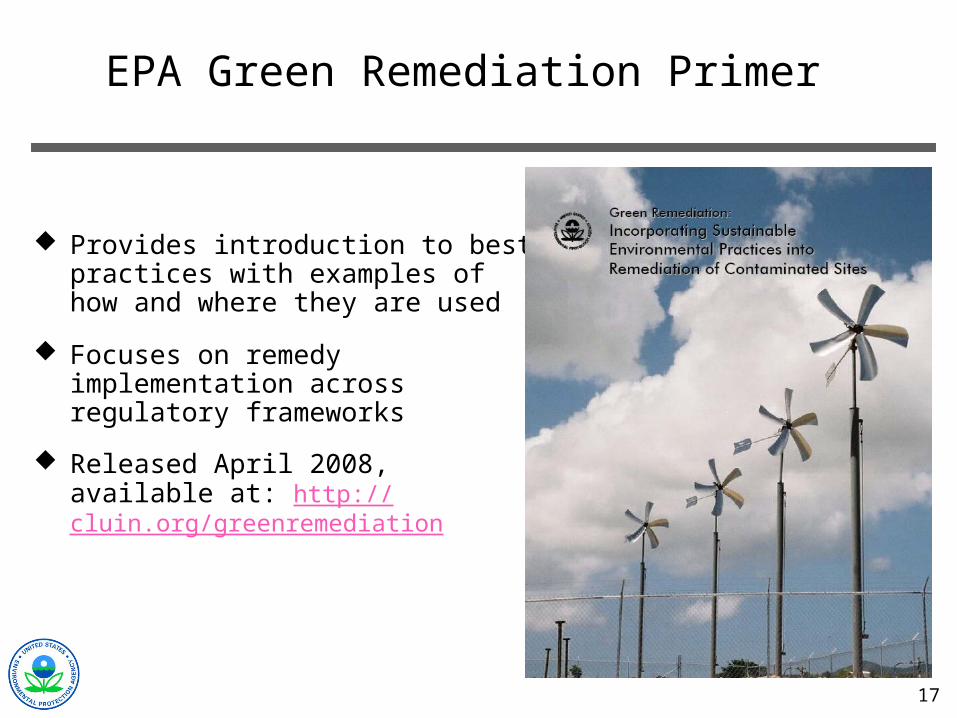
EPA Green Remediation Primer
Provides introduction to best practices with examples of how and where they are used
Focuses on remedy implementation across regulatory frameworks
Released April 2008, available at: http://cluin.org/greenremediation
18
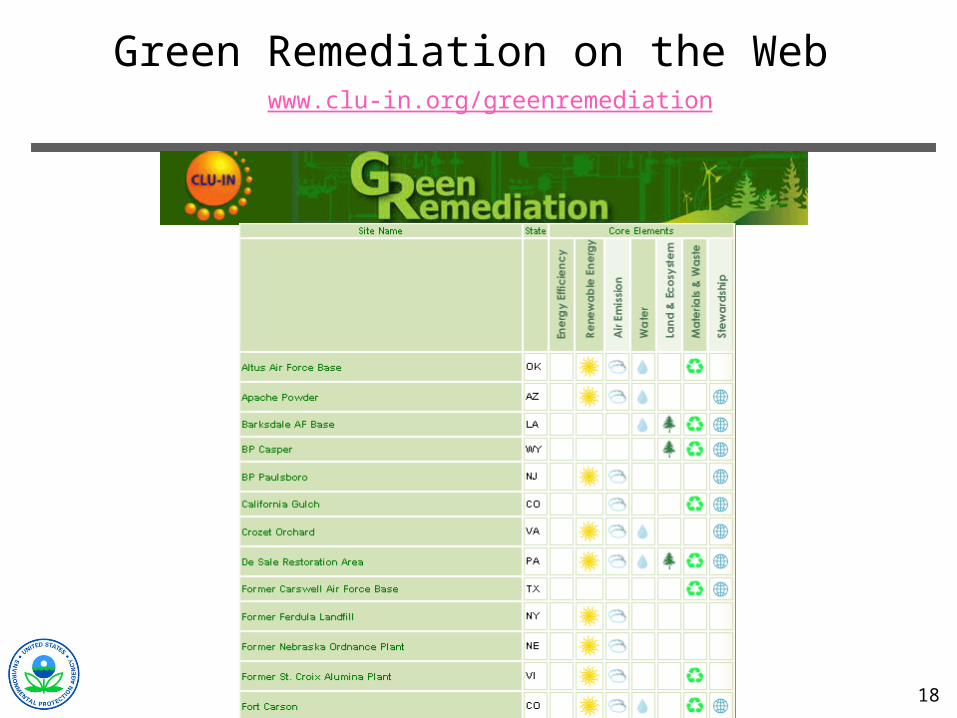
Green Remediation on the Web www.clu-in.org/greenremediation
1919
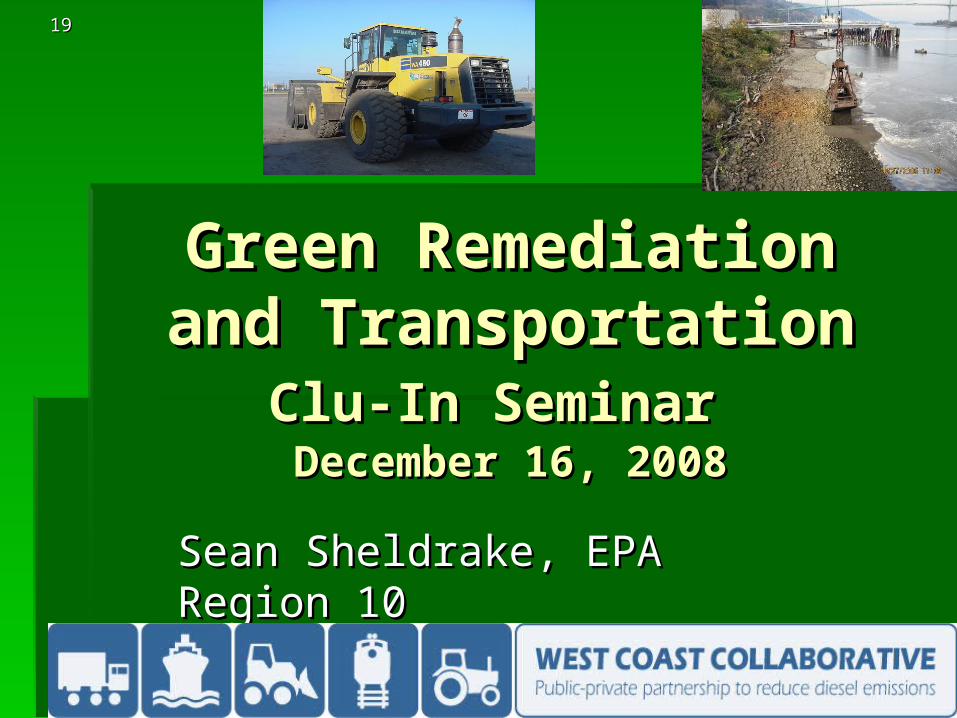
Green Remediation Green Remediation and Transportationand Transportation
Clu-In SeminarClu-In Seminar December 16, 2008December 16, 2008
Sean Sheldrake, EPA Region 10Sean Sheldrake, EPA Region 10
1919
2020
Why Transportation?Why Transportation?
Transportation is often the biggest Transportation is often the biggest energy consumer for site cleanups.energy consumer for site cleanups.
Transportation and other vehicles used Transportation and other vehicles used can be the biggest polluters for each unit can be the biggest polluters for each unit of energy required to do the cleanup at of energy required to do the cleanup at your site, increasing short term risks.your site, increasing short term risks.
2121
Protect/Improve Public Health by:Protect/Improve Public Health by: Helping to meet National Ambient Air Quality Standards (PM2.5, Helping to meet National Ambient Air Quality Standards (PM2.5,
Ozone)Ozone) Meeting air toxics goals (both federal and state/local partners)Meeting air toxics goals (both federal and state/local partners)
Support Energy Security and Green House Support Energy Security and Green House Gas Reductions by:Gas Reductions by: Using cleaner fuels (biodiesel, biogas/natural gas, electric …) Using cleaner fuels (biodiesel, biogas/natural gas, electric …)
relative to total diesel fuelrelative to total diesel fuel Advance regional/local production of renewable fuels supporting Advance regional/local production of renewable fuels supporting
local agriculture and forestry sectorslocal agriculture and forestry sectors Utilize SmartWay and other programs to virtually eliminate on-Utilize SmartWay and other programs to virtually eliminate on-
road, locomotive, and non-road HDD idling (ports, corridors, road, locomotive, and non-road HDD idling (ports, corridors, distribution locations)distribution locations)
West Coast Collaborative Goals
2222
Why is Reducing Emissions Why is Reducing Emissions Important?Important?Degrades Air Quality Degrades Air Quality Particulate Matter (PM)Particulate Matter (PM) Ozone precursorsOzone precursors
Energy and Climate ChangeEnergy and Climate Change Over 40% of green house gas emissions from mobile sourcesOver 40% of green house gas emissions from mobile sources Over 90% of fuel imported petroleumOver 90% of fuel imported petroleum
Serious Health EffectsSerious Health Effects Diesel exhaust is a Diesel exhaust is a “likely human carcinogen”“likely human carcinogen” and respiratory irritant and respiratory irritant Harmful diesel PMHarmful diesel PM Diesel exhaust contains “likely” and “known” (e.g., benzene) human Diesel exhaust contains “likely” and “known” (e.g., benzene) human
carcinogens, and also have respiratory, neurological, developmental, carcinogens, and also have respiratory, neurological, developmental, and immunological health effects.and immunological health effects.
2424
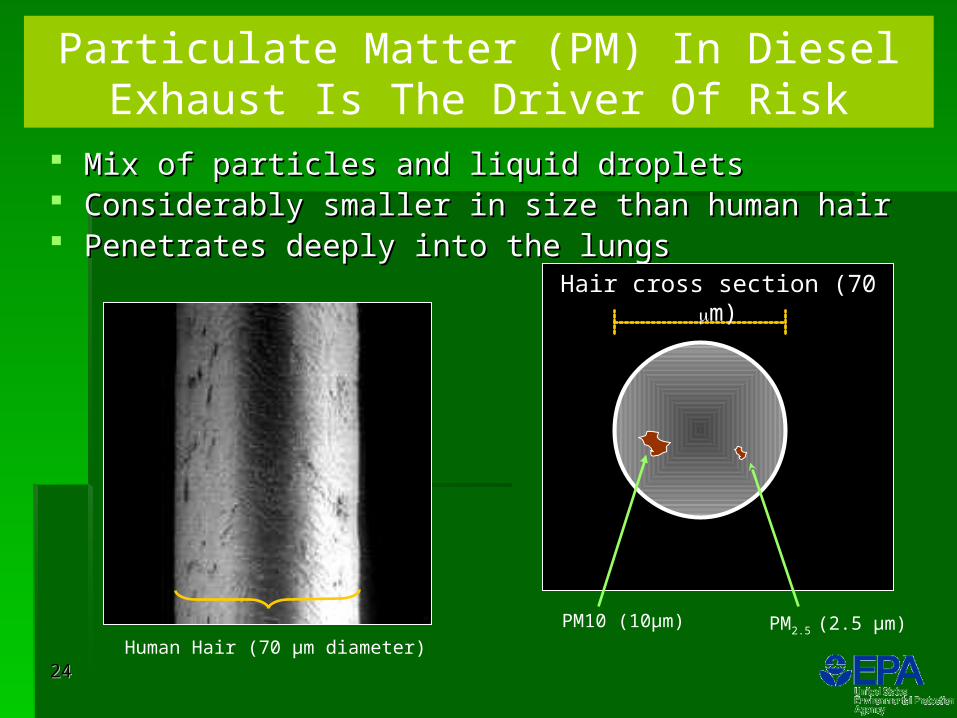
Mix of particles and liquid dropletsMix of particles and liquid droplets Considerably smaller in size than human hairConsiderably smaller in size than human hair Penetrates deeply into the lungsPenetrates deeply into the lungs
Hair cross section (70 m)
PM10 (10µm) PM2.5 (2.5 µm)Human Hair (70 µm diameter)
Particulate Matter (PM) In Diesel Exhaust Is The Driver Of Risk
2525
Avoiding Or Substantially Avoiding Or Substantially Reducing EmissionsReducing Emissions
Switch from truck to rail transportSwitch from truck to rail transport Investigate on-site disposal options Investigate on-site disposal options Integrate diesel emissions into short term Integrate diesel emissions into short term
impact analyses to allow for lower impact impact analyses to allow for lower impact technology to be identified during FS technology to be identified during FS analysisanalysis

2626
What If Rail Transport Isn’t What If Rail Transport Isn’t Practical? What Now?Practical? What Now?
Diesel emissions controls may be a Diesel emissions controls may be a viable and cost effective option at your viable and cost effective option at your site.site.
2727
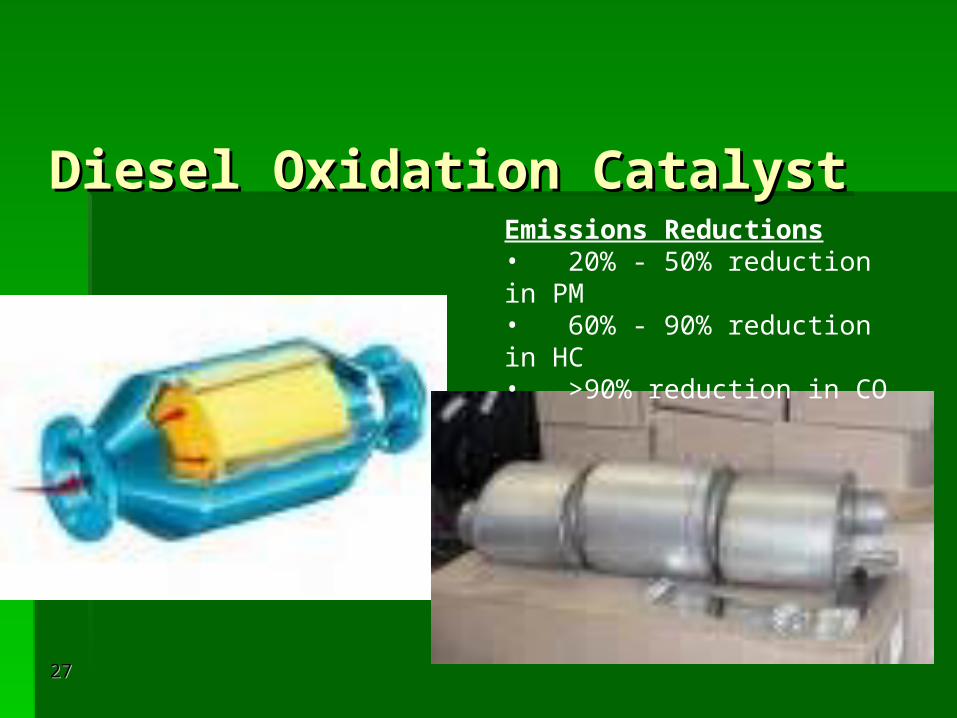
Diesel Oxidation CatalystDiesel Oxidation CatalystEmissions Reductions • 20% - 50% reduction in PM• 60% - 90% reduction in HC• >90% reduction in CO
2828
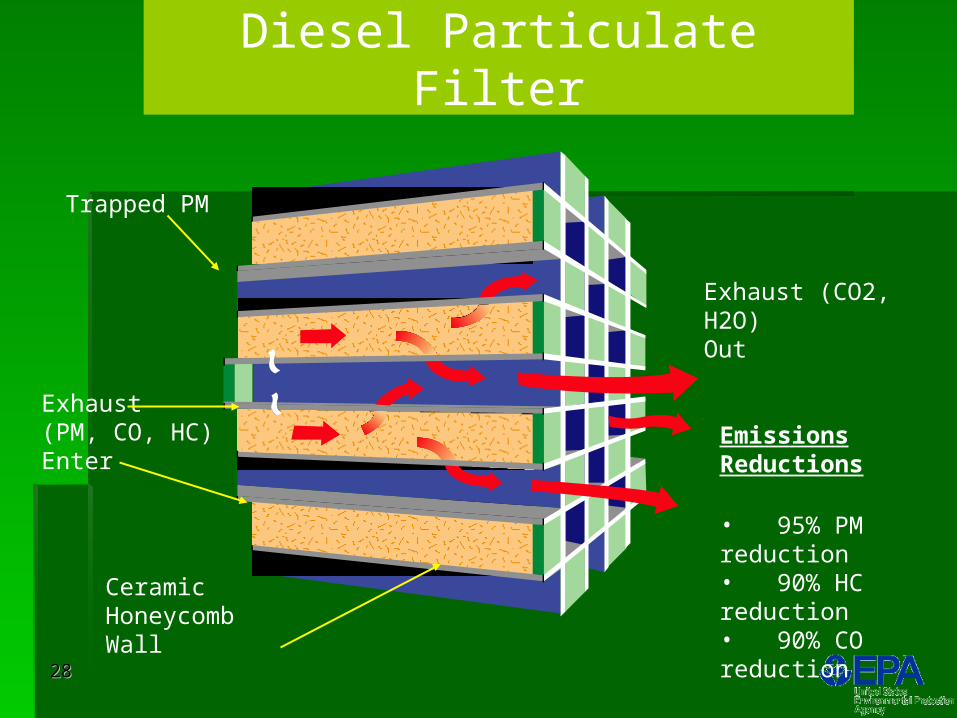
Trapped PM
Exhaust(PM, CO, HC)Enter
Ceramic HoneycombWall
Exhaust (CO2, H2O)Out
Emissions Reductions
• 95% PM reduction• 90% HC reduction• 90% CO reduction
Diesel Particulate Filter
2929
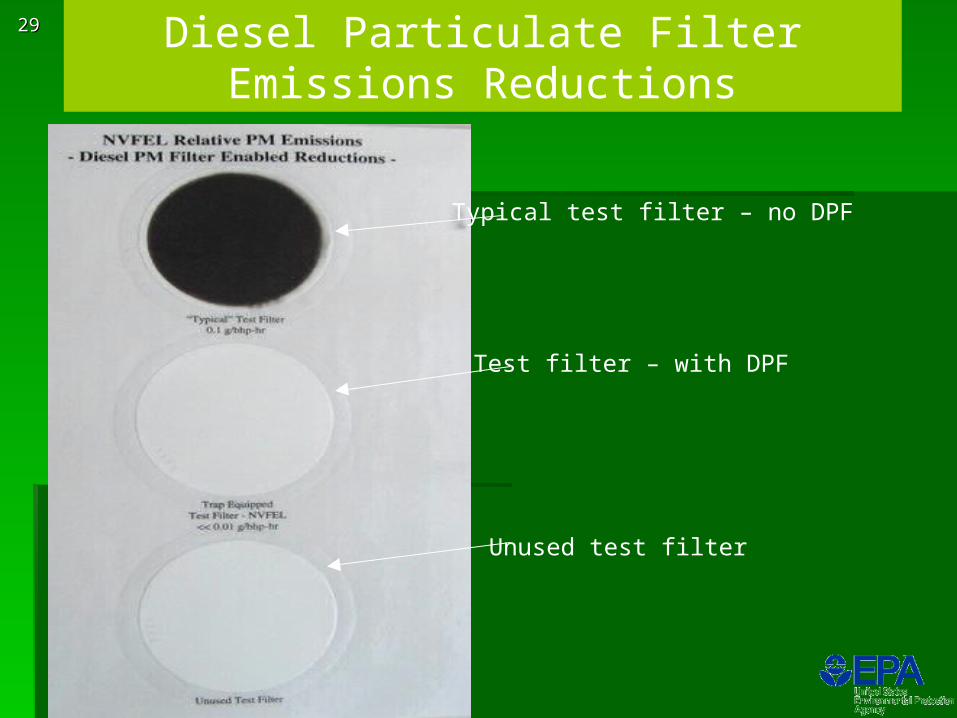
Typical test filter – no DPF
Test filter – with DPF
Unused test filter
Diesel Particulate Filter Emissions Reductions
2929

3030
Diesel Multistage Filter Diesel Multistage Filter (DMFs)(DMFs)
3030
3131
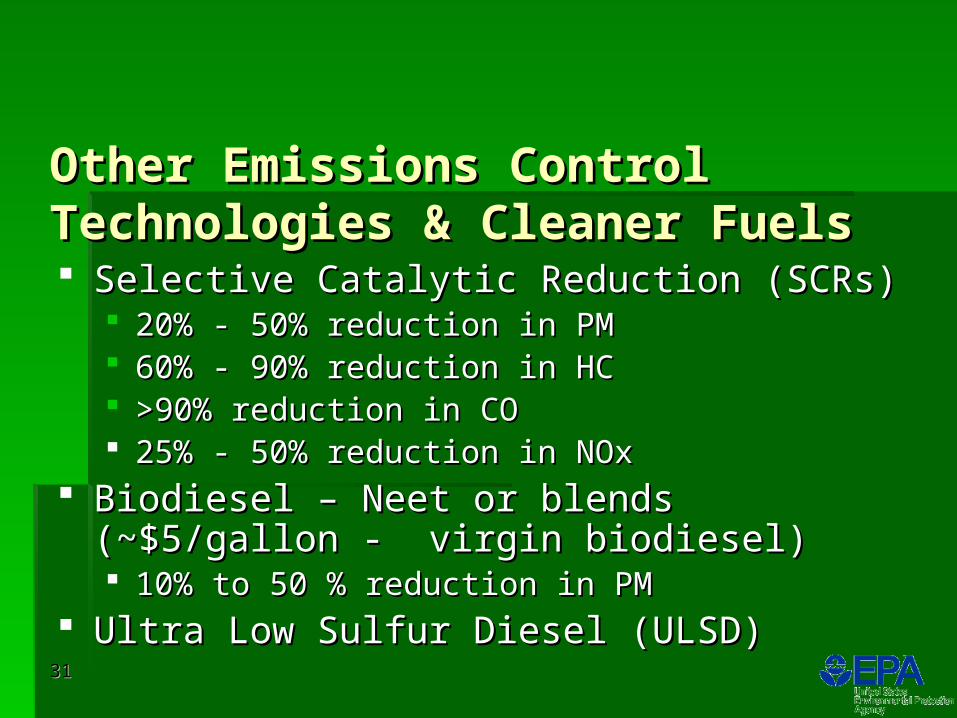
Other Emissions Control Other Emissions Control Technologies & Cleaner FuelsTechnologies & Cleaner Fuels Selective Catalytic Reduction (SCRs)Selective Catalytic Reduction (SCRs)
20% - 50% reduction in PM20% - 50% reduction in PM 60% - 90% reduction in HC60% - 90% reduction in HC >90% reduction in CO>90% reduction in CO 25% - 50% reduction in NOx25% - 50% reduction in NOx
Biodiesel – Neet or blends (~$5/gallon - virgin Biodiesel – Neet or blends (~$5/gallon - virgin biodiesel)biodiesel) 10% to 50 % reduction in PM10% to 50 % reduction in PM
Ultra Low Sulfur Diesel (ULSD)Ultra Low Sulfur Diesel (ULSD)
3232
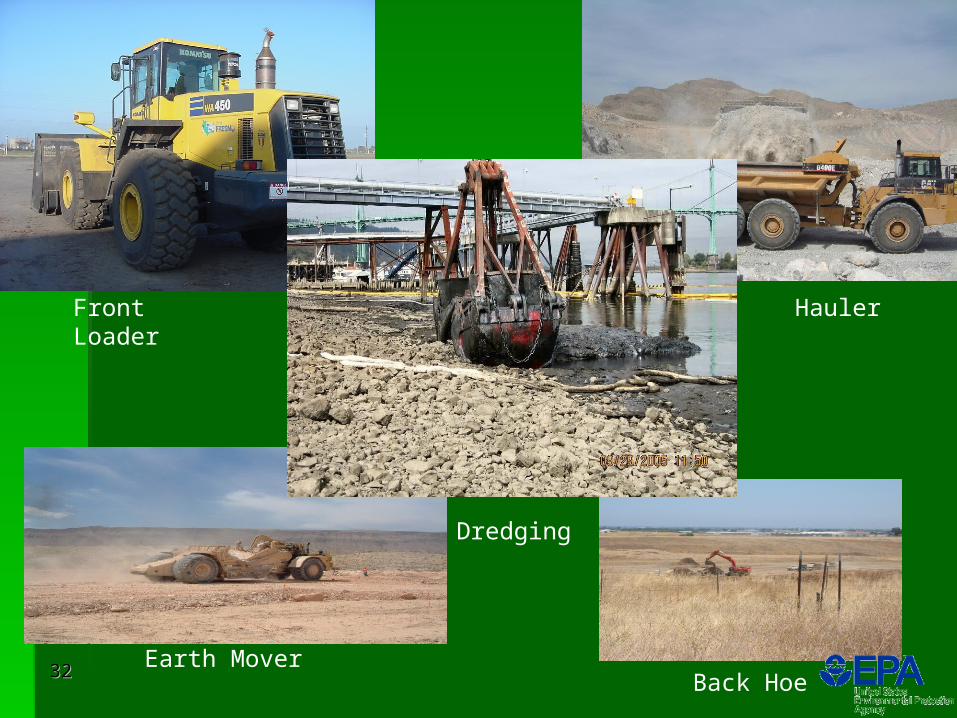
Front Loader
Earth Mover
Hauler
Back Hoe
Dredging
3333
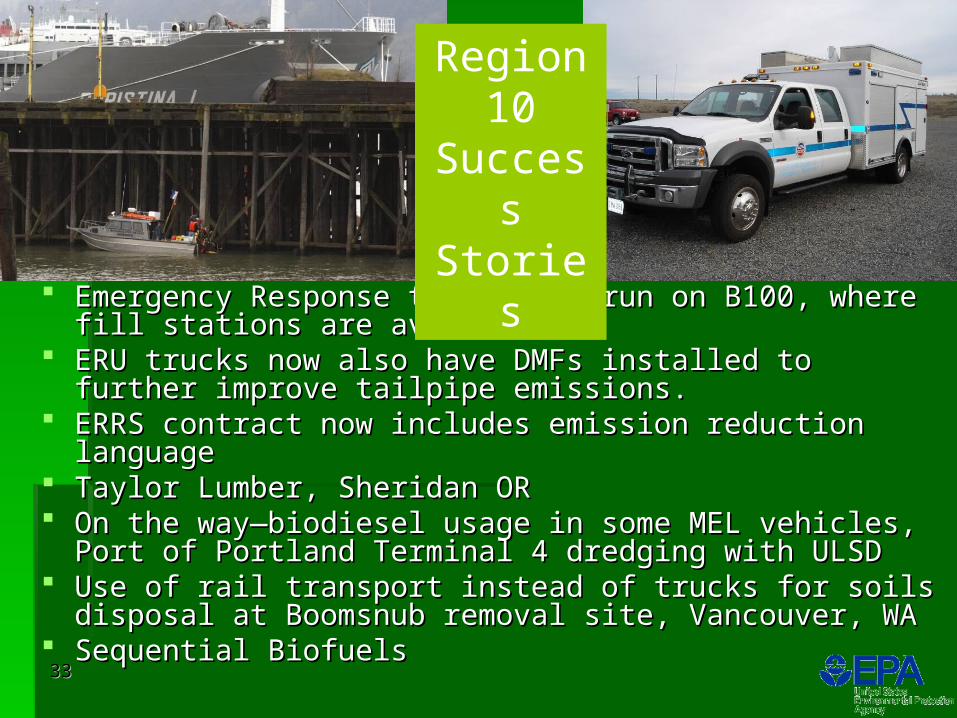
Emergency Response trucks now run on B100, where fill Emergency Response trucks now run on B100, where fill stations are available.stations are available.
ERU trucks now also have DMFs installed to further improve ERU trucks now also have DMFs installed to further improve tailpipe emissions.tailpipe emissions.
ERRS contract now includes emission reduction languageERRS contract now includes emission reduction language Taylor Lumber, Sheridan ORTaylor Lumber, Sheridan OR On the way—biodiesel usage in some MEL vehicles, Port of On the way—biodiesel usage in some MEL vehicles, Port of
Portland Terminal 4 dredging with ULSDPortland Terminal 4 dredging with ULSD Use of rail transport instead of trucks for soils disposal at Use of rail transport instead of trucks for soils disposal at
Boomsnub removal site, Vancouver, WABoomsnub removal site, Vancouver, WA Sequential BiofuelsSequential Biofuels
Region 10
Success Stories

3434
3434
3535

3636
Example Contract Language Example Contract Language From Taylor Lumber, From Taylor Lumber, Sheridan, ORSheridan, OR
3737
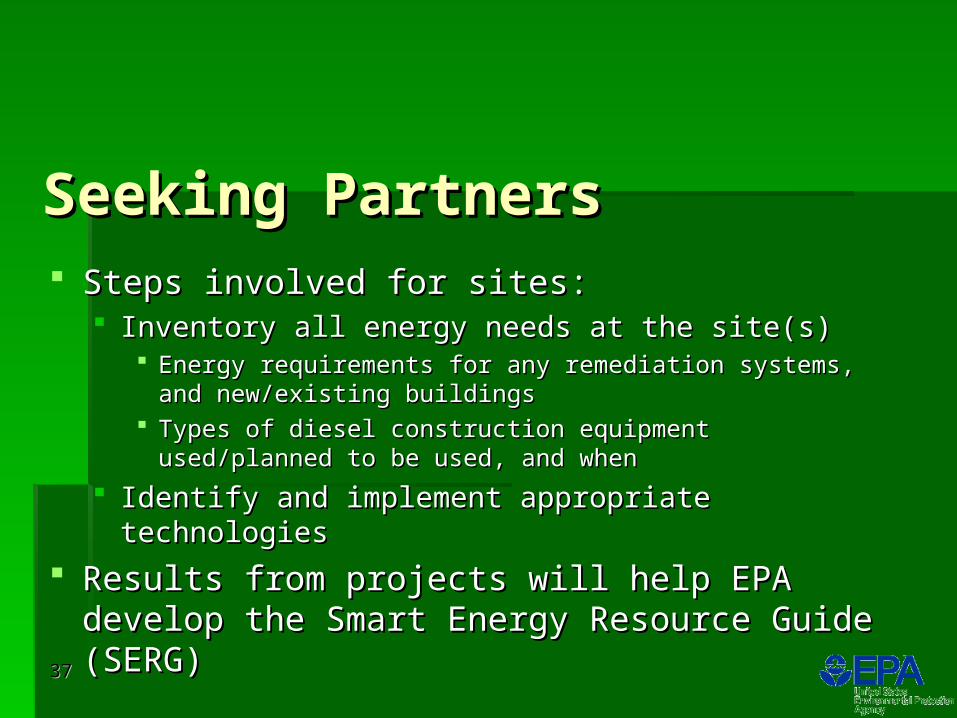
Seeking PartnersSeeking Partners Steps involved for sites:Steps involved for sites:
Inventory all energy needs at the site(s) Inventory all energy needs at the site(s) Energy requirements for any remediation systems, and Energy requirements for any remediation systems, and
new/existing buildingsnew/existing buildings Types of diesel construction equipment used/planned to be Types of diesel construction equipment used/planned to be
used, and whenused, and when
Identify and implement appropriate technologiesIdentify and implement appropriate technologies
Results from projects will help EPA develop the Results from projects will help EPA develop the Smart Energy Resource Guide (SERG)Smart Energy Resource Guide (SERG)
3838
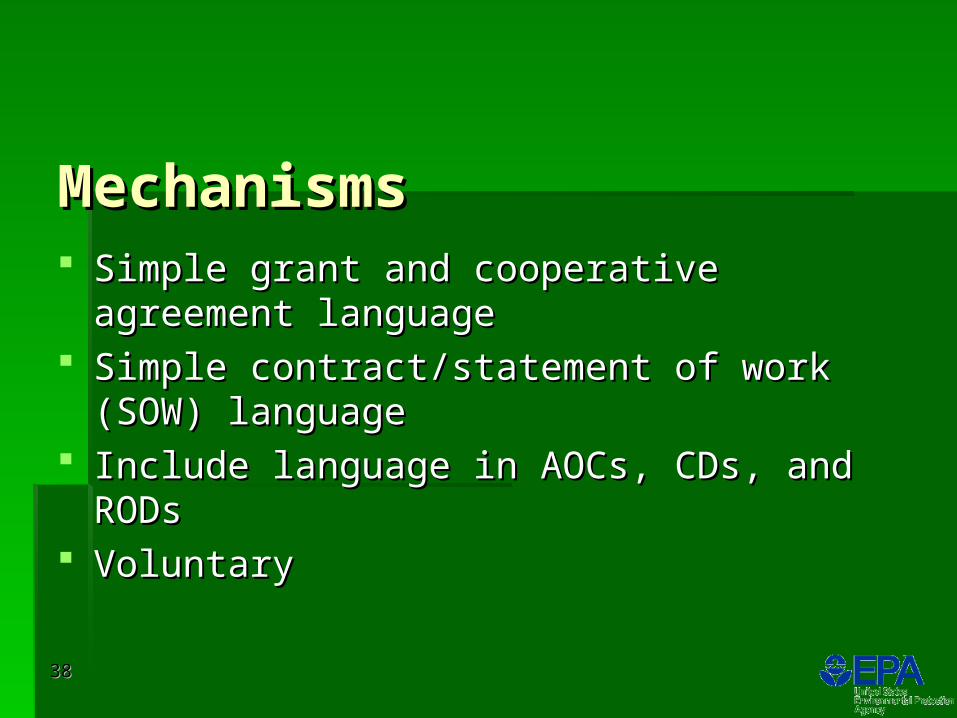
MechanismsMechanisms Simple grant and cooperative agreement Simple grant and cooperative agreement
languagelanguage Simple contract/statement of work (SOW) Simple contract/statement of work (SOW)
languagelanguage Include language in AOCs, CDs, and RODsInclude language in AOCs, CDs, and RODs VoluntaryVoluntary
3939
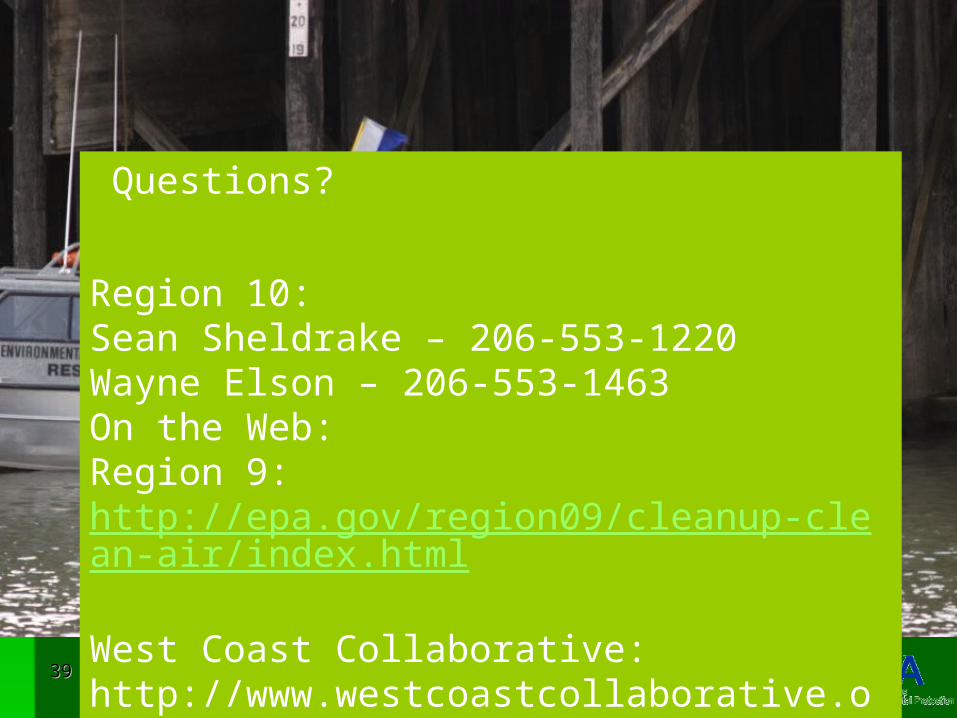
Questions?
Region 10:Sean Sheldrake – 206-553-1220Wayne Elson – 206-553-1463On the Web:Region 9:http://epa.gov/region09/cleanup-clean-air/index.html
West Coast Collaborative:http://www.westcoastcollaborative.org/
40
“Smart Energy Resources Guide”
Michael D. GillRegion 9, San Francisco
Green Remediation Seminar SeriesSession B
December 16, 2008
41
Smart Energy Resources Guide
• Outline for Today History of Energy Activities in Region 9 Document Overview Next Steps
42
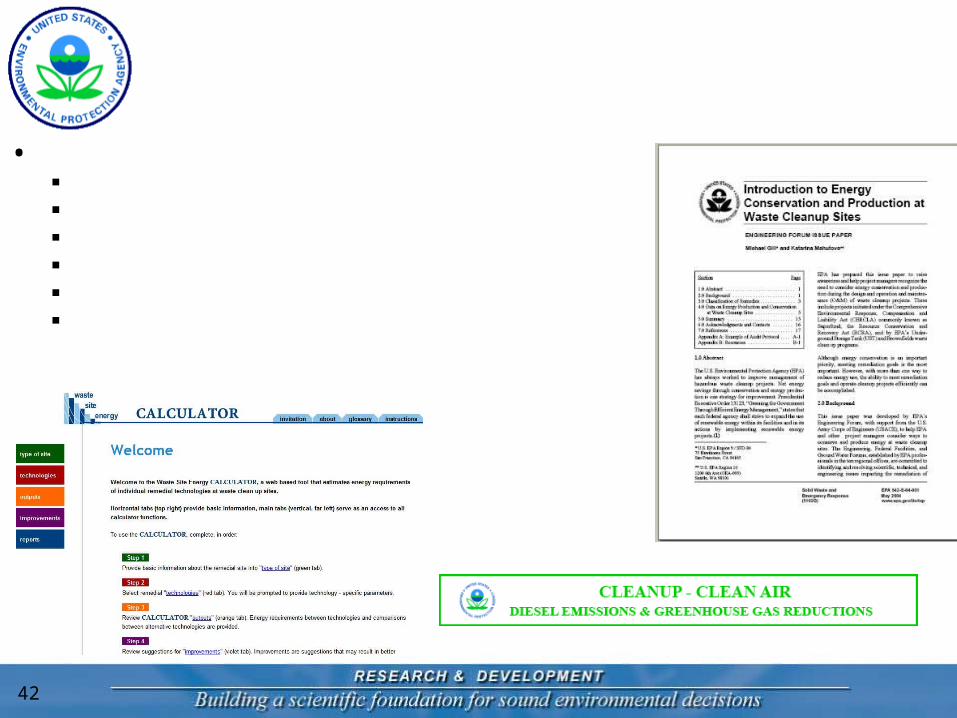
Smart Energy Resources Guide
• History Engineering Forum Issue Paper (May 2004) Version 1 “Energy Calculator” (2005) R9 Cleanup - Clean Air Initiative (2005) RARE Project Awarded (2006) R9 Energy Advisor Hired (2007) SERG = RARE Product in (May 2008)
43
Smart Energy Resources Guide
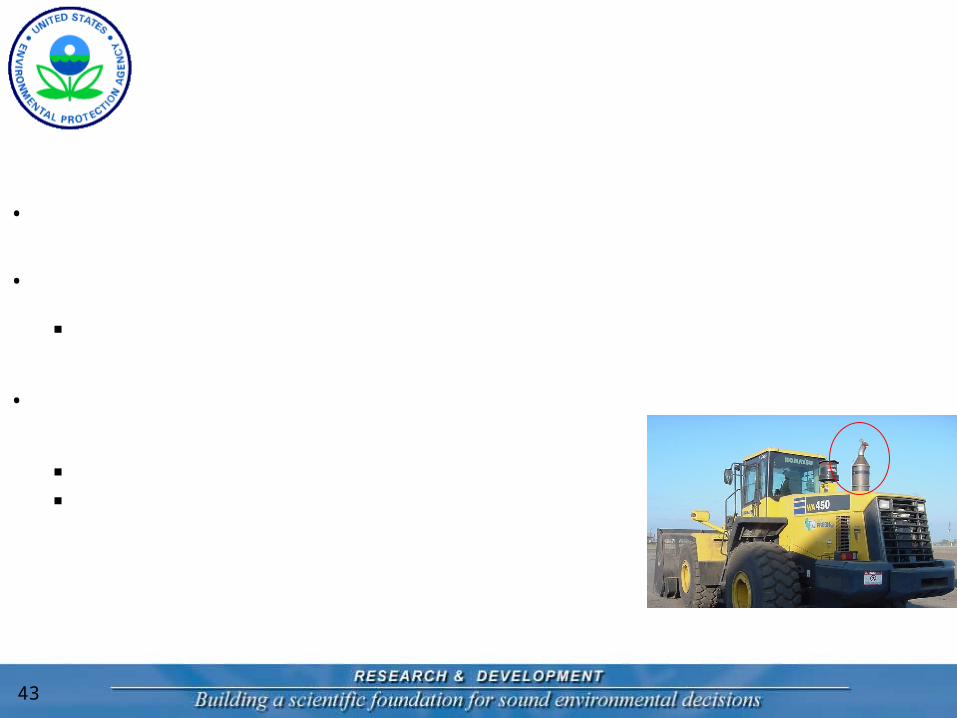
• Footprint of half of R9 Superfund Sites
• Total diesel emissions from 1985-2009 are estimated to be 3,140 tons NOx, 848 tons CO, and 105 tons PM. ~ 54,000 buses driven across US
• Total CO2 emissions associated with electricity consumption from 1990-2009 are estimated to be 428,174 tons. ~ 84,000 cars on the road for one year or ~ 50,000 single family homes for one year
Electricity and Diesel Emissions Inventory
Dozer with diesel particulate filter
44
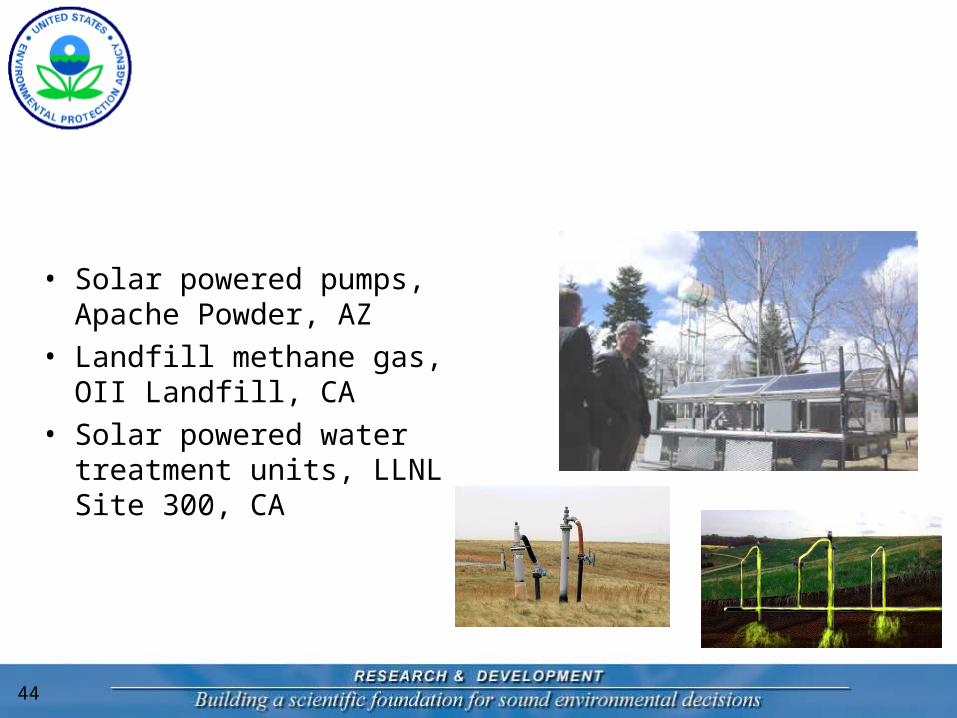
Smart Energy Resources Guide
• Solar powered pumps, Apache Powder, AZ
• Landfill methane gas, OII Landfill, CA
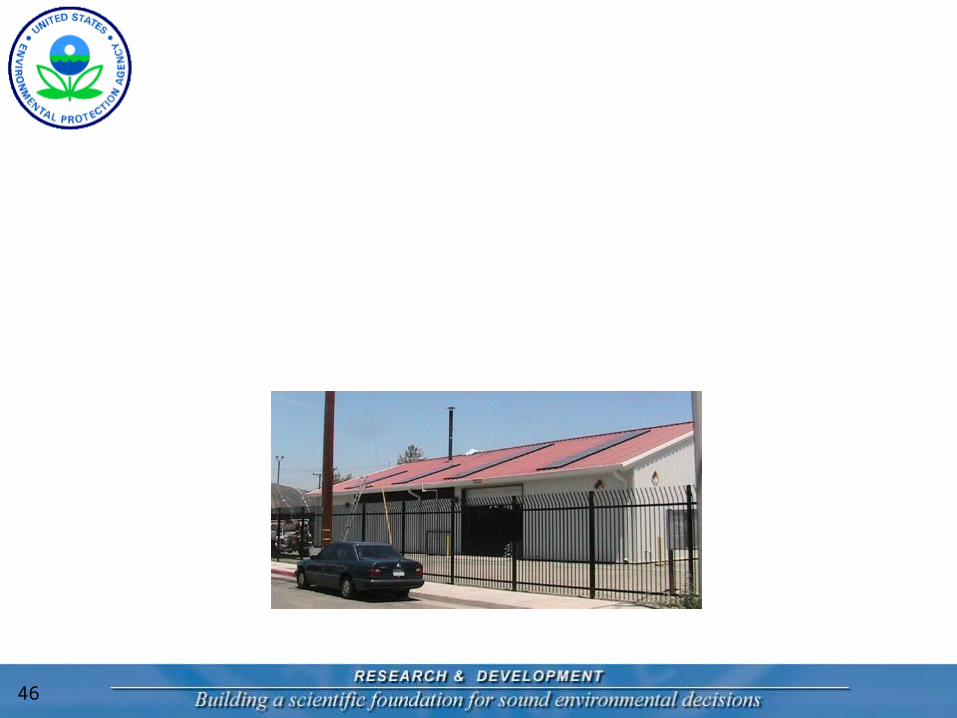
• Solar powered water treatment units, LLNL Site 300, CA
Renewable Energy Success Stories
45
Green Remediation – An EPA Perspective
46
Smart Energy Resources Guide
What the SERG Can Do For You:
“The SERG provides information on practices and technologies that can reduce emissions from electricity and diesel use at cleanup sites.”
Solar panels at Pemaco site, CA

47
Smart Energy Resources Guide
What is Our Goal?
Implement Renewable Energy• Reduce the significant, long-term energy demands typical for Superfund
site cleanup operations• Reduce greenhouse gas emissions and air pollutants• Demonstrate progressive environmental leadership
Reduce Diesel Emissions• Diesel exhaust contains harmful particulate matter (PM)• Diesel exhaust is a “likely human carcinogen” and respiratory irritant
48
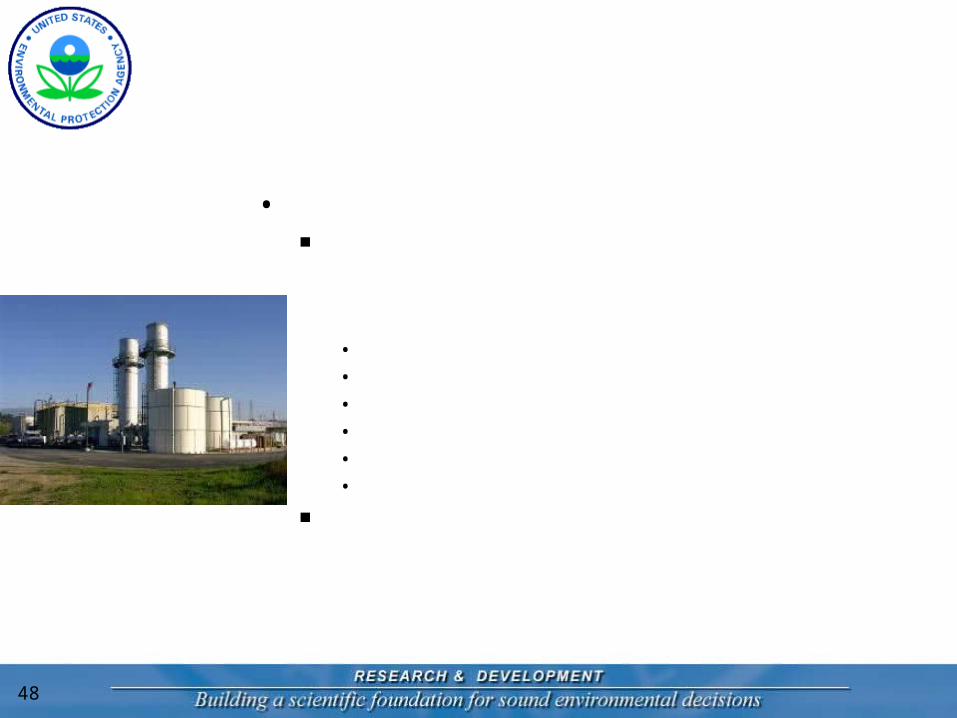
Smart Energy Resources Guide
• SERG Outline Renewable Technologies (basics,
assessments, costs, success stories)• Solar• Wind• Landfill Gas-to-Energy• Anaerobic Digestion• Biomass Gasification• Cleaner Diesel
Funding Resources and OpportunitiesLFG flares at OII site, CA
49
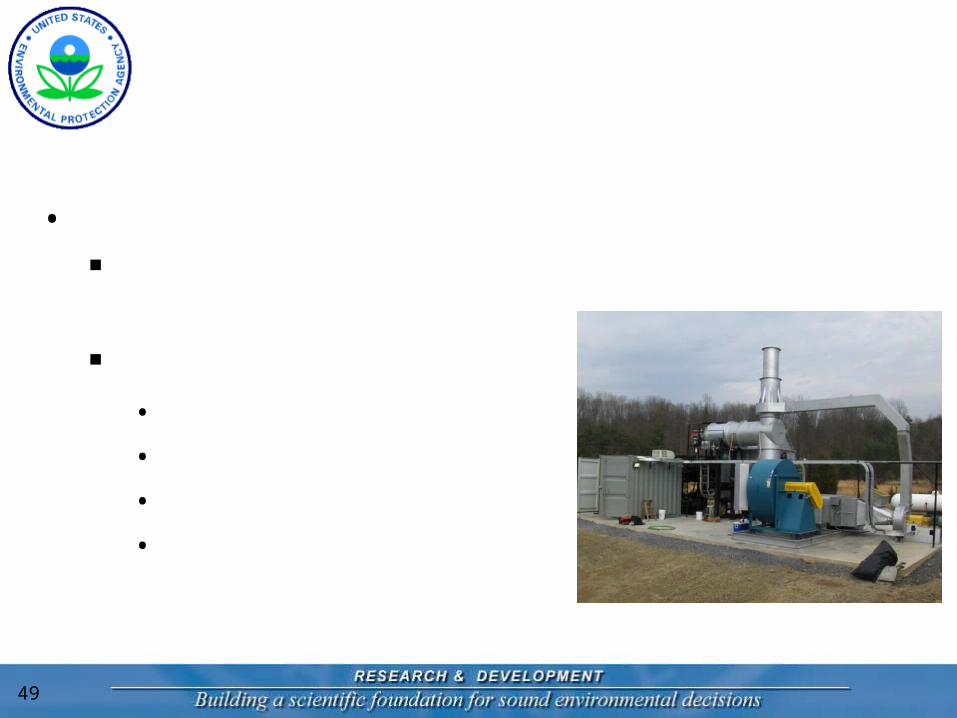
Smart Energy Resources Guide
• SERG Outline (continued) Tools – Calculators, References, Programs Appendices
• More on Technologies
• Contract Language
• Federal Regulations
• Utility Programs
Gasifier fueled with poultry waste, WV

50
Smart Energy Resources Guide
• Solar Power Solar Power Terminology Technology Basics Assessing Solar Power Potential and Size of a PV System Grid-Tied or Stand-Alone System Capital Cost, O&M, Installers and Warranties Permits and Environmental Concerns Success Stories
Example of Chapter Detail

51
Smart Energy Resources Guide
• Tools Energy Efficiency Calculators Purchasing Clean Energy Informational Resources Renewable Energy Economic Calculators Solar Power, Wind Power, etc. Tools
Example of Chapter Detail (cont)

52
Smart Energy Resources Guide
• How RPMs Can Use the SERG
Assess possibilities for your project Info for better communication with developers/contractors Provide starting point to implement clean energy projects Reference for funding resources Quick tools for costs and emissions reduction estimates
53
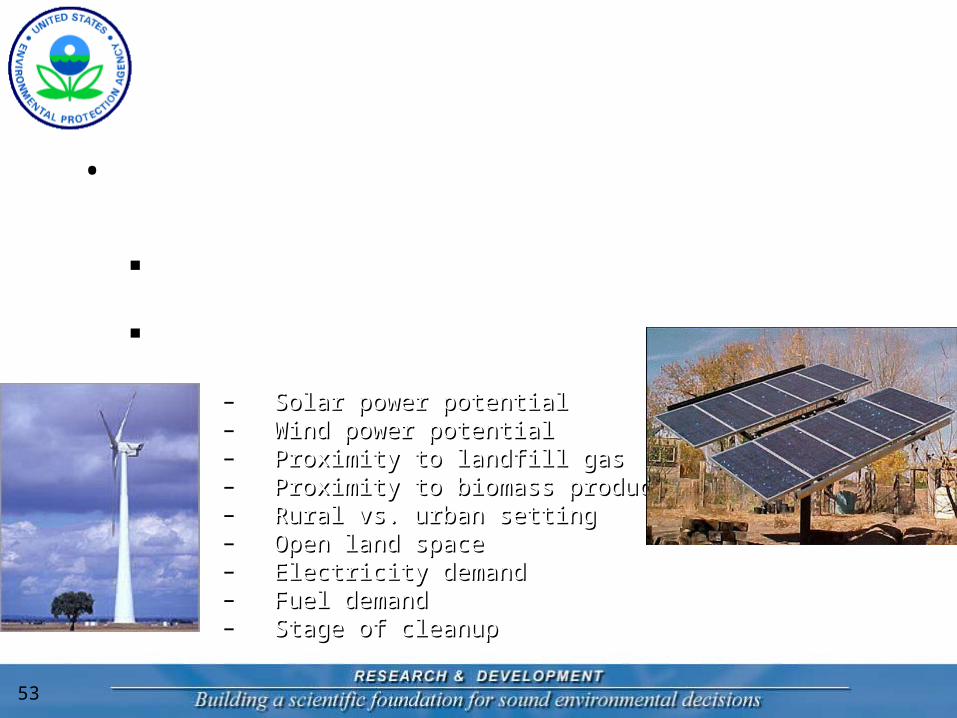
Smart Energy Resources Guide
• Next Steps
Contact RPMs using renewables & ask advice Review all Superfund sites using GIS and site-specific data
for:– Solar power potentialSolar power potential– Wind power potential Wind power potential – Proximity to landfill gas Proximity to landfill gas – Proximity to biomass productionProximity to biomass production– Rural vs. urban settingRural vs. urban setting– Open land space Open land space – Electricity demand Electricity demand – Fuel demand Fuel demand – Stage of cleanupStage of cleanup
3.6MW Turbine
Solar Tracking Unit
54
Smart Energy Resources Guide
SERG Weblink
http://www.epa.gov/nrmrl/pubs/600r08049/600r08049.htmhttp://www.epa.gov/nrmrl/pubs/600r08049/600r08049.htm
55
Smart Energy Resources Guide
• Acknowledgements
Jennifer Wang (now with Energy Solutions, Inc., Oakland, CA) Penny McDaniel (Region 9) Steve Rock (ORD, Cincinnati) Engineering Forum Thanks to numerous peer reviewers! SERG for photo credits

57
After viewing the links to additional resources, please complete our online feedback form.
Thank You
Links to Additional ResourcesLinks to Additional Resources
Feedback FormFeedback Form