24
1 Guy Caruso Administrator Energy Information Administration Georgetown University March 17, 2008 International Energy Outlook: The Future of Energy
| Date post: | 31-Dec-2015 |
| Category: |
Documents |
| Upload: | janel-jones |
| View: | 214 times |
| Download: | 0 times |
1
Guy CarusoAdministrator
Energy Information Administration
Georgetown UniversityMarch 17, 2008
International Energy Outlook:
The Future of Energy
2
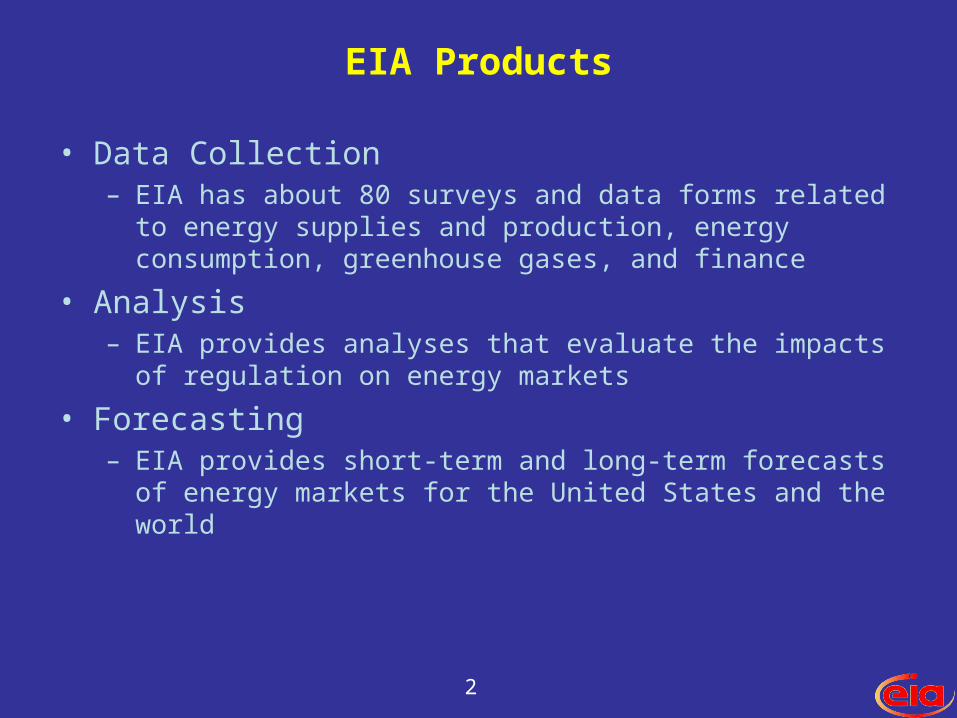
EIA Products
• Data Collection– EIA has about 80 surveys and data forms related to energy
supplies and production, energy consumption, greenhouse gases, and finance
• Analysis– EIA provides analyses that evaluate the impacts of regulation on
energy markets
• Forecasting– EIA provides short-term and long-term forecasts of energy
markets for the United States and the world
3
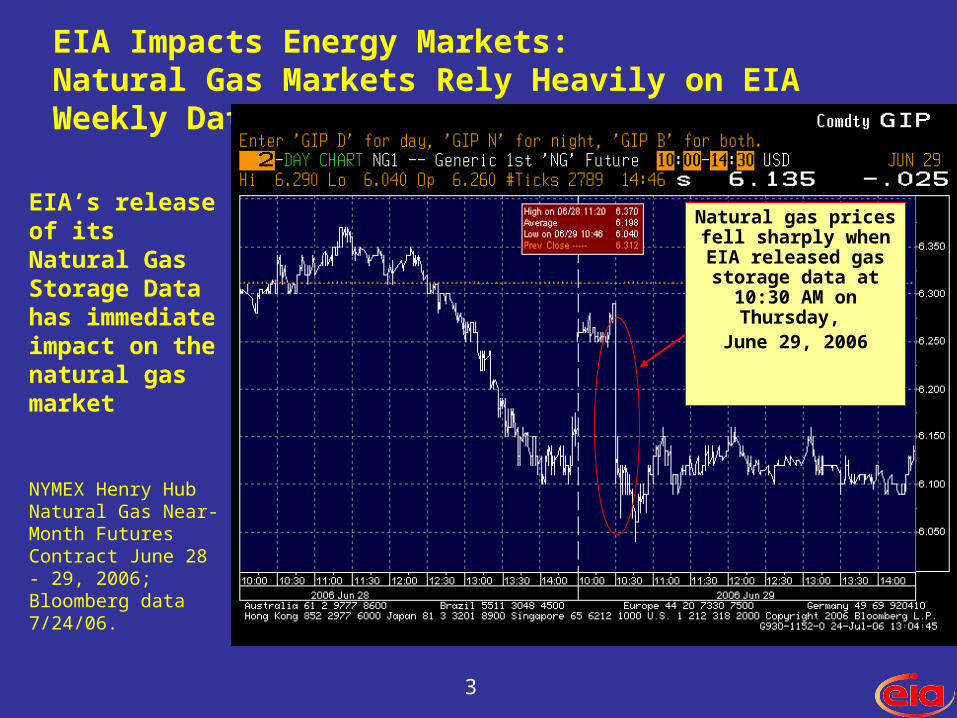
EIA Impacts Energy Markets:Natural Gas Markets Rely Heavily on EIA Weekly Data
EIA’s release of its Natural Gas Storage Data has immediate impact on the natural gas market
NYMEX Henry Hub Natural Gas Near-Month Futures Contract June 28 - 29, 2006; Bloomberg data 7/24/06.
Natural gas prices fell sharply when EIA
released gas storage data at 10:30 AM on
Thursday, June 29, 2006
4
Major Trends in the IEO2007 …
• Total world energy use rises by 57 percent in the reference case projection.
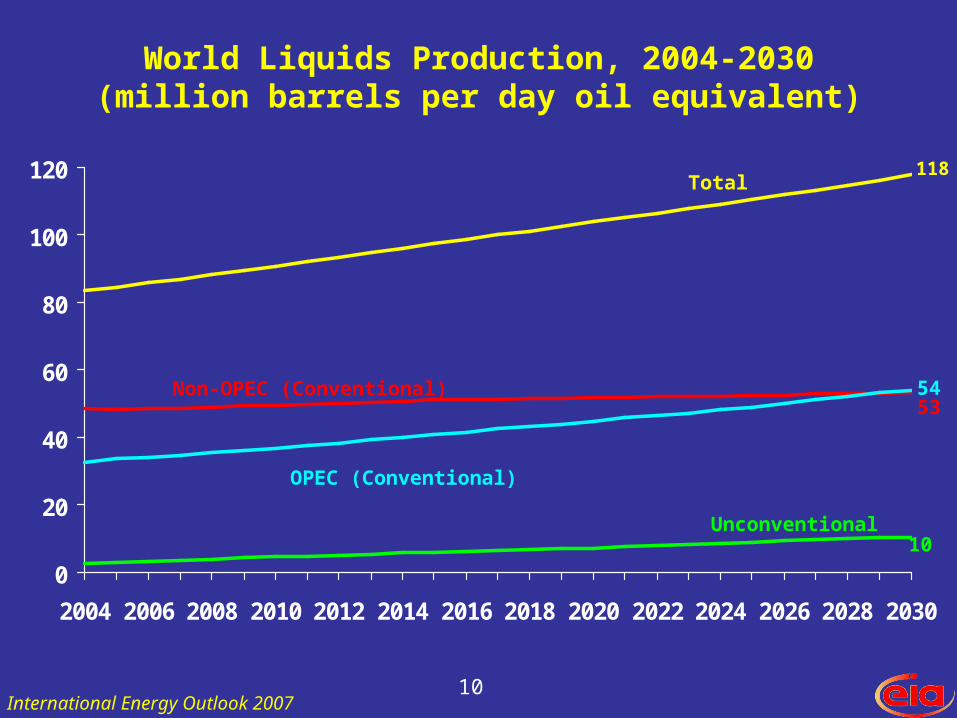
• The high world oil prices in the IEO2007 reference case are projected to make previously uneconomical, unconventional resources economical, and they provide 10.5 million barrels per day of the world supply by 2030.
• Coal is the fastest growing energy source worldwide, increasing on average by 2.2 percent per year. Natural gas and renewables each increase by an average of 1.9 percent per year. Liquid fuels grow by 1.4 percent per year.
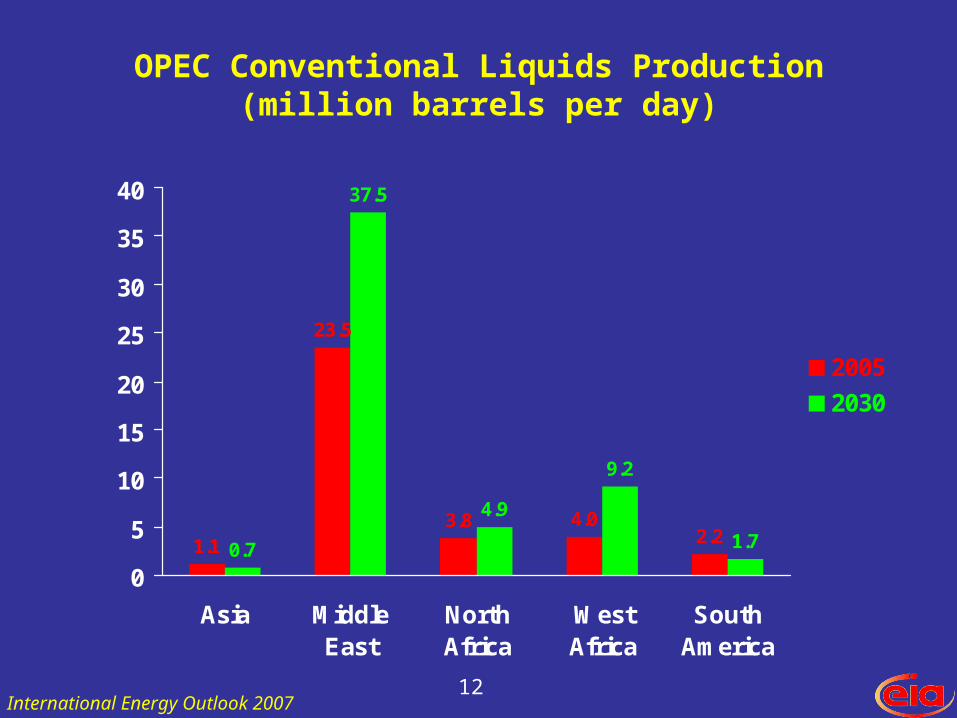
• The Middle East accounts for substantial shares of the world’s total increase for liquids, 45 percent of the world total, and natural gas, 22 percent, through 2030.
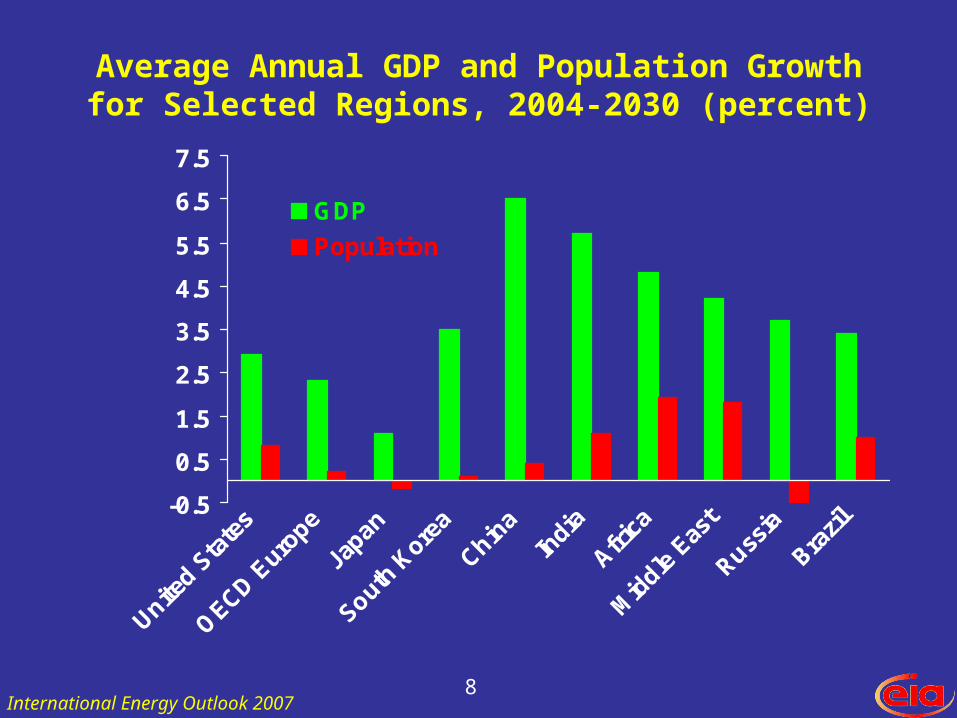
• Non-OECD Asia energy use, especially in China and India, is expected to more than double between 2004 and 2030 and will rely increasingly on the Middle East to fulfill its oil and natural gas needs.
• Higher fossil fuel prices, energy security concerns, improved reactor designs, and environmental considerations are expected to improve the prospects for nuclear power generation, which is 14 percent higher in 2030 than in the previous outlook.
• Energy-related carbon dioxide emissions are projected to rise from 26.9 billion metric tons in 2004 to 33.9 billion metric tons in 2015 and 42.9 billion metric tons in 2030.
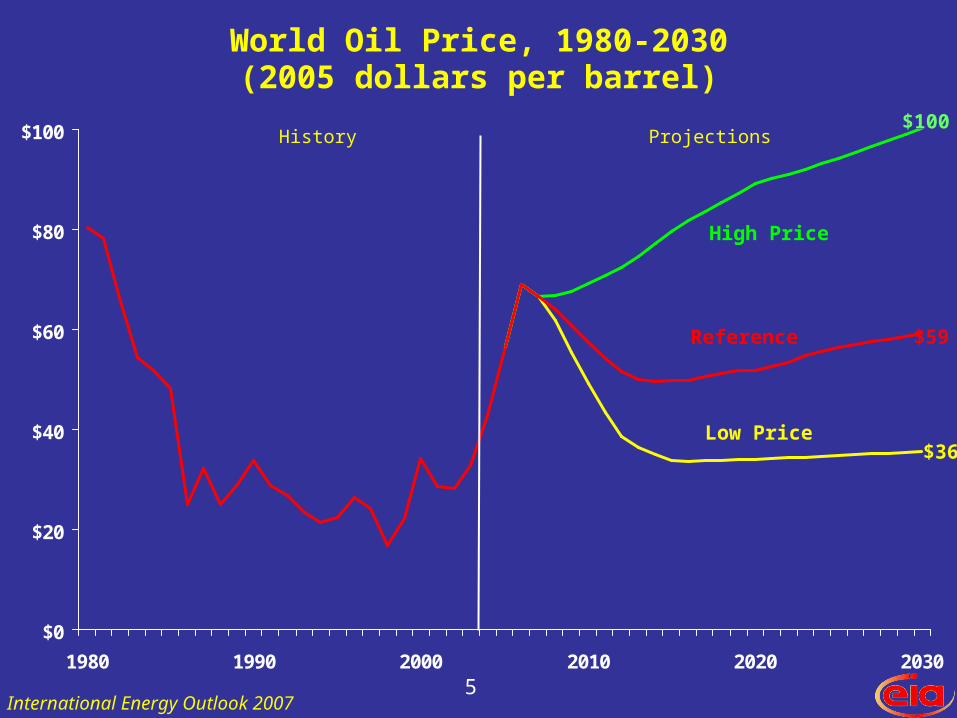
5
$0
$20
$40
$60
$80
$100
1980 1990 2000 2010 2020 2030
World Oil Price, 1980-2030(2005 dollars per barrel)
History Projections
Reference
Low Price
High Price
International Energy Outlook 2007
$100
$59
$36
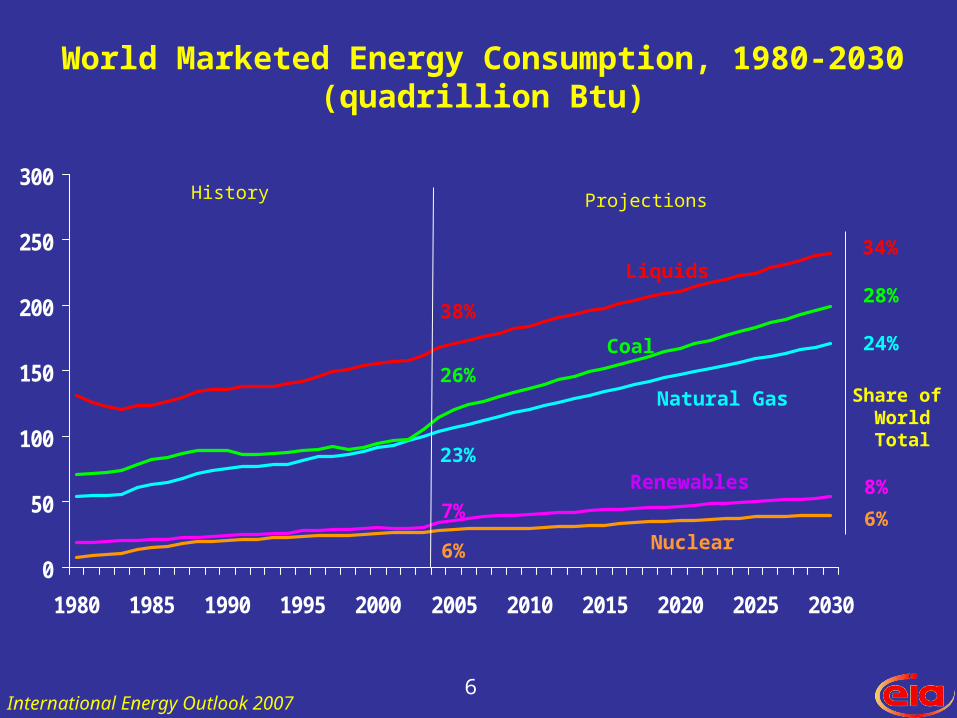
6
World Marketed Energy Consumption, 1980-2030(quadrillion Btu)
0
50
100
150
200
250
300
1980 1985 1990 1995 2000 2005 2010 2015 2020 2025 2030
Liquids
Natural Gas
Coal
Renewables
Nuclear
34%
8%
28%
6%
Share of WorldTotal
24%
38%
26%
23%
7%
6%
International Energy Outlook 2007
History Projections
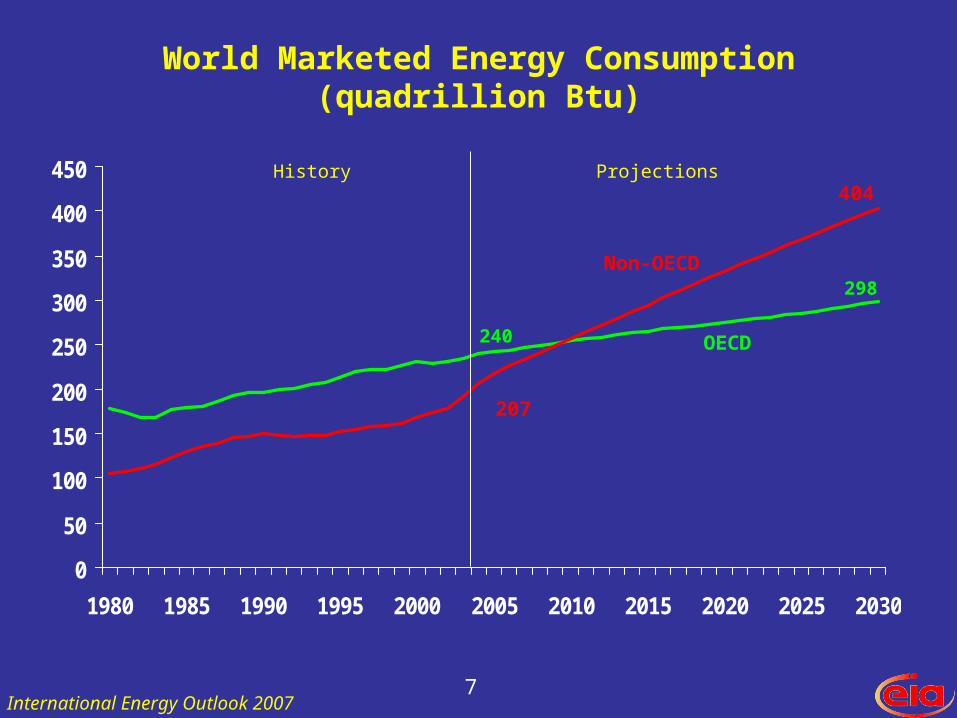
7
World Marketed Energy Consumption(quadrillion Btu)
0
50
100
150
200
250
300
350
400
450
1980 1985 1990 1995 2000 2005 2010 2015 2020 2025 2030
OECD
Non-OECD
History Projections
240
207
298
404
International Energy Outlook 2007
8
Average Annual GDP and Population Growthfor Selected Regions, 2004-2030 (percent)
-0.5
0.5
1.5
2.5
3.5
4.5
5.5
6.5
7.5
United S
tate
s
OECD E
urope
Japan
South K
orea
China
India
Africa
Mid
dle E
ast
Russia
Brazi
l
GDP
Population
International Energy Outlook 2007
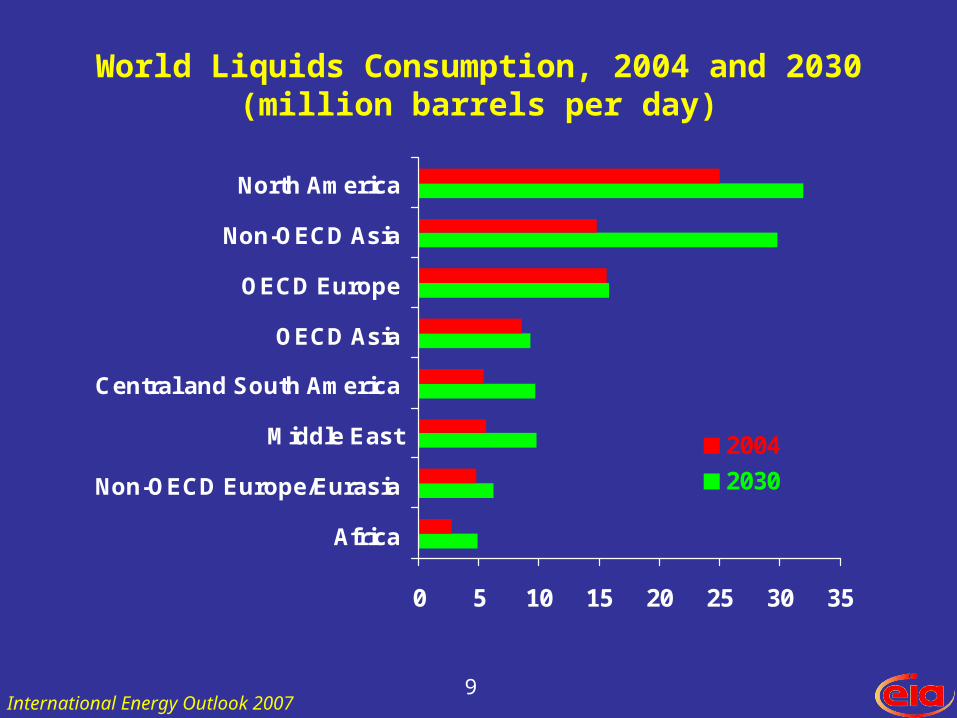
9
World Liquids Consumption, 2004 and 2030(million barrels per day)
0 5 10 15 20 25 30 35
Africa
Non-OECD Europe/Eurasia
Middle East
Central and South America
OECD Asia
OECD Europe
Non-OECD Asia
North America
2004
2030
International Energy Outlook 2007
10
World Liquids Production, 2004-2030(million barrels per day oil equivalent)
0
20
40
60
80
100
120
2004 2006 2008 2010 2012 2014 2016 2018 2020 2022 2024 2026 2028 2030
Non-OPEC (Conventional)
OPEC (Conventional)
Unconventional
Total
53
10
54
118
International Energy Outlook 2007
11
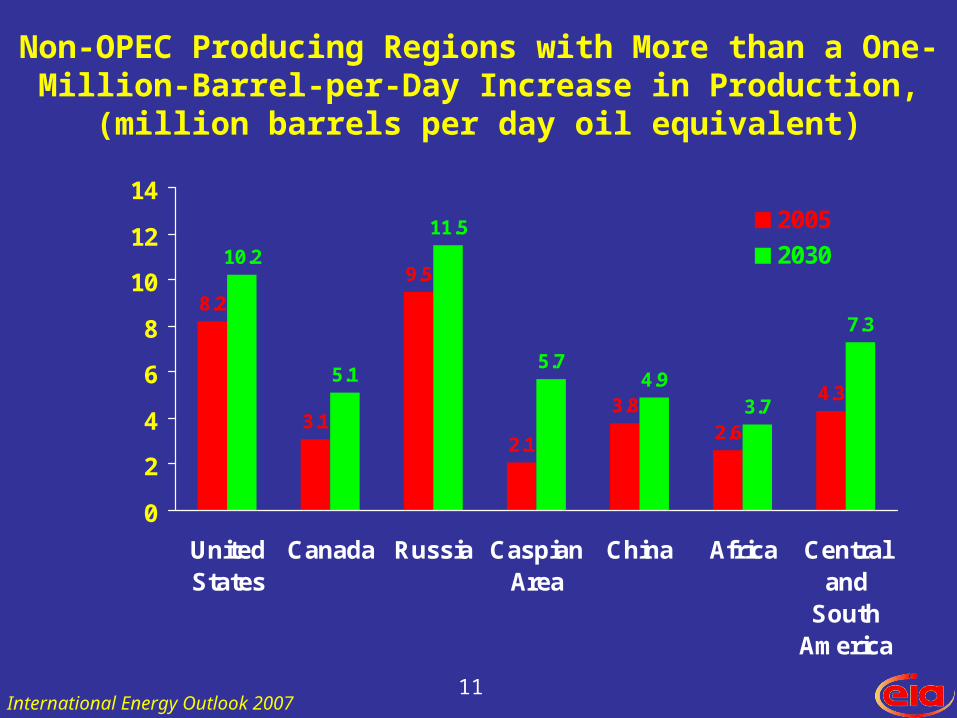
Non-OPEC Producing Regions with More than a One-Million-Barrel-per-Day Increase in Production, (million barrels per
day oil equivalent)
8.2
3.1
9.5
2.1
3.82.6
4.3
10.2
5.1
11.5
5.74.9
3.7
7.3
0
2
4
6
8
10
12
14
UnitedStates
Canada Russia CaspianArea
China Africa Centraland
SouthAmerica
2005
2030
International Energy Outlook 2007
12
OPEC Conventional Liquids Production(million barrels per day)
3.8 4.02.2
0.7
37.5
4.9
9.2
1.7
23.5
1.1
0
5
10
15
20
25
30
35
40
Asia MiddleEast
NorthAfrica
WestAfrica
SouthAmerica
2005
2030
International Energy Outlook 2007
13
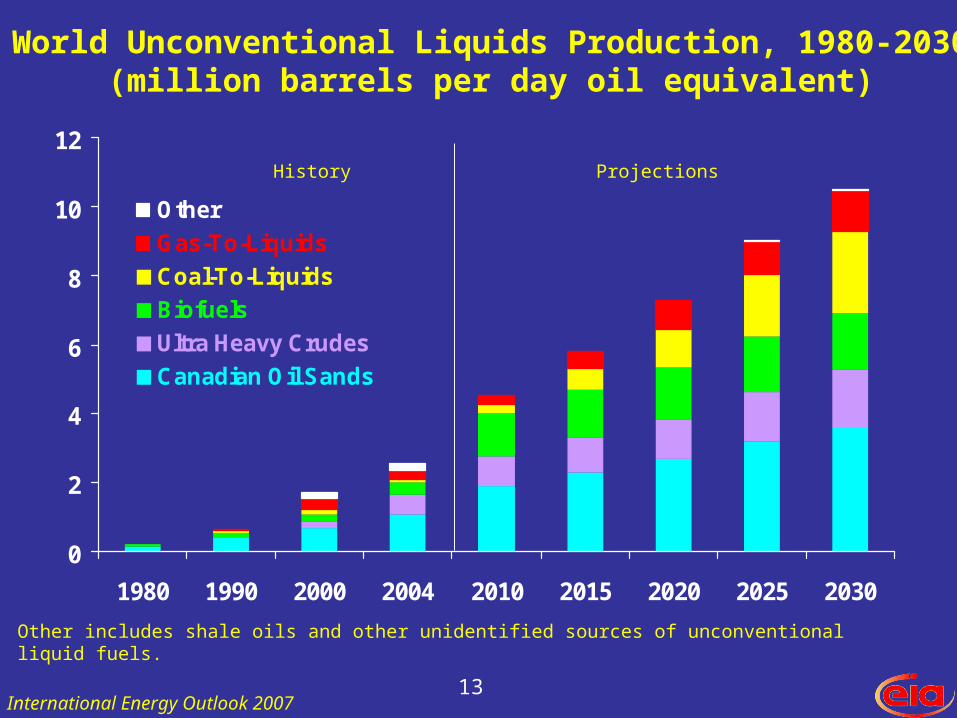
World Unconventional Liquids Production, 1980-2030(million barrels per day oil equivalent)
0
2
4
6
8
10
12
1980 1990 2000 2004 2010 2015 2020 2025 2030
Other
Gas-To-Liquids
Coal-To-Liquids
Biofuels
Ultra Heavy Crudes
Canadian Oil Sands
Other includes shale oils and other unidentified sources of unconventional liquid fuels.
International Energy Outlook 2007
History Projections
14
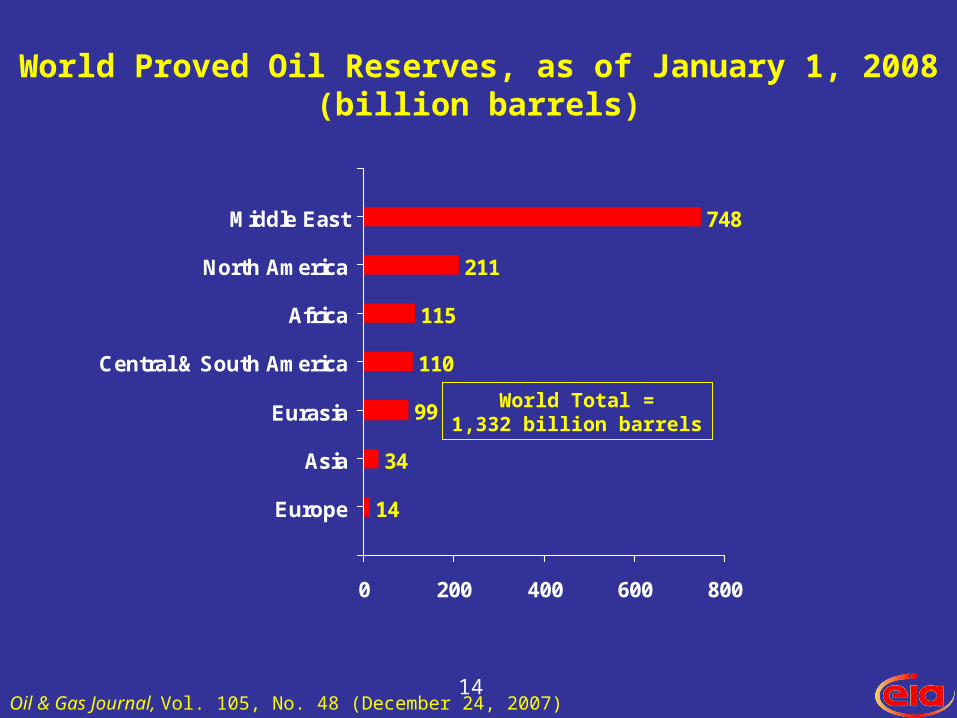
World Proved Oil Reserves, as of January 1, 2008(billion barrels)
14
34
99
110
115
211
748
0 200 400 600 800
Europe
Asia
Eurasia
Central & South America
Africa
North America
Middle East
Oil & Gas Journal, Vol. 105, No. 48 (December 24, 2007)
World Total =1,332 billion barrels
15
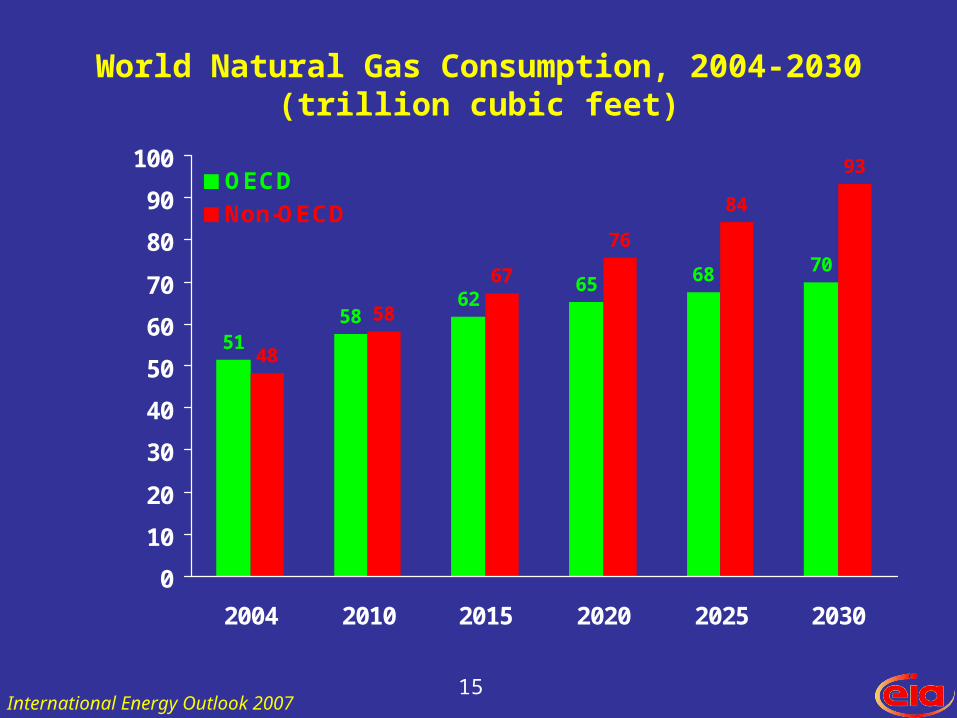
World Natural Gas Consumption, 2004-2030(trillion cubic feet)
5158
6265 68 70
48
58
67
76
84
93
0
10
20
30
40
50
60
70
80
90
100
2004 2010 2015 2020 2025 2030
OECD
Non-OECD
International Energy Outlook 2007
16
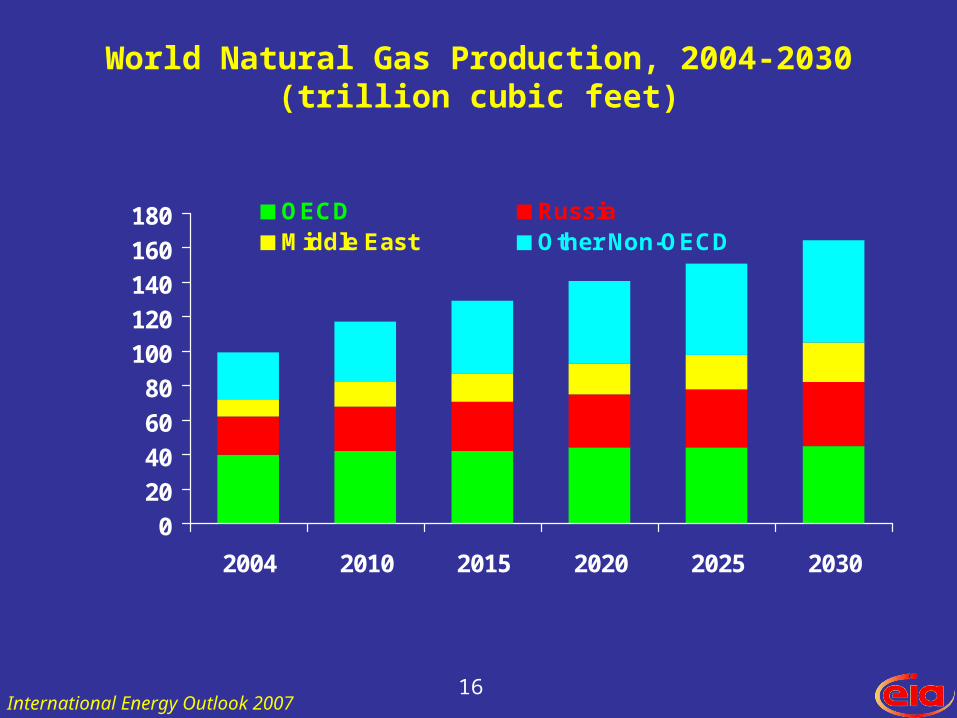
World Natural Gas Production, 2004-2030(trillion cubic feet)
0
20
40
60
80
100
120
140
160
180
2004 2010 2015 2020 2025 2030
OECD RussiaMiddle East Other Non-OECD
International Energy Outlook 2007
17
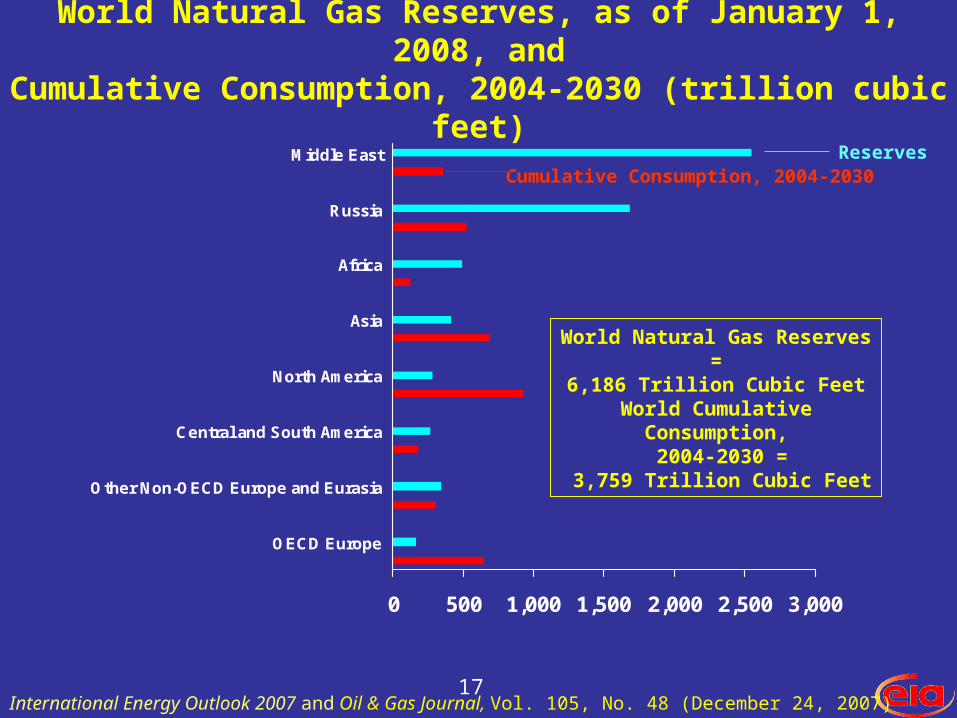
World Natural Gas Reserves, as of January 1, 2008, andCumulative Consumption, 2004-2030 (trillion cubic feet)
0 500 1,000 1,500 2,000 2,500 3,000
OECD Europe
Other Non-OECD Europe and Eurasia
Central and South America
North America
Asia
Africa
Russia
Middle East
World Natural Gas Reserves =6,186 Trillion Cubic Feet
World Cumulative Consumption, 2004-2030 =
3,759 Trillion Cubic Feet
ReservesCumulative Consumption, 2004-2030
International Energy Outlook 2007 and Oil & Gas Journal, Vol. 105, No. 48 (December 24, 2007)
18
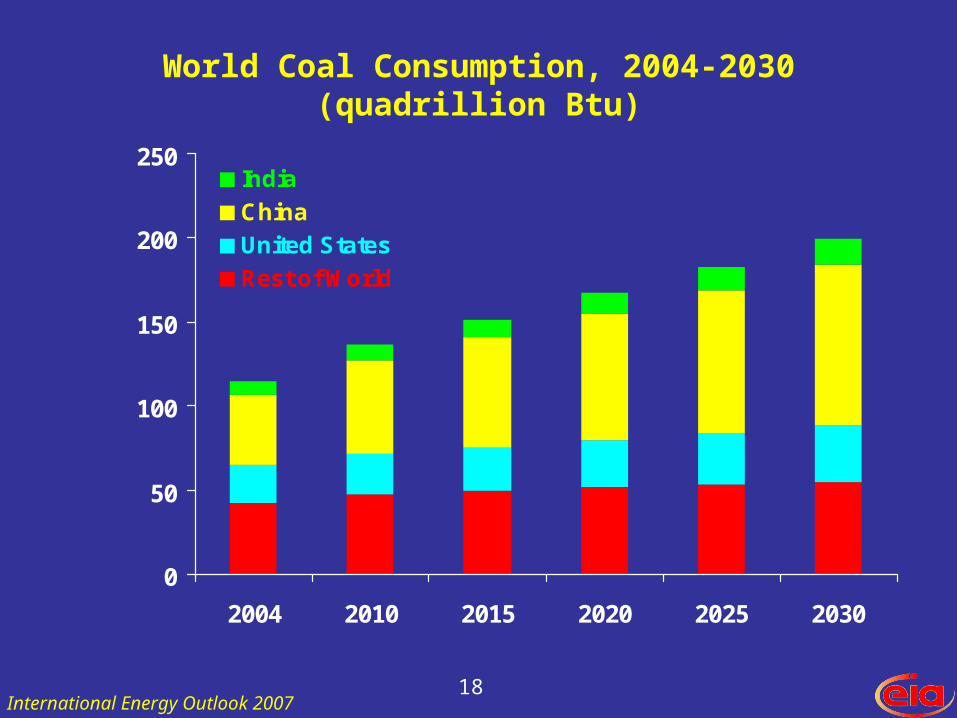
World Coal Consumption, 2004-2030(quadrillion Btu)
0
50
100
150
200
250
2004 2010 2015 2020 2025 2030
India
China
United States
Rest of World
International Energy Outlook 2007
19
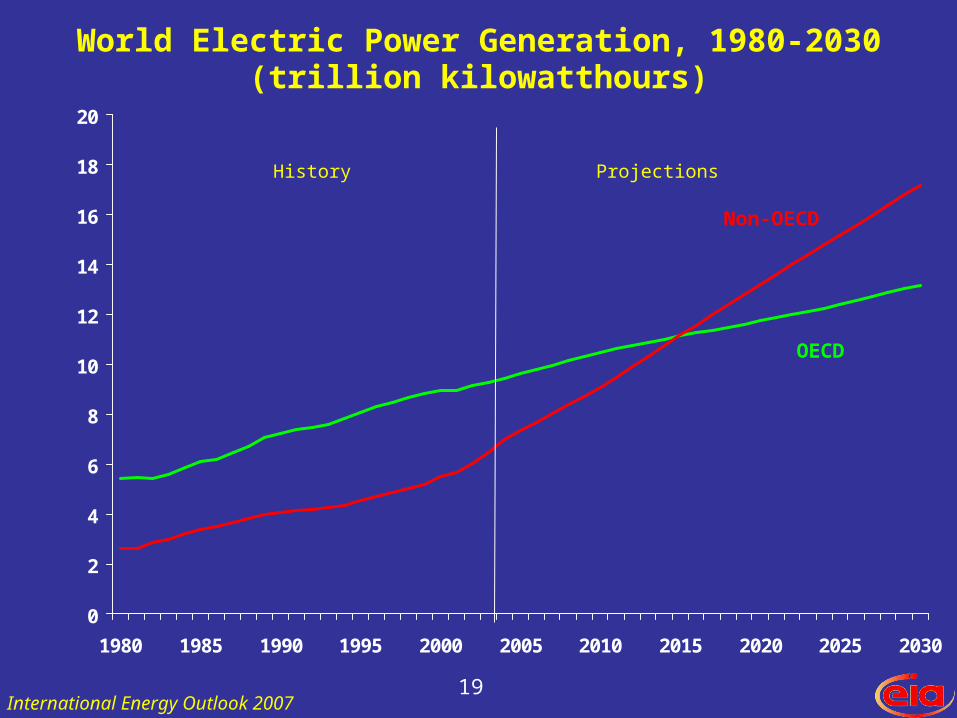
0
2
4
6
8
10
12
14
16
18
20
1980 1985 1990 1995 2000 2005 2010 2015 2020 2025 2030
World Electric Power Generation, 1980-2030(trillion kilowatthours)
Non-OECD
OECD
International Energy Outlook 2007
History Projections
20
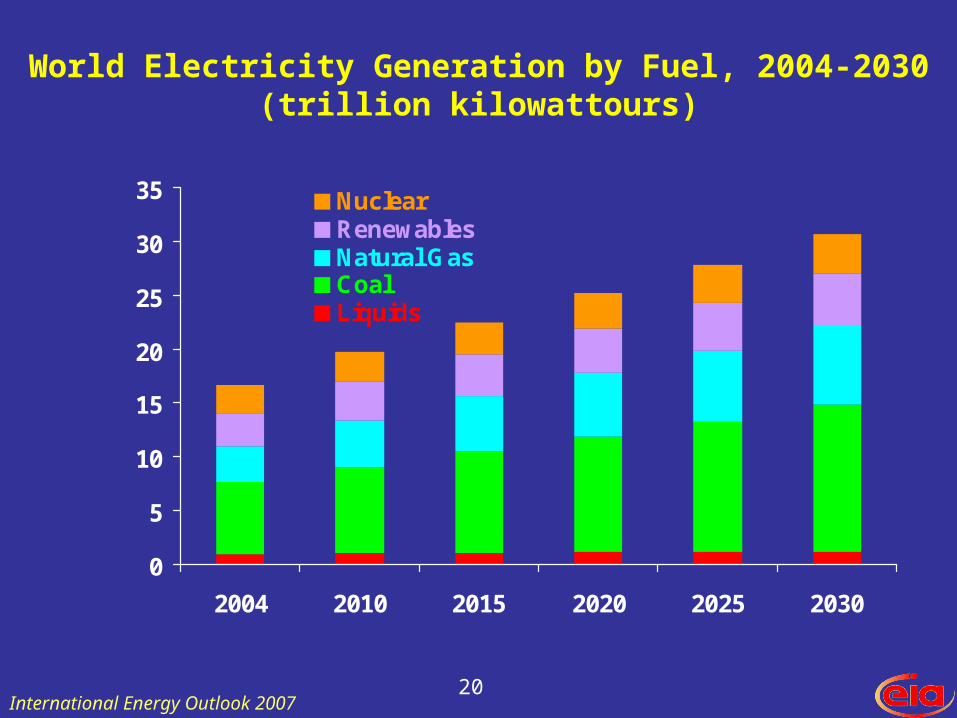
World Electricity Generation by Fuel, 2004-2030(trillion kilowattours)
0
5
10
15
20
25
30
35
2004 2010 2015 2020 2025 2030
NuclearRenewablesNatural GasCoalLiquids
International Energy Outlook 2007
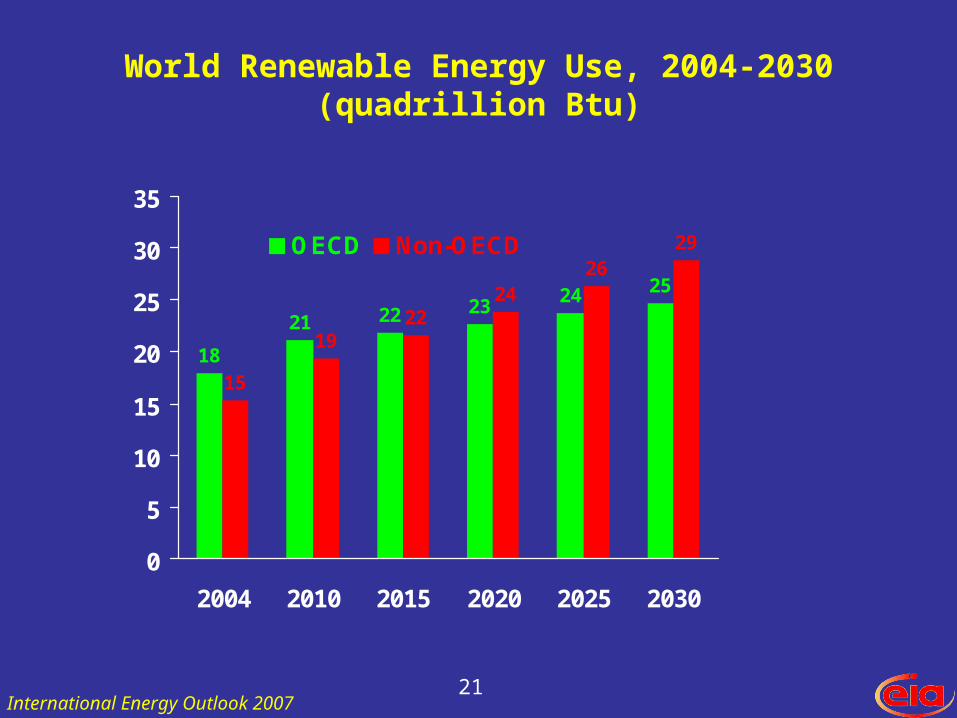
21
World Renewable Energy Use, 2004-2030(quadrillion Btu)
18
21 22 2324 25
15
1922
2426
29
0
5
10
15
20
25
30
35
2004 2010 2015 2020 2025 2030
OECD Non-OECD
International Energy Outlook 2007
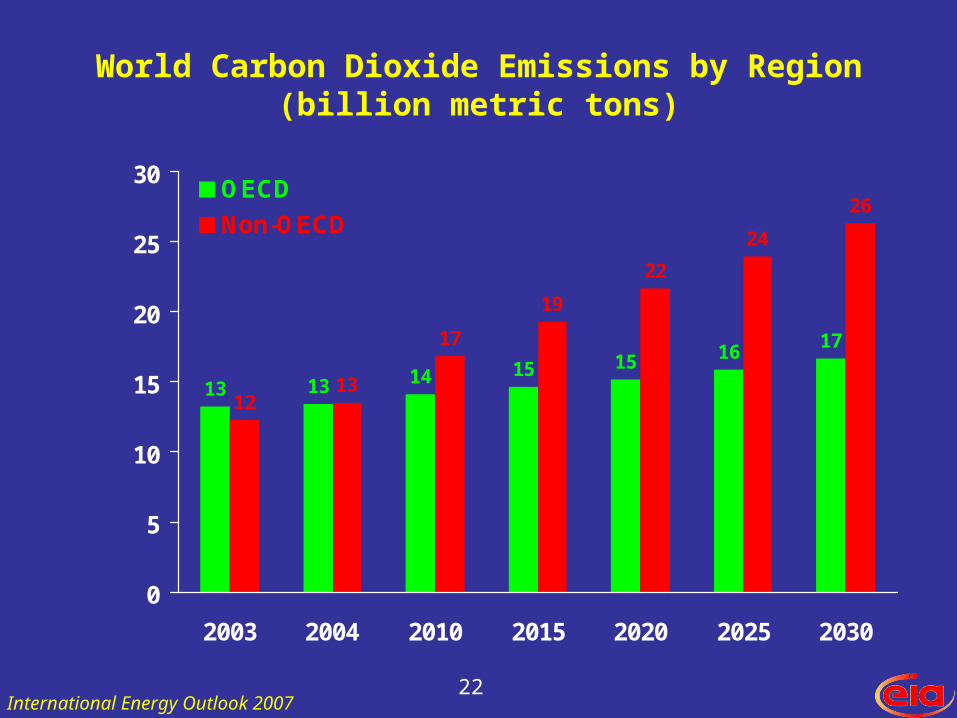
22
World Carbon Dioxide Emissions by Region(billion metric tons)
13 13 14 15 15 1617
1213
17
19
22
24
26
0
5
10
15
20
25
30
2003 2004 2010 2015 2020 2025 2030
OECD
Non-OECD
International Energy Outlook 2007
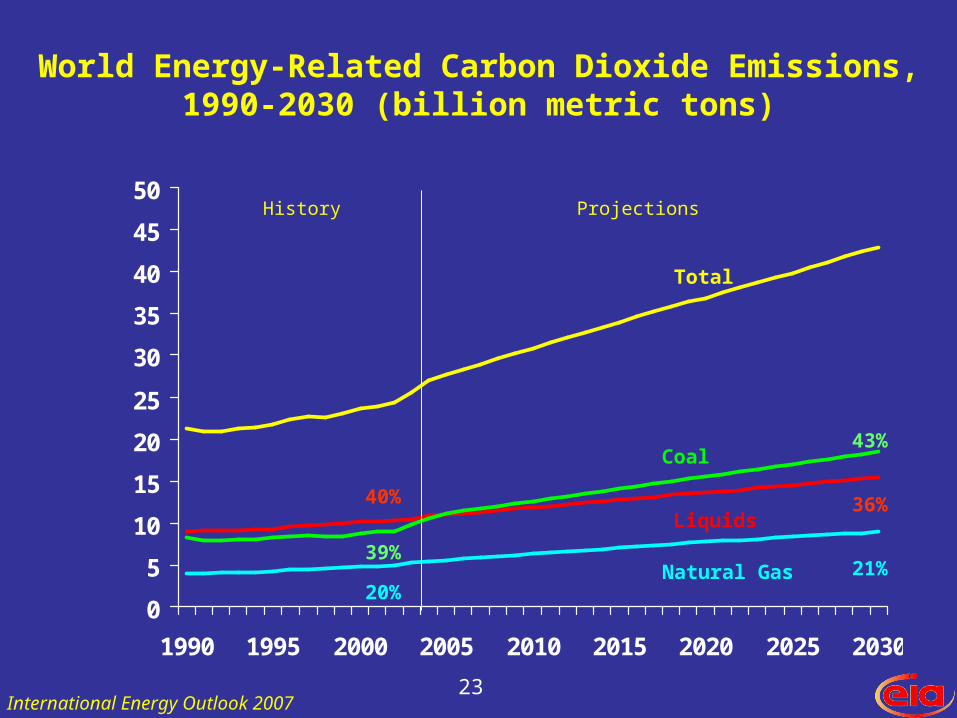
23
World Energy-Related Carbon Dioxide Emissions, 1990-2030 (billion metric tons)
0
5
10
15
20
25
30
35
40
45
50
1990 1995 2000 2005 2010 2015 2020 2025 2030
Coal
Liquids
Natural Gas
Total
International Energy Outlook 2007
History Projections
43%
39%
40%
20%
36%
21%
24
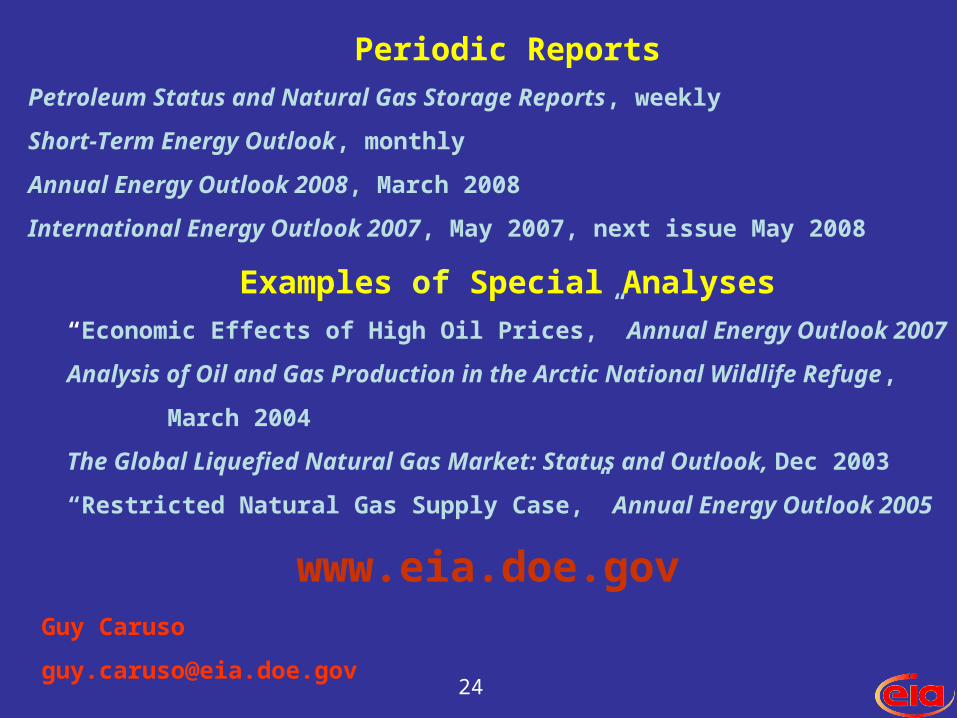
Guy Caruso
Periodic Reports
Petroleum Status and Natural Gas Storage Reports, weekly
Short-Term Energy Outlook, monthly
Annual Energy Outlook 2008, March 2008
International Energy Outlook 2007, May 2007, next issue May 2008
Examples of Special Analyses
“Economic Effects of High Oil Prices,” Annual Energy Outlook 2007
Analysis of Oil and Gas Production in the Arctic National Wildlife Refuge,
March 2004
The Global Liquefied Natural Gas Market: Status and Outlook, Dec 2003
“Restricted Natural Gas Supply Case,” Annual Energy Outlook 2005
www.eia.doe.gov


