1 Health Reform Law & Texas Early Overview of PPACA (HR 3590, as amended by HR 4872) April 15, 2010 Legislative Study Group House Caucus Texas Legislative Black Caucus Mexican American Legislative Caucus Anne Dunkelberg, Associate Director, [email protected]Stacey Pogue, Senior Policy Analyst, [email protected]Center for Public Policy Priorities – www.cppp.org www.texasvoiceforhealthreform.org
Transcript
1
Health Reform Law & Texas Early Overview of PPACA
(HR 3590, as amended by HR 4872)
April 15, 2010
Legislative Study Group House CaucusTexas Legislative Black Caucus
Center for Public Policy Priorities – www.cppp.org
www.texasvoiceforhealthreform.org
2
• Focus is on coverage expansion, insurance regulation reforms, state functions and potential costs
• Immediate Benefits of Reform• Medicare Improvements• Insurance Reforms: Now and 2014 • Affordable Coverage: 2014• Individual and Employer Responsibility: 2014• State Government & Budget Roles, Impact
Today’s Format
3
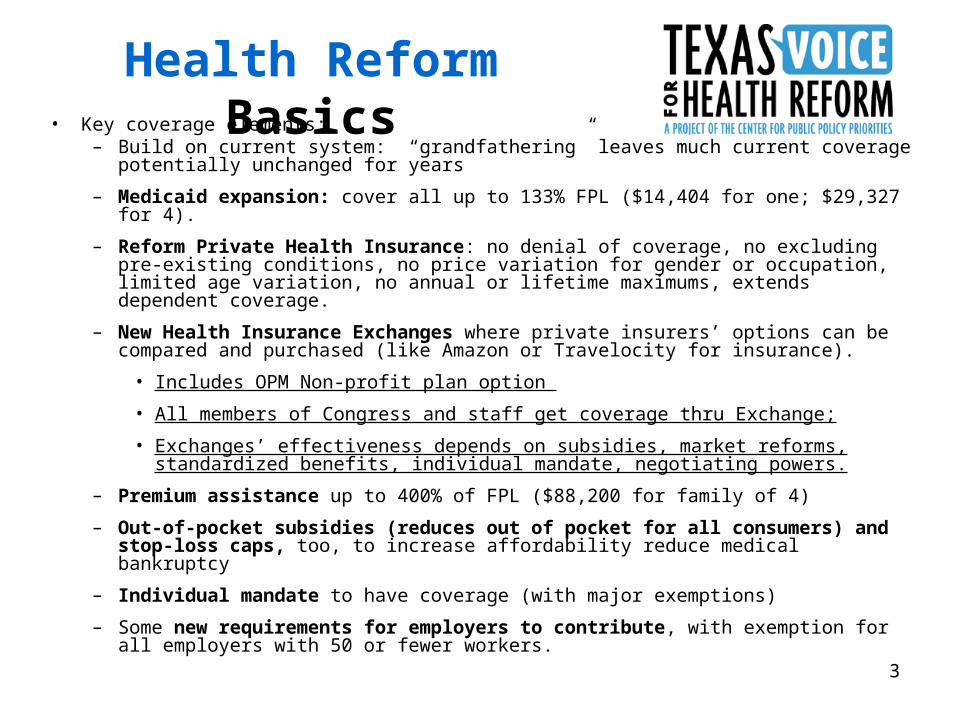
• Key coverage elements:– Build on current system: “grandfathering” leaves much current coverage potentially
unchanged for years
– Medicaid expansion: cover all up to 133% FPL ($14,404 for one; $29,327 for 4).
– Reform Private Health Insurance: no denial of coverage, no excluding pre-existing conditions, no price variation for gender or occupation, limited age variation, no annual or lifetime maximums, extends dependent coverage.
– New Health Insurance Exchanges where private insurers’ options can be compared and purchased (like Amazon or Travelocity for insurance).
• Includes OPM Non-profit plan option
• All members of Congress and staff get coverage thru Exchange;
– Premium assistance up to 400% of FPL ($88,200 for family of 4)
– Out-of-pocket subsidies (reduces out of pocket for all consumers) and stop-loss caps, too, to increase affordability reduce medical bankruptcy
– Individual mandate to have coverage (with major exemptions)
– Some new requirements for employers to contribute, with exemption for all employers with 50 or fewer workers.
Health Reform Basics
4
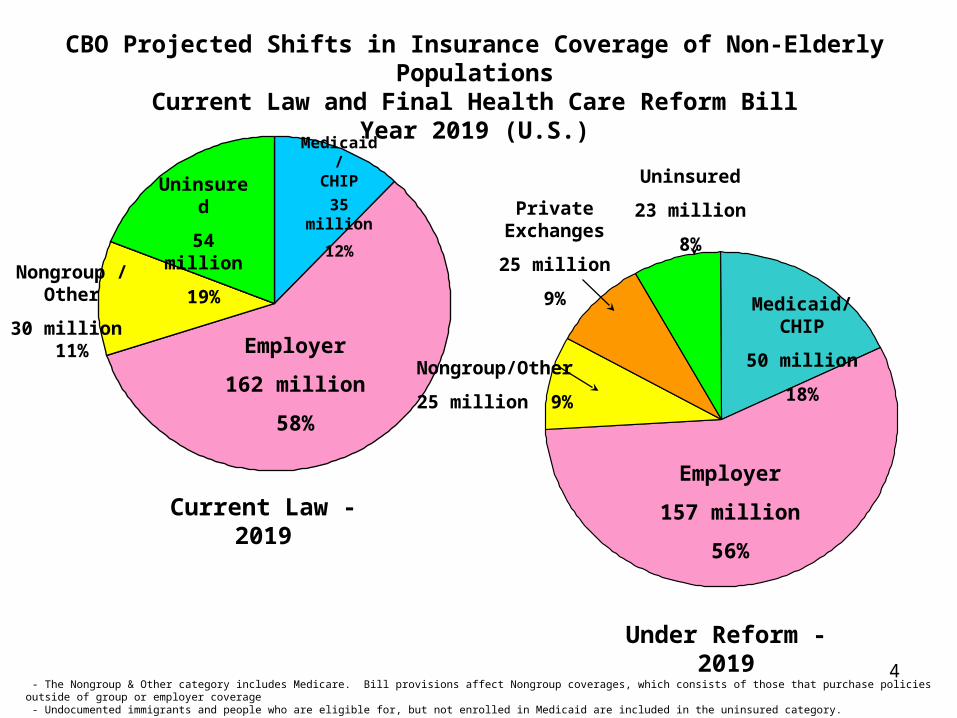
Under Reform - 2019
Employer
157 million
56%
Medicaid/CHIP
50 million
18%Nongroup/Other
25 million 9%
Private Exchanges
25 million
9%
Uninsured
23 million
8%
CBO Projected Shifts in Insurance Coverage of Non-Elderly PopulationsCurrent Law and Final Health Care Reform Bill
Year 2019 (U.S.)
Employer
162 million
58%
Medicaid/CHIP
35 million
12%
Uninsured
54 million
19%Nongroup /
Other
30 million 11%
Current Law - 2019
- The Nongroup & Other category includes Medicare. Bill provisions affect Nongroup coverages, which consists of those that purchase policies outside of group or employer coverage - Undocumented immigrants and people who are eligible for, but not enrolled in Medicaid are included in the uninsured category. Source: Congressional Budget Office and the Joint Committee on Taxation
5
New Benefits and Protections in your Health Insurance CoverageThe following provisions take effect at policy renewal starting on September 23, 2010:
• No lifetime caps (All plans). Restrictions placed on annual limits in new plans.
• Prohibits denial of coverage for children based on pre-existing conditions and pre-existing condition waiting periods for kids. (All)
• Prohibits rescission—retroactive cancellation of coverage—except for fraud. (All)• Dependent allowed on parent’s plan until 26th birthday (even if married). (All)• Bans co-pays or other out-of-pocket expenses for preventive care. (New plans)• No employer policies favoring higher-wage workers for coverage eligibility. (New)• New independent review process for appeals. (New)• Direct access to pediatricians and OBGYNs without referral. (New)• Out-of-network emergency care covered at in-network cost-sharing rates. (New)
Ensuring Reasonable Rates• 2010: HHS Secretary and states establish process for annual review of rate
increases. (New state-regulated plans). Grants available to states. • 2011: Requires insurers to devote 80-85% of premiums to medical benefits or
provide rebates to consumers. (All state-regulated plans)
First-Year Reforms
6
These provisions take effect within the first year:
• New nationwide interim high-risk pool coverage for uninsured individuals with pre-existing conditions (July 2010).
• Small employer tax credits available. Up to 35% of premium cost.• New interim re-insurance for early retirees (age 55-64) (June/July 2010).
• Grants available to states to establish on Office of Health Insurance Consumer Assistance or Health Insurance Ombudsman.
• Grants available to states to establish health insurance exchanges
• Begins new $11 billion investment in Community Health Centers.
• New funding for training primary care docs, nurses, other professionals.
• Medicare improvements.
First-Year Reforms, cont’d
7
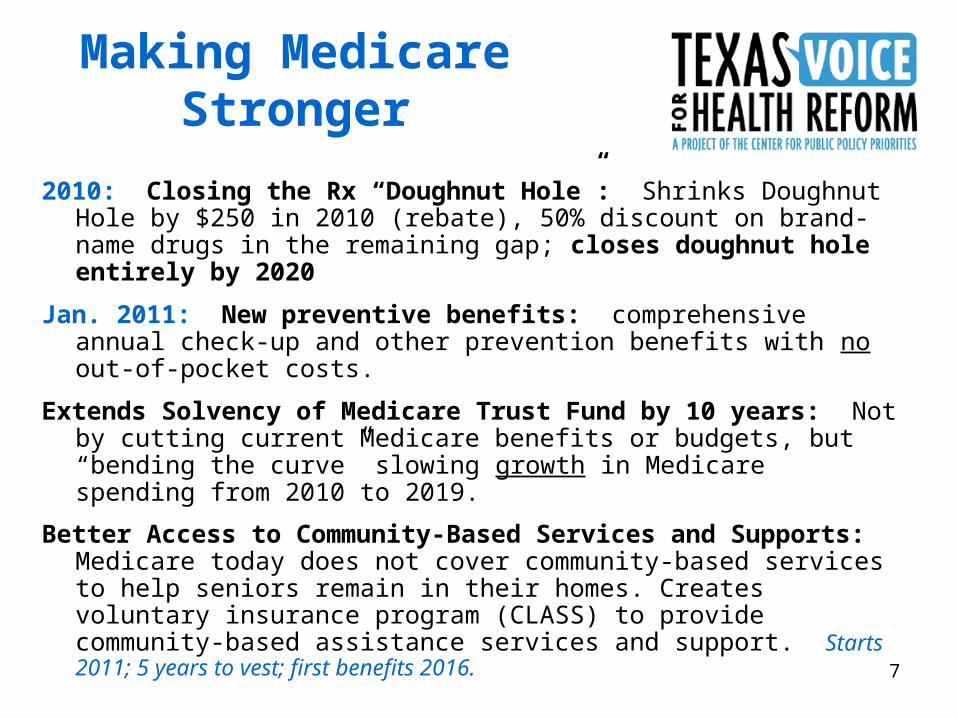
2010: Closing the Rx “Doughnut Hole”: Shrinks Doughnut Hole by $250 in 2010 (rebate), 50% discount on brand-name drugs in the remaining gap; closes doughnut hole entirely by 2020
Jan. 2011: New preventive benefits: comprehensive annual check-up and other prevention benefits with no out-of-pocket costs.
Extends Solvency of Medicare Trust Fund by 10 years: Not by cutting current Medicare benefits or budgets, but “bending the curve” slowing growth in Medicare spending from 2010 to 2019.
Better Access to Community-Based Services and Supports: Medicare today does not cover community-based services to help seniors remain in their homes. Creates voluntary insurance program (CLASS) to provide community-based assistance services and support. Starts 2011; 5 years to vest; first benefits 2016.
Making Medicare Stronger
8
Private Health Insurance Reforms– Bans pre-existing condition exclusions for everyone (All, incl.
grandfathered, ERISA).
– New plans cannot deny coverage or charge more because of health status.
– Insurers must offer coverage to everyone and renew all policies in the individual and small employer market.
– Premiums for individuals and small businesses cannot be based on gender, number of people in group, occupation, etc.
– Premiums for individuals and small businesses can vary based on age (3:1 limit), tobacco use (1.5:1 limit), geographic area, and family composition.
– New coverage for individuals and small businesses must include “essential benefits” and cap out-of-pocket cost sharing.
– No annual limits on essential benefits in all plans.
– No waiting periods in group coverage over 90 days.
2014: Good Coverage at a Fair Price
9
New Health Insurance Exchanges• Competitive markets for health insurance with clear and comparable information
on coverage options (like Travelocity, but for insurance).• State-based, with federal fallback (Feds decide whether states are on track as of 1/1/2013)
• Members of Congress and staff will get coverage in Exchange.• Open to:
– Individuals: U.S. citizens or legal immigrants and are not incarcerated– Small businesses with <100 employees, 2014-2016. States may open up to firms
with >100 employees in 2017. • Office of Personnel Management multi-state plan in Exchange. • Premium credits available only in Exchange.• Plan in Exchange must meet standards, and each plan will have a rating
indicating relative value.• Coverage with essential benefit package offered in five benefit tiers: platinum,
gold, silver, bronze, and catastrophic available to people under age 30.• Federal grants available through 2014 for start-up. Must be self-sustaining by
2015.
2016: State compacts to allow sales across state lines in participating states.
2014: Good Coverage at a Fair Price
10
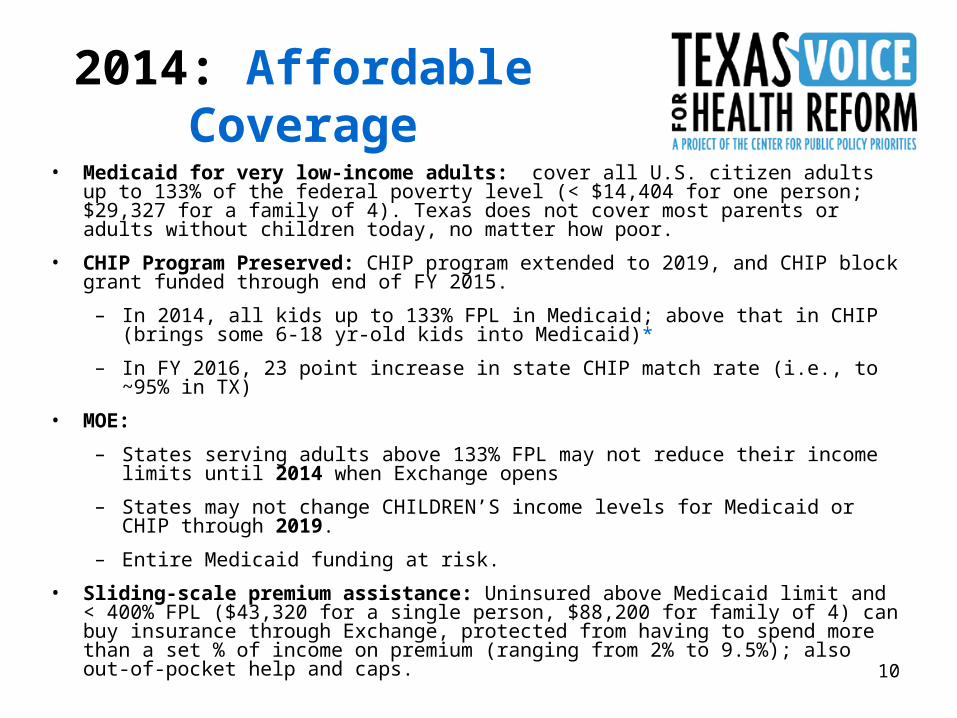
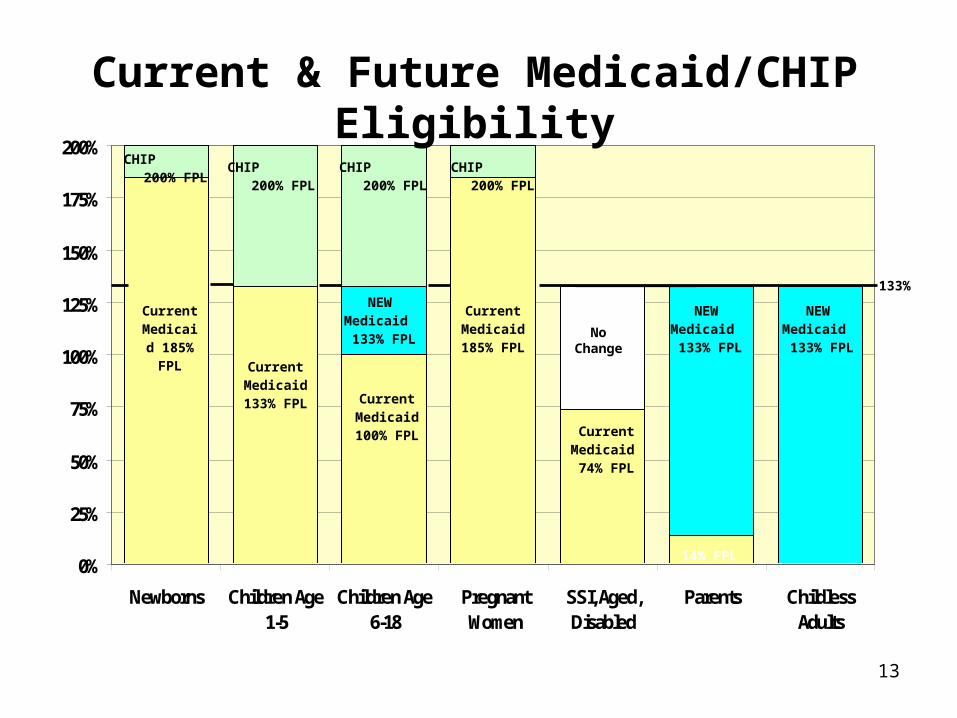
• Medicaid for very low-income adults: cover all U.S. citizen adults up to 133% of the federal poverty level (< $14,404 for one person; $29,327 for a family of 4). Texas does not cover most parents or adults without children today, no matter how poor.
• CHIP Program Preserved: CHIP program extended to 2019, and CHIP block grant funded through end of FY 2015.
– In 2014, all kids up to 133% FPL in Medicaid; above that in CHIP (brings some 6-18 yr-old kids into Medicaid)*
– In FY 2016, 23 point increase in state CHIP match rate (i.e., to ~95% in TX)
• MOE:
– States serving adults above 133% FPL may not reduce their income limits until 2014 when Exchange opens
– States may not change CHILDREN’S income levels for Medicaid or CHIP through 2019.
– Entire Medicaid funding at risk.
• Sliding-scale premium assistance: Uninsured above Medicaid limit and < 400% FPL ($43,320 for a single person, $88,200 for family of 4) can buy insurance through Exchange, protected from having to spend more than a set % of income on premium (ranging from 2% to 9.5%); also out-of-pocket help and caps.
2014: Affordable Coverage
11
Income Caps for Texas Medicaid and CHIP, 2009
0%
50%
100%
150%
200%
250%
PregnantWomen
Newborns Age 1-5 Age 6-18 TANFparent of
2, noincome
WorkingParent of
2
SSI (agedor
disabled)
LongTermCare
CHIP
Mandatory Optional
$24,352/yr
$33,874/yr $33,874/yr
185% 185%
133%
$18,310
100%$2,256 $3,696
12.3% 20.2%74%
$7,884
222%
$24,264$36,620
200%
Income Limit as Percentage of Federal Poverty IncomeAnnual Income is for a family of 3,
except Individual Incomes shown for SSI and Long Term Care
for families up to 250% FPL (< $27,075 for one person, and $55,125 for a family of 4) covered through Exchange.
• Out-of-pocket caps for ALL persons with high medical expenses: – New individual and group coverage, including new self-insured plans,
must include annual out-of-pocket caps $5,950 individual, $11,900 family, setting upper limit for families 400% FPL.
– Based on fed law health savings acct (HSA) caps, $5,950 indiv./$11,900 family in 2010 and updated annually.
– For individuals/families <400% FPL, OOPC is set as a fraction of the HSA cap.
• Families 133-400% FPL still have 17-20% of income/yr. at risk
Affordable Coverage, Continued
15
Premium Help: Max % of Family Income for Premiums in Exchange
9.5%$88,000
(400% FPL)
$77,000
9.5%$77,000
(350% FPL)
$66,000
8.1-9.5%$66,000
(300% FPL)
$55,000
6.3-8.1%$55,000
(250% FPL)
$44,000
4.0-6.3%$44,000
(200% FPL)
$33,000
3.0-4.0%$33,000
(150% FPL)
$29,000
2.0-3.0% $29,000
(133% FPL)
$22,000
(100% FPL)
To:From:
Max % Income for
Premiums
Income for a Family of Four
16
Out-of-Pocket Costs: Share of Health Costs Covered
under Exchange Plans
70%$88,000
(400% FPL)
$77,000
2/3 of HSA:
$3,987/indiv.
$7,973/family
70%$77,000
(350% FPL)
$66,000
70%$66,000
(300% FPL)
$55,000
½ of HSA:
$2,975/indiv.
$5,950/family
73%$55,000
(250% FPL)
$44,000
85%$44,000
(200% FPL)
$33,000
1/3 of HSA: $1,983/indiv.
$3,967/family
94%$33,000
(150% FPL)
$29,000
To:From:
Out of Pocket MAX as %
of income (not incl.
premiums)
Avg. Share of
Costs Covered
Income for a Family of Four
17
Other Significant Medicaid Changes
• Asset limits abolished for all but aged and disabled Medicaid (“MEPD” in TX), effective 2014
• Expansion adults will get a benchmark benefit plan,
• New gross income standard (MAGI) with 5% “standard deduction”,
• Medicaid until 26th birthday for all youth formerly in foster care for 6 mo. + (2014)
• CHIP allowed for state employee kids if premium/cost share exceeds 5% of income, based on July 1997 out-of-pocket costs (updated for inflation); i.e., state cannot increase family costs to take advantage.
• Cost reduction: states will get higher rebates for Medicaid Rx
• New Options: – New medical home benefit for enrollees with 2+ chronic conditions (2 years 90%
match)
– State Plan optional HCS benefit (not waiver) up to 3X SSI, tied to “higher need”
– Community First Choice option, enhanced match rate (interaction with optional HCS not clear yet)
18
Medicaid Eligibility and Enrollment Issues
• Capacity of state eligibility system?– Must accommodate both expansion & increased participation
– Smooth interface with Health Insurance Exchange system
– Exchange could contract with HHSC do income eligibility for subsidies; must pay if so.
– Medicaid must offer online, in person, telephone and mail application options.
– “No Wrong Door” coordination between Exchange and Medicaid required, including a joint application and enrollment website that functions for Medicaid, Exchange, and CHIP.
– MAY be able to use prior year tax return for documentation. (used for Exchange tax credit eligibility)
19
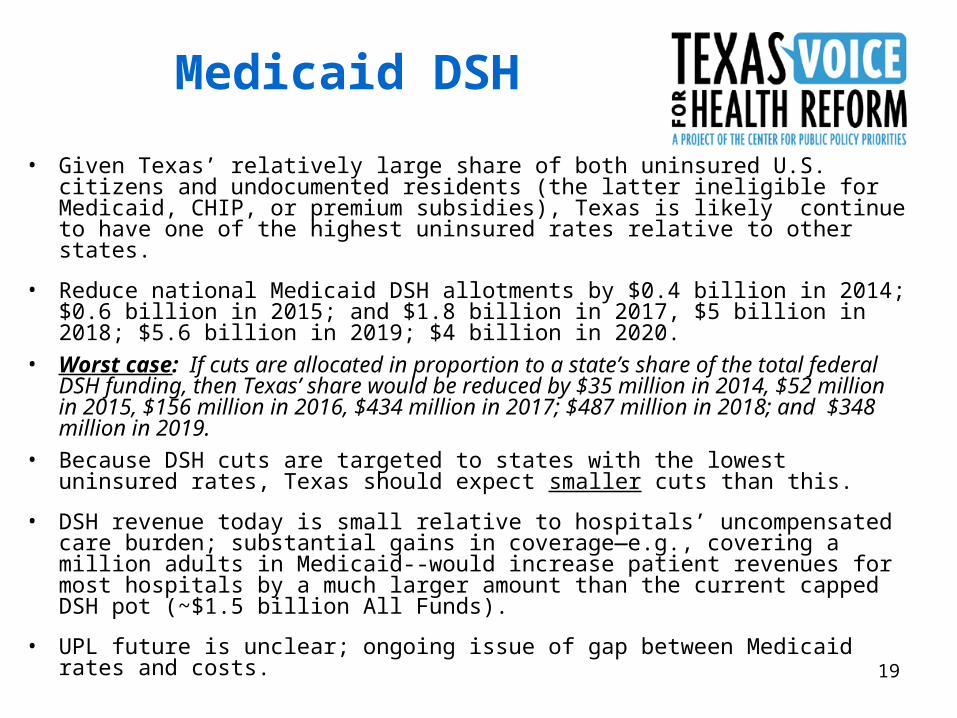
Medicaid DSH
• Given Texas’ relatively large share of both uninsured U.S. citizens and undocumented residents (the latter ineligible for Medicaid, CHIP, or premium subsidies), Texas is likely continue to have one of the highest uninsured rates relative to other states.
• Reduce national Medicaid DSH allotments by $0.4 billion in 2014; $0.6 billion in 2015; and $1.8 billion in 2017, $5 billion in 2018; $5.6 billion in 2019; $4 billion in 2020.
• Worst case: If cuts are allocated in proportion to a state’s share of the total federal DSH funding, then Texas’ share would be reduced by $35 million in 2014, $52 million in 2015, $156 million in 2016, $434 million in 2017; $487 million in 2018; and $348 million in 2019.
• Because DSH cuts are targeted to states with the lowest uninsured rates, Texas should expect smaller cuts than this.
• DSH revenue today is small relative to hospitals’ uncompensated care burden; substantial gains in coverage—e.g., covering a million adults in Medicaid--would increase patient revenues for most hospitals by a much larger amount than the current capped DSH pot (~$1.5 billion All Funds).
• UPL future is unclear; ongoing issue of gap between Medicaid rates and costs.
20
• Keeping coverage affordable requires spreading risk over large pool that includes healthy people; individual responsibility to get insurance makes this possible.
• Individual mandate: Starting 2014, most U.S. citizens and legal residents will be required to obtain coverage meeting minimum standards for themselves and for their dependents.
• Who Is Exempt? No penalty for these:
(1) uninsured if lowest-price Exchange plan costs > 8% of family income;
(2) anyone with income below the tax filing threshold ($9,350 indiv./$18,700 couple in 2009)
(3) excused for financial hardship (to be defined);
(4) religious objectors;
(5) Native Americans;
(6) undocumented immigrants (also ineligible for Medicaid or premium help);
(7) incarcerated persons; and
(8) those with a gap in coverage of less than 3 months.
Individual Responsibility
21
• Penalty concept: create incentive to take responsibility; funds collected also help support safety net that uninsured will rely on when sick or injured.
How it Works. Unless exempt: – federal income tax penalty is based on # uninsured in a family.– but family max is greater of: 3X individual penalty, or 2.5% of
family income, when fully phased in.– penalties phase in from 2014 to 2016: $95/1% in 2014, $325/2%
in 2015; $695/2.5% 2016.– from 2016 on $695 for adults and $375 for children under age 18.– maximum of $2,085 per family or 2.5% of income. – Annual inflation updates to penalty amounts after 2016.
Individual Responsibility
22
Penalties for the uninsured are a fraction of the cost of getting insurance.
• average annual cost of a family group insurance premium in Texas today about $13,000, so:
• the maximum family penalty of $2,085 would be less than one-sixth of the cost of insuring a family.
Individual Responsibility
23
Employer-sponsored insurance is the foundation for coverage today. Employer responsibility provisions encourage employers to maintain existing coverage.
• Strictly speaking, the law does not require employers to offer coverage.
• But does require larger employers to contribute financially if their employees get subsidized coverage in the Exchange.
• Penalties are a fraction of the cost of coverage.
• Small employers (50 or fewer full-time workers) have no obligation to provide coverage, and are exempt from penalties if they choose not to offer coverage and their workers get help in the Exchange.
Employer Responsibility
24
Penalties for firms with more than 50 full-time workers:
Employer Responsibility
The lesser of $3,000 per subsidized employee OR $2,000 for each full-time employee.
If coverage is offered, but at least 1 full-time worker gets subsidized coverage in the
Exchange (allowed if worker’s premium share exceeds 9.8%
of family income).
Annual assessment of $2,000 per full-time worker, excluding the first 30 workers from the penalty
calculation.
$2,000 penalty is ˜23% of employer’s cost for family coverage*
If NO coverage offered and at least 1 full-time employee get
subsidized coverage in the Exchange.
AssessmentPenalty Situation
*On average, Texas employers today pay 68% of the cost of family coverage, or $8,840 of a $13,000 family premium.
25
• Only one-in-three Texas small businesses offers health insurance.• Texas small employers cite cost as the primary reason they cannot
provide coverage.
• The Senate health reform bill provides tax credits to small businesses to help them afford coverage.
– Eligibility: Small firms with 25 or fewer employees, average annual wages under $50,000, and employer covers 50% of the premium cost.
– Phase I, 2010-2013: Max credit of 35% of employer’s cost for businesses, and 25% for nonprofits.
– Phase II, 2014 and on: Max credit of 50% of employer’s cost for coverage through the Exchange, and 35% credit for nonprofits. Available for two years.
– Max credit is available to small employers with 10 or fewer employees and average wages under $25,000, with phase out as size and wages increase.
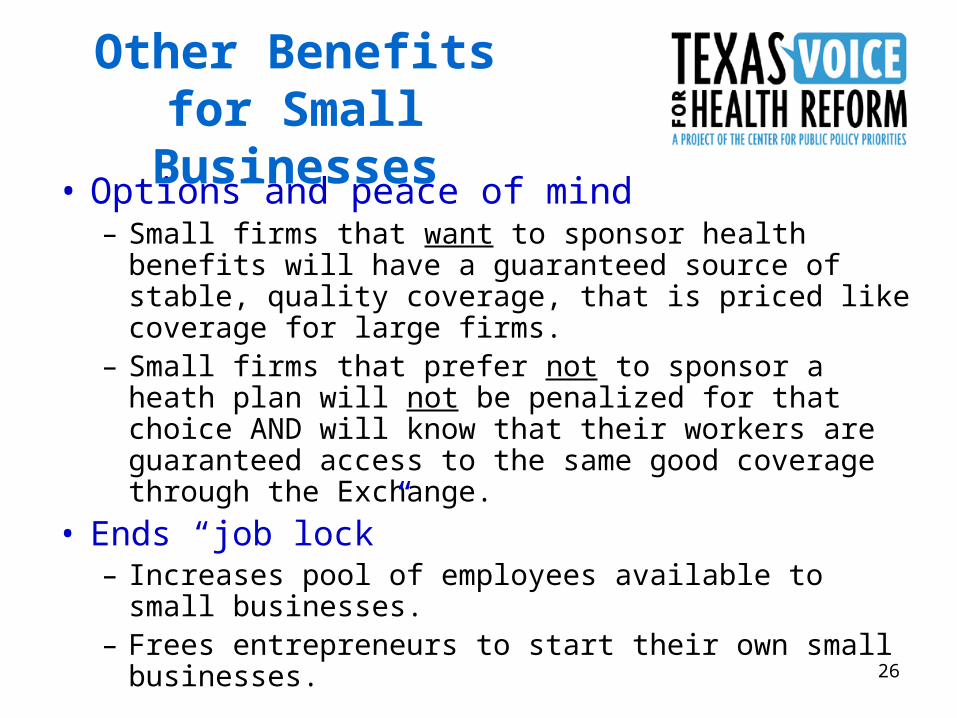
• Options and peace of mind– Small firms that want to sponsor health benefits will
have a guaranteed source of stable, quality coverage, that is priced like coverage for large firms.
– Small firms that prefer not to sponsor a heath plan will not be penalized for that choice AND will know that their workers are guaranteed access to the same good coverage through the Exchange.
• Ends “job lock”– Increases pool of employees available to small
businesses.– Frees entrepreneurs to start their own small
businesses.
Other Benefits for Small Businesses
27
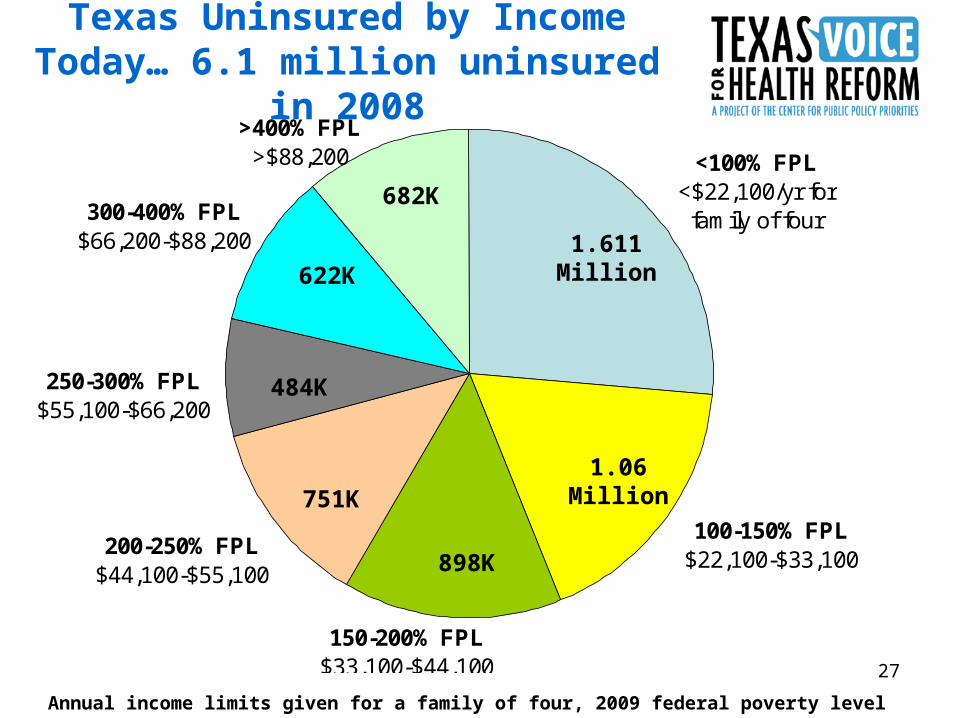
Texas Uninsured by Income Today… 6.1 million uninsured in 2008
300-400% FPL$66,200-$88,200
200-250% FPL$44,100-$55,100
250-300% FPL$55,100-$66,200
150-200% FPL$33,100-$44,100
>400% FPL>$88,200 <100% FPL
<$22,100/yr for family of four
100-150% FPL$22,100-$33,100
682K
622K
751K1.06
Million
1.611 Million
484K
Annual income limits given for a family of four, 2009 federal poverty level U.S. Census, CPS
898K
28
Who Gains Coverage in Texas
300-400% FPL
>400% FPL<100% FPL
200-250% FPL
150-200% FPL
250-300% FPL
100-150% FPL
682K
622K
1.6 Million
1.611 Million
751K
484K
898K
• CBO: 92% of under 65, or 95% of < 65 excluding undocumented covered in 2019.
• Using latest Texas uninsured data, this would mean the number of uninsured would be reduced by 4.3 to 4.6 million (from 6.1 million)
•Of course, population AND uninsured will increase between now and 2014-2019.
In Exchange • About 2.5 million 133-400% FPL qualify for help w/premiums, out-of-pocket (citizens & legal residents)
• Another 680,000 >400% FPL qualify for full-cost coverage thru Exchange.
UNKNOWN: How quickly, what % of eligible persons enroll. CBO and HHSC assumptions VERY far apart.
Medicaid, based on current Texas uninsured:• ~1 million uninsured US citizen adults would qualify for expansion to 133% FPL (adults)
•~500K already-eligible kids (100-200K more CHIP)
•HHSC numbers to date only provide average increase over the 2014-2023 period (no near-term estimates yet)
6.1 millionUninsured 2008
29
Who Remains Uninsured?• CBO assumes small percentage of those eligible for help will opt not
to be covered (no penalty for lowest income, & penalties much lower than cost of coverage at any income).
• Unknown: What share of low- & moderate-income Texans will take up coverage (adequacy of premium subsidies), and what % may stay uninsured.
• Undocumented: – no Medicaid/CHIP,
– no premium subsidy, and cannot buy @ full cost from exchange
– Best estimates say 40% of undocumented in US TODAY have private coverage
• Legal Permanent Residents: – continued exclusion from Texas Medicaid per state law,
– Can purchase from exchange and qualify for subsidy
30
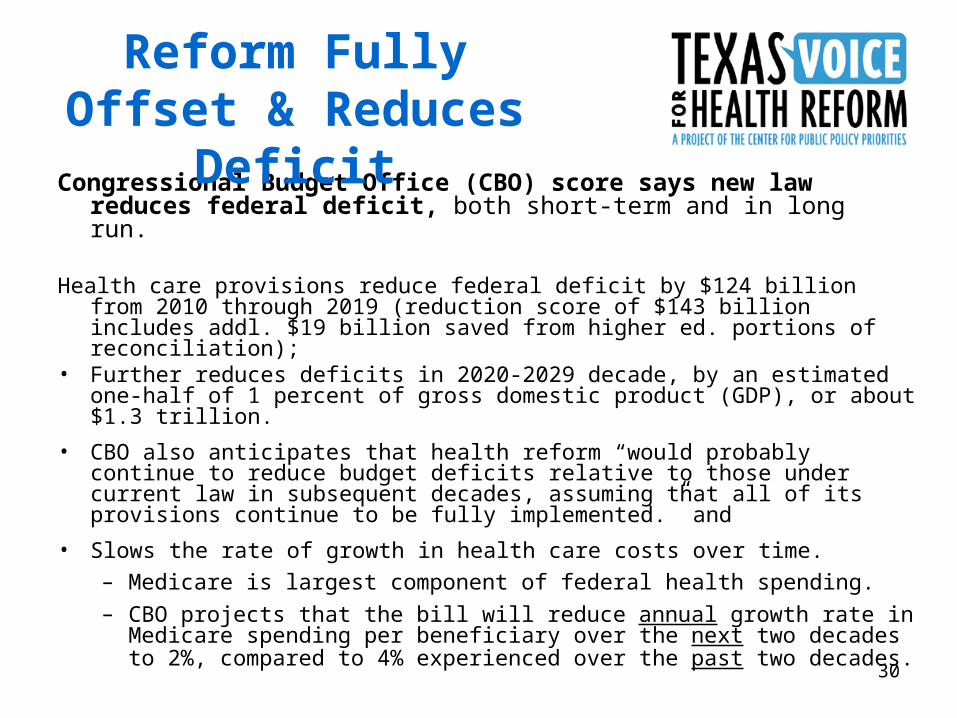
Congressional Budget Office (CBO) score says new law reduces federal deficit, both short-term and in long run.
Health care provisions reduce federal deficit by $124 billion from 2010 through 2019 (reduction score of $143 billion includes addl. $19 billion saved from higher ed. portions of reconciliation);
• Further reduces deficits in 2020-2029 decade, by an estimated one-half of 1 percent of gross domestic product (GDP), or about $1.3 trillion.
• CBO also anticipates that health reform “would probably continue to reduce budget deficits relative to those under current law in subsequent decades, assuming that all of its provisions continue to be fully implemented.” and
• Slows the rate of growth in health care costs over time.
– Medicare is largest component of federal health spending.
– CBO projects that the bill will reduce annual growth rate in Medicare spending per beneficiary over the next two decades to 2%, compared to 4% experienced over the past two decades.
Reform Fully Offset & Reduces Deficit
31
Administration of Health Insurance Exchange
• State must operate as of 1/2014; if not on track by 1/2013 feds will do it; grant $$ available
• State decisions:
• Apply for federal grants and create exchange or allow feds to
• Administered by nonprofit or state agency? Which agency? Governing body?
• Separate exchanges for indiv. & small employers or combined
• Limit small biz eligibility to <50 employees for 2014-2015 or initially open to all small biz 1-100 employees
• Open up to businesses with 100+ employees in 2017
• Contract with HHSC for subsidy eligibility determination
• “No Wrong Door” coordination between Exchange and Medicaid required, including joint application and enrollment website that functions for Medicaid, Exchange, and CHIP.
New Roles for State in Health Insurance
32
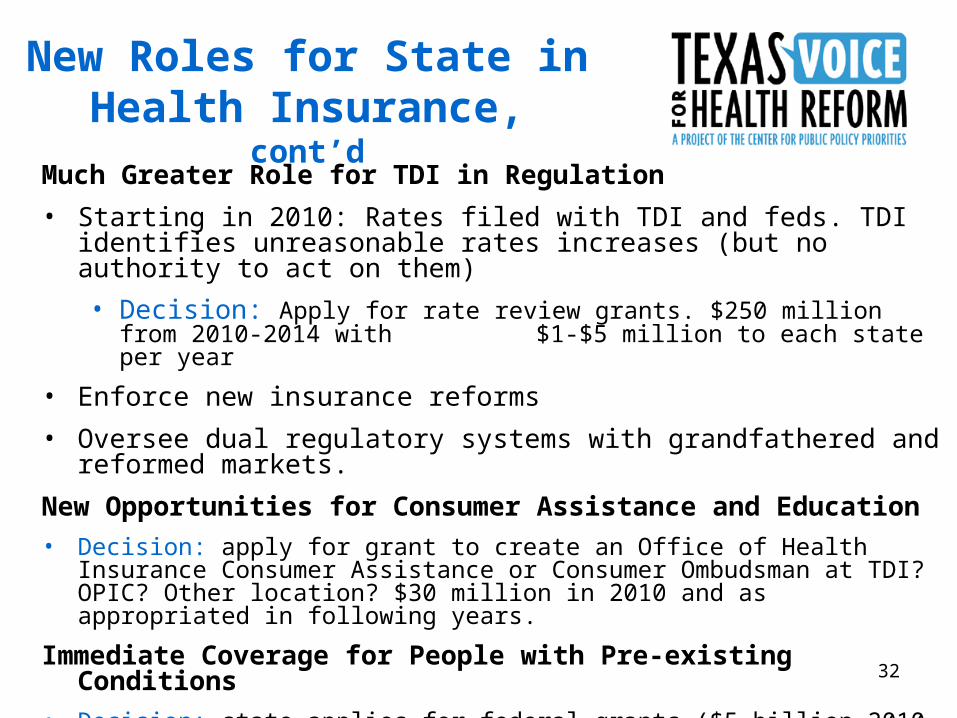
New Roles for State in Health Insurance, cont’d
Much Greater Role for TDI in Regulation
• Starting in 2010: Rates filed with TDI and feds. TDI identifies unreasonable rates increases (but no authority to act on them)
• Decision: Apply for rate review grants. $250 million from 2010-2014 with $1-$5 million to each state per year
• Enforce new insurance reforms
• Oversee dual regulatory systems with grandfathered and reformed markets.
New Opportunities for Consumer Assistance and Education
• Decision: apply for grant to create an Office of Health Insurance Consumer Assistance or Consumer Ombudsman at TDI? OPIC? Other location? $30 million in 2010 and as appropriated in following years.
Immediate Coverage for People with Pre-existing Conditions
• Decision: state applies for federal grants ($5 billion 2010-2013) and creates new high risk pool, or allows feds to create pool in state.
33
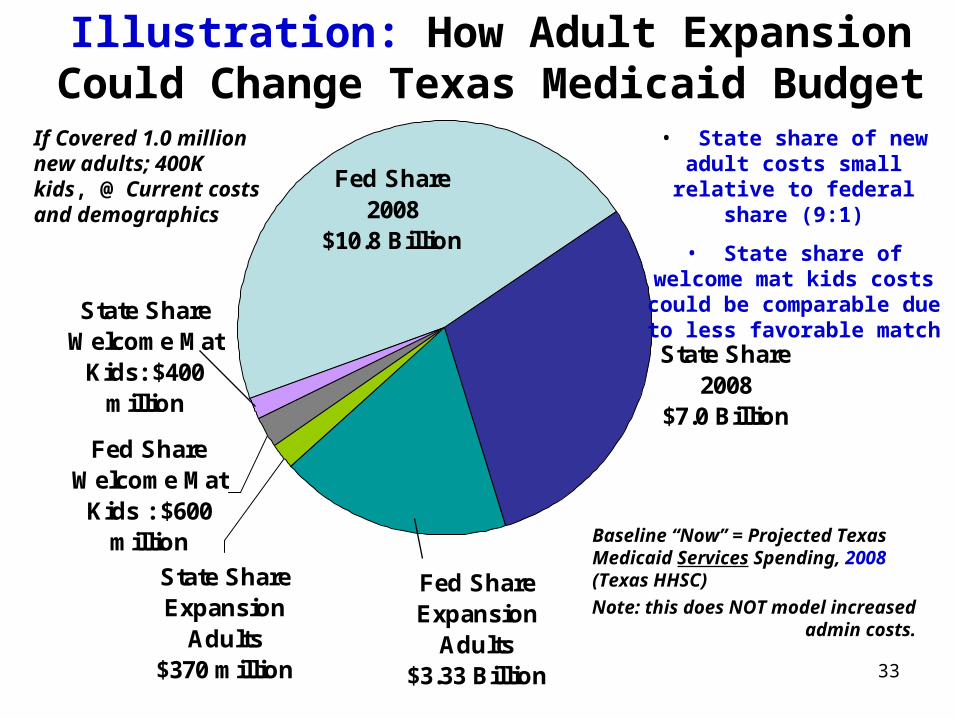
Illustration: How Adult Expansion Could Change Texas Medicaid Budget
Fed Share Expansion
Adults$3.33 Billion
State Share Expansion
Adults$370 million
Fed Share 2008
$10.8 Billion
State Share 2008
$7.0 Billion
State Share Welcome Mat
Kids: $400 million
Fed Share Welcome Mat
Kids : $600 million Baseline “Now” = Projected Texas
Medicaid Services Spending, 2008 (Texas HHSC)
Note: this does NOT model increased admin costs.
If Covered 1.0 million new adults; 400K kids, @ Current costs and demographics
• State share of new adult costs small relative to federal
share (9:1)
• State share of welcome mat kids costs could be
comparable due to less favorable match
34
HHSC’s Early Medicaid Impact Model• Expect HHSC will provide more detailed numbers for the House 4/22/2010 hearing
• HHSC projections to date have not included:
o Projections of increased funding needs in 2012-2013 for administrative costs; or
o Year-by-year assumptions of adult and child Medicaid and CHIP enrollment growth or cost per client (i.e., they have only projected the average aggregate increase in GR needed over the full 10-year period from 2014 to 2023).
• HHSC assumed 95% take-up rates in Medicaid and CHIP; national experts and historical data indicate that such high take-up rates have never before been experienced in Medicaid.
• Because persons with income below the federal income tax filing threshold (very near the FPL) will not be subject to an individual mandate penalty and Texas only has recent history with expansions exclusively for children, it is uncertain how quickly new adults and already-eligible children will be added to the Texas Medicaid and CHIP rolls.
• HHSC has projected $27 billion in state GR costs from 2014-2023. In context, the agency also projects a Federal Funds gain of $164.2 billion, or more than 6 times the state dollar (GR) cost.
Other Caveats:
• HHSC assumed that the primary care physician rate increase would continue beyond two years AT STATES’ EXPENSE, but did not assume the rates would be extended to CHIP or that other procedure codes would get a similar increase.
• Not same period as CBO scores, so don’t compare them (CBO scores run 2010-2019, then 2020-2029)
• Assumes favorable FMAPs disappear in 2020
35
More on Medicaid Fiscal Effects
• Admin costs for state of expanded enrollment presumably @ 50%; financing of Medicaid-to-Exchange interface costs unclear but may also be 25% to 50% state
• Some increased costs of doing business passed through in Medicaid rates.
• Medicaid expansion, while not “free” for Texas, will yield substantial economic benefits, but require new sources of revenue to fund state share.
• Even HHSC preliminary cost estimate thru 2023 shows 6:1 ratio of federal dollars to state costs.
• Medicaid cost share --even if offset 6-to-1 or better with federal funds--must be funded in state budget to some degree as soon as 2014, and in context of a severe structural deficit in our state tax system and current leadership unfavorable to increasing revenue capacity.
36
Medicaid in 2012-2013 TX Budget• NO health reform expansion costs, but admin costs at TDI & HHSC
• Shortfall numbers make it obvious: without more revenue, there WILL be deep cuts.
• In 2003, Provider Rates were the largest category of cut. After partial restorations, the total projected reduction in Medicaid and CHIP rates was about $599 million.
• Federal law Medicaid maintenance of effort required:
– Health reform MOEs: no eligibility cuts for Medicaid adults until Exchange opens in 2014; no cuts for children in Medicaid and CHIP through 2019.
• That leaves provider rates and “optional” adult benefits to cut
– 2003 Lawmakers rejected certain cuts: cutting off community care and nursing home care; eliminating Rx coverage for aged, disabled, and adult clients
– They DID eliminate services of LPCs, SWs, psychologists, LMFTs, podiatrists, and chiropractors; and adult eyeglasses and hearing aids. (Restored in 2005)
37
Health Reform Implementation Timeline
• January 2016: first benefits for community supports under CLASS Act •2016: compacts for interstate insurance sales.•2018: High-cost health plan excise tax begins
MAJOR COVERAGE & REFORMS BEGIN•Creation of Health Insurance Exchanges
•Out-of-Pocket caps for ALL persons with high medical expenses
•Ban annual benefit limits in all plans
•Individual Mandate
•Employer Responsibility
As of September 23
•Prohibit lifetime benefit caps
•Prohibit pre-existing condition exclusions for children•More primary care training $$
•Ban Co-pays and other Out-of-Pocket expenses for preventive care and immunizations, incl. Medicare
•No more “Rescissions”
•Dependent coverage to 26th birthday
In 2010
•Start closing Medicare Rx Donut Hole; new Medicare prevention benefits
•Grants to states to for consumer assistance
•Expand access to Community Health Centers
•Tax credits for small firms•Rate review medical loss ratios
• Nationwide interim high-risk pool coverage for individuals with pre-existing conditions
•Interim reinsurance for employers providing early-retiree health benefits
Later ImplementationImplement in 2014Takes Effect in 2010Effective in 90 days
For detailed timeline, see www.kff.org
38
Use of This Presentation
The Center for Public Policy Priorities encourages you to reproduce and distribute these slides, which were developed for use in making public presentations.
If you reproduce these slides, please give appropriate credit to CPPP.
The data presented here may become outdated.
For the most recent information or to sign up for our free E-Mail Updates, visit www.cppp.org.