1-Hour SO 2 Modeling in Complex Terrain in Southwestern PA EPA Regional/State/Local Modelers’ Workshop New Orleans, LA Nov. 15-17, 2016 Jason Maranche Allegheny County Health Department (ACHD) Air Quality Program Pittsburgh, PA
Transcript
1-Hour SO2 Modeling in Complex Terrain in Southwestern PA
Jason MarancheAllegheny County Health Department (ACHD)Air Quality ProgramPittsburgh, PA
• Allegheny, PA SO2 Nonattainment Area (NAA), 2010 1-Hour NAAQS– Monongahela River valley in Southwestern PA (SWPA)
• Complex terrain (difference of about 140 m, river -to-hilltop)• Industrial sources in-valley; populated areas throughout area
– Sub-hourly emissions, non steady-state conditions• Max concentrations during stable conditions, low winds, strong inversions
• ACHD has utilized a number of models over the years– See 2014 R/S/L presentation for history
• What is the most appropriate, while still regulatory– Meteorology– Model– Source characterization– Model options
• Case-by-case: SWPA may differ from other areas (flat or complex)
Summary of Problem
2
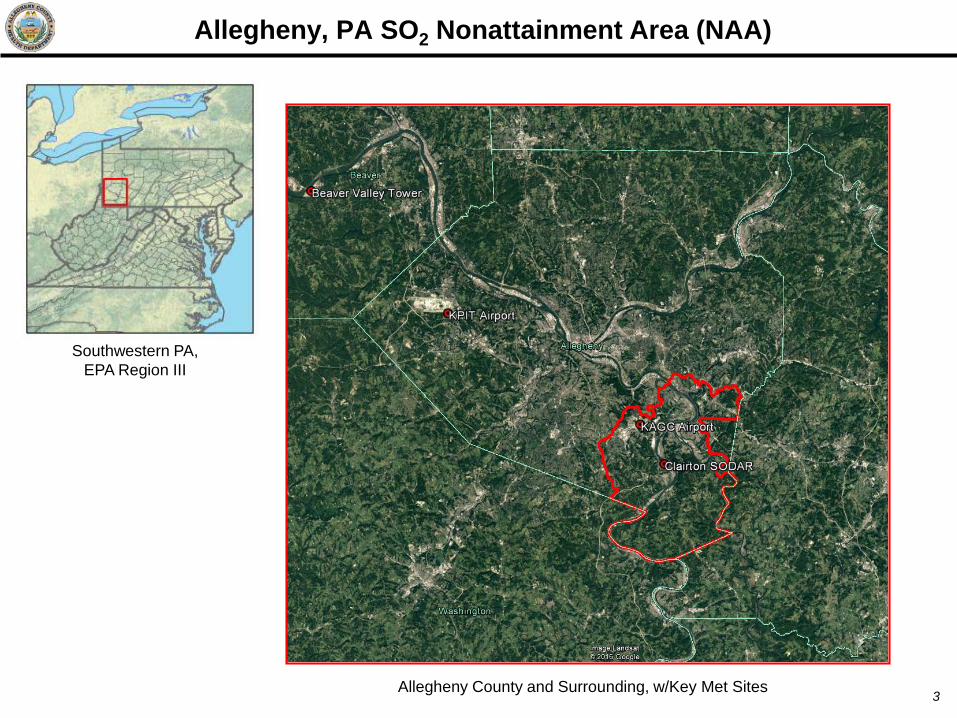
Allegheny, PA SO2 Nonattainment Area (NAA)
3Allegheny County and Surrounding, w/Key Met Sites
Southwestern PA,EPA Region III
Aerial/Topographic Close-Up with SO2 Sources and Monitors
4
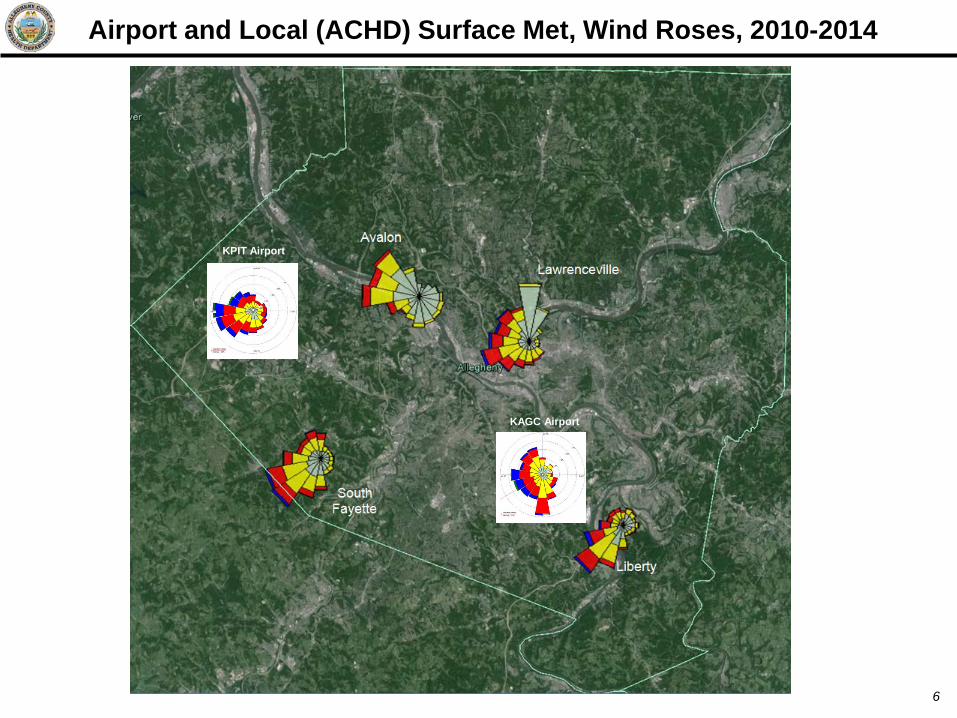
• Airport met data– Can be representative for some scenarios (tall stacks, plateau flow)– For most applications, wind speeds are too high (and/or wrong directions)
• Local met sites (surface-based)– Can be too specific to areas (microscale)– Can be appropriate for some modeling cases, depending on source/location– Probably best used for directional analysis, pollution roses, etc.
• Multi-level towers/acoustic– Most site-specific, but very few locations in SWPA– SODAR has also been problematic (low recovery, operational errors)
• Monitors– Modeled hotspots are often not suitable for monitoring
• Similar to source-oriented monitoring TAD for SO2
• Examples: cliffs, dense wooded areas, golf course– One former site was also vandalized
Met and Monitor Sites in General
5
Airport and Local (ACHD) Surface Met, Wind Roses, 2010-2014
6
KAGC Airport
KPIT Airport
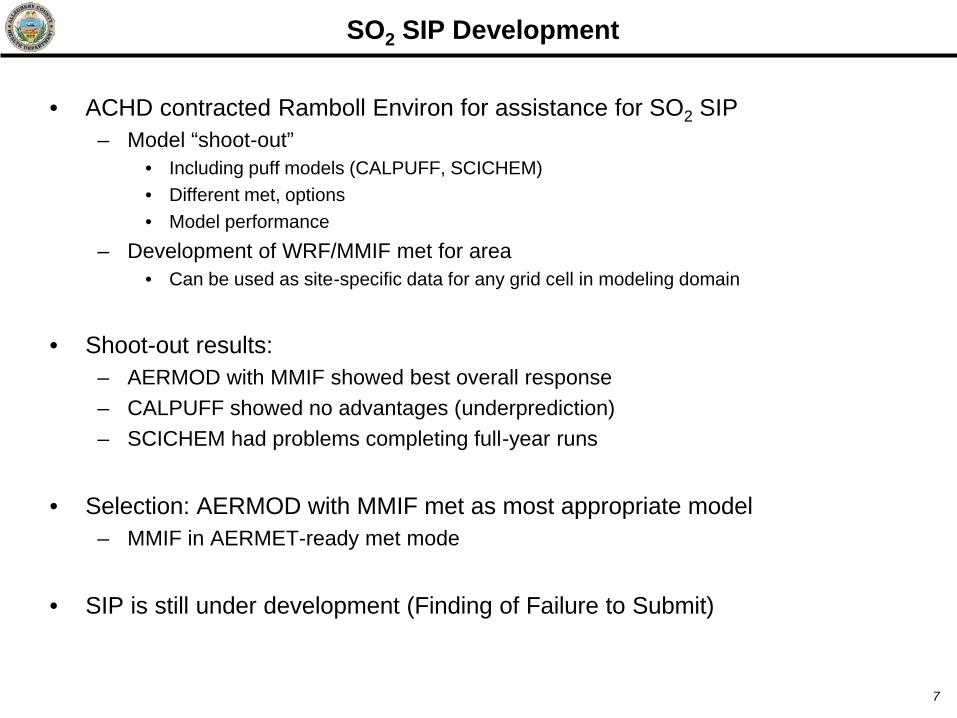
• ACHD contracted Ramboll Environ for assistance for SO2 SIP– Model “shoot-out”
• Including puff models (CALPUFF, SCICHEM)• Different met, options• Model performance
– Development of WRF/MMIF met for area• Can be used as site-specific data for any grid cell in modeling domain
• Shoot-out results:– AERMOD with MMIF showed best overall response– CALPUFF showed no advantages (underprediction)– SCICHEM had problems completing full-year runs
• Selection: AERMOD with MMIF met as most appropriate model– MMIF in AERMET-ready met mode
• SIP is still under development (Finding of Failure to Submit)
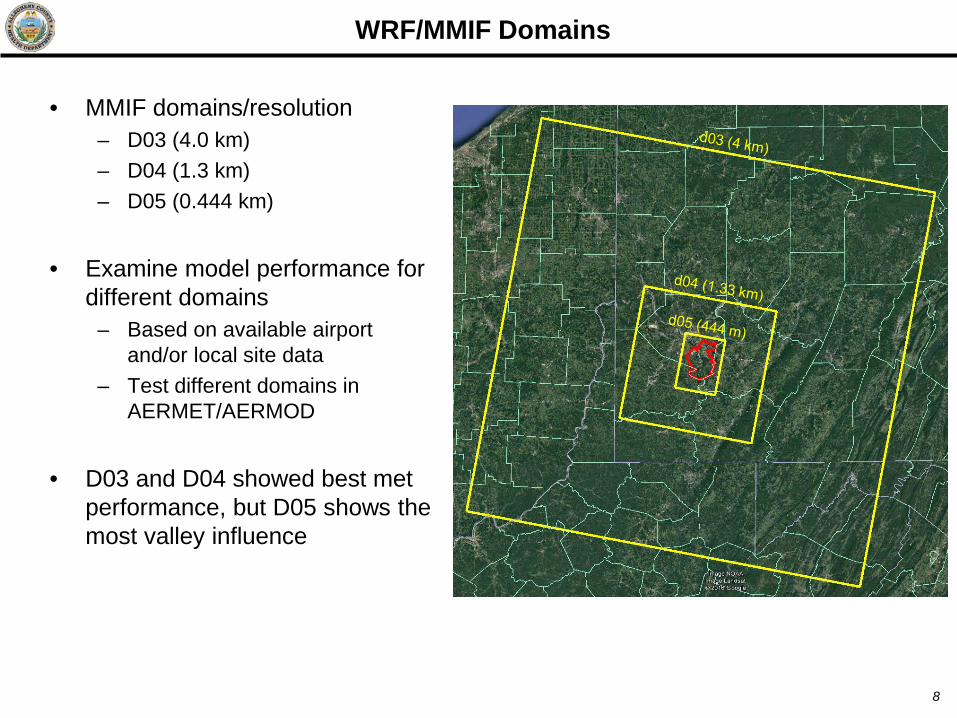
– Based on available airport and/or local site data
– Test different domains in AERMET/AERMOD
• D03 and D04 showed best met performance, but D05 shows the most valley influence
WRF/MMIF Domains
8
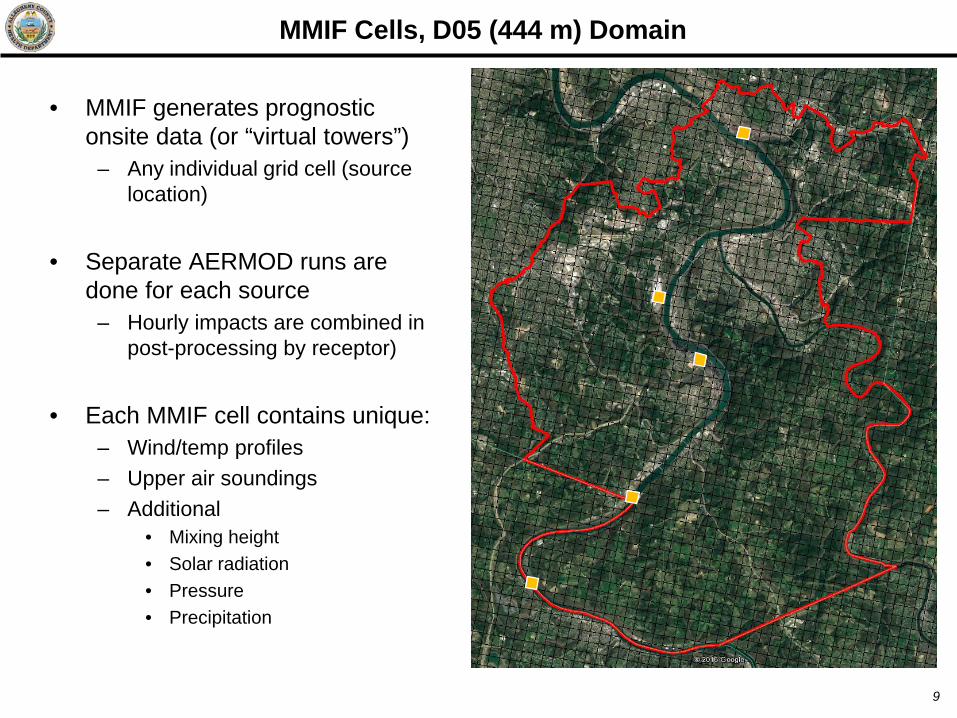
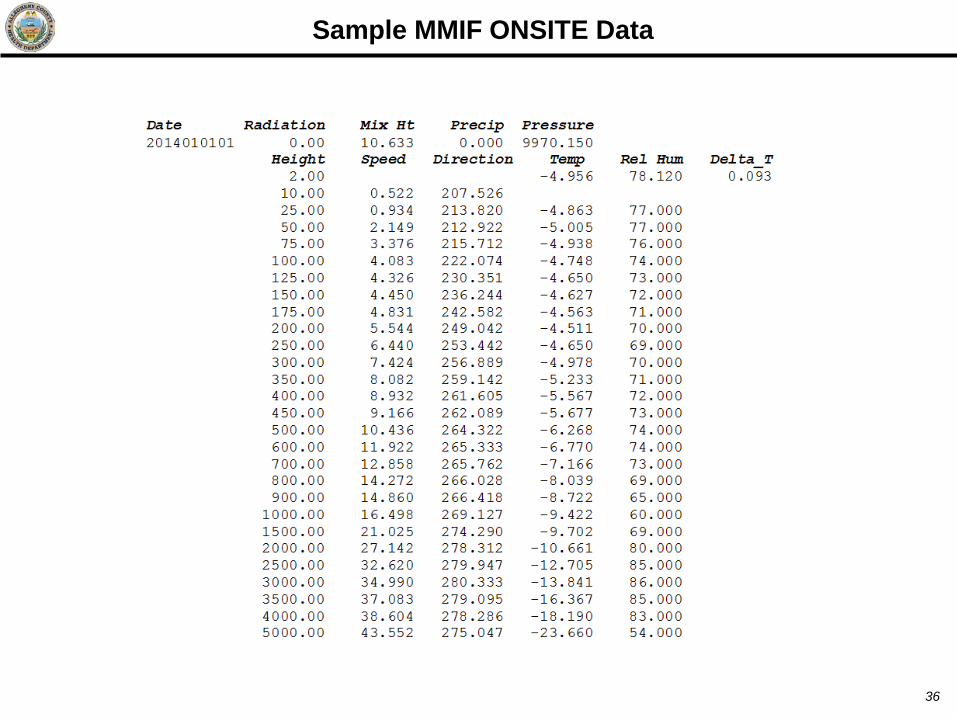
• MMIF generates prognostic onsite data (or “virtual towers”)
– Any individual grid cell (source location)
• Separate AERMOD runs are done for each source
– Hourly impacts are combined in post-processing by receptor)
• Each MMIF cell contains unique:– Wind/temp profiles– Upper air soundings– Additional
• Mixing height• Solar radiation• Pressure• Precipitation
MMIF Cells, D05 (444 m) Domain
9
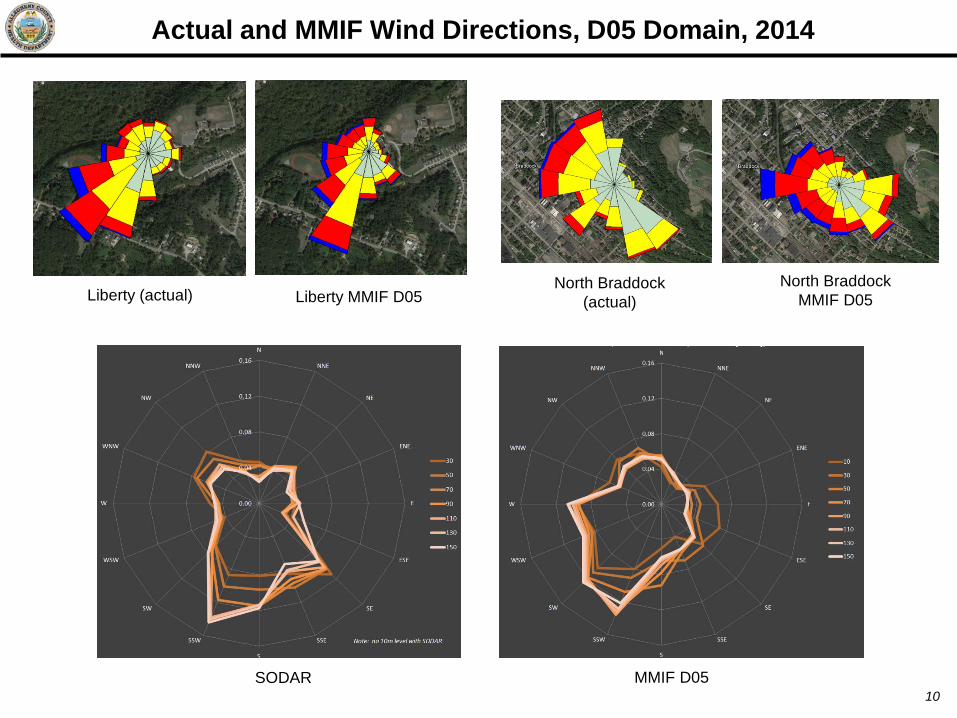
Actual and MMIF Wind Directions, D05 Domain, 2014
10
Liberty (actual) Liberty MMIF D05North Braddock
MMIF D05North Braddock
(actual)
SODAR MMIF D05
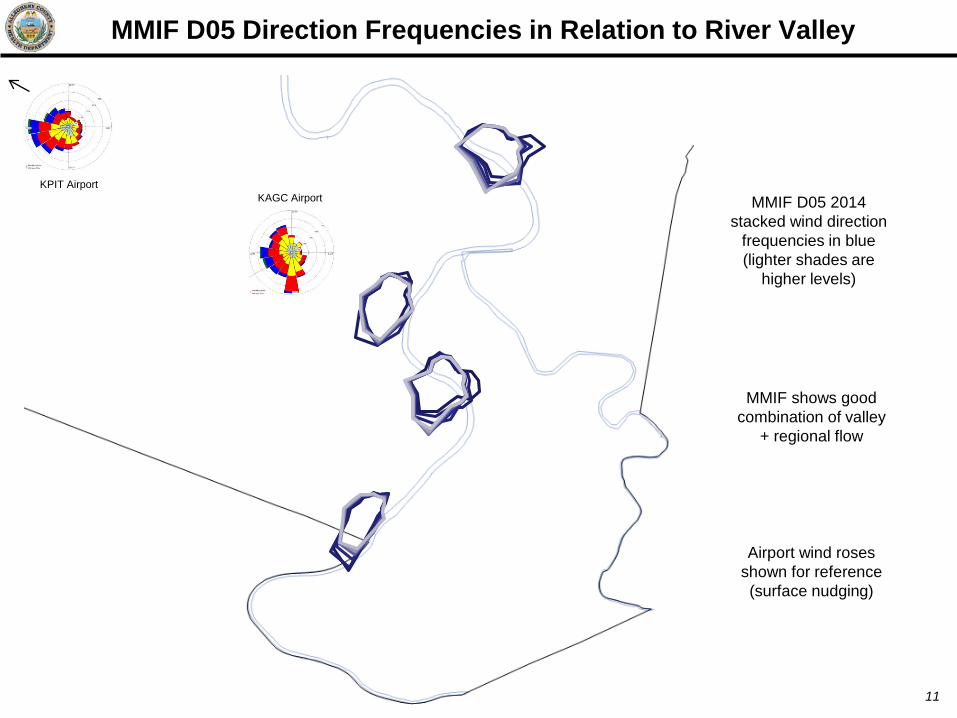
MMIF D05 Direction Frequencies in Relation to River Valley
11
KAGC AirportKPIT Airport
MMIF D05 2014 stacked wind direction
frequencies in blue (lighter shades are
higher levels)
Airport wind roses shown for reference (surface nudging)
MMIF shows good combination of valley
+ regional flow
• Full hourly details viewable with DEBUGOPT control keyword option– Generates very large files– Recommend 1 source and/or 1 receptor when processing full year
• DEBUG: METEOR– Hourly profiles created by AERMOD each hour– Uses any/all data supplied in AERMET PFL file– AERMOD interpolates/extrapolates for 0 to 5000 m vertically
AERMOD DEBUGOPT
12
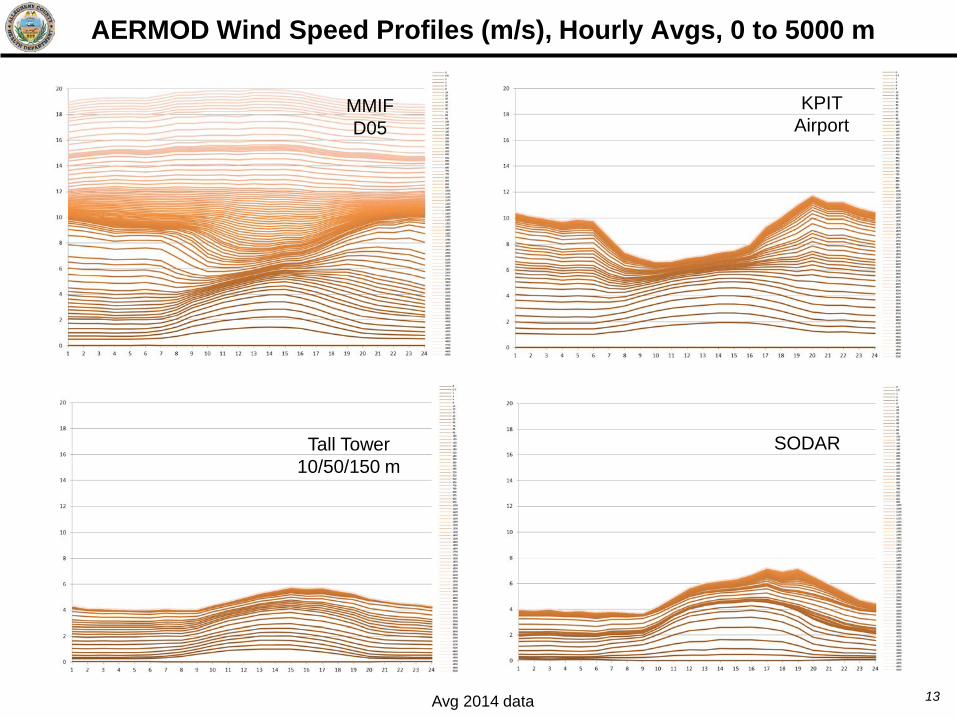
AERMOD Wind Speed Profiles (m/s), Hourly Avgs, 0 to 5000 m
13
MMIF D05
KPIT Airport
SODARTall Tower 10/50/150 m
Avg 2014 data
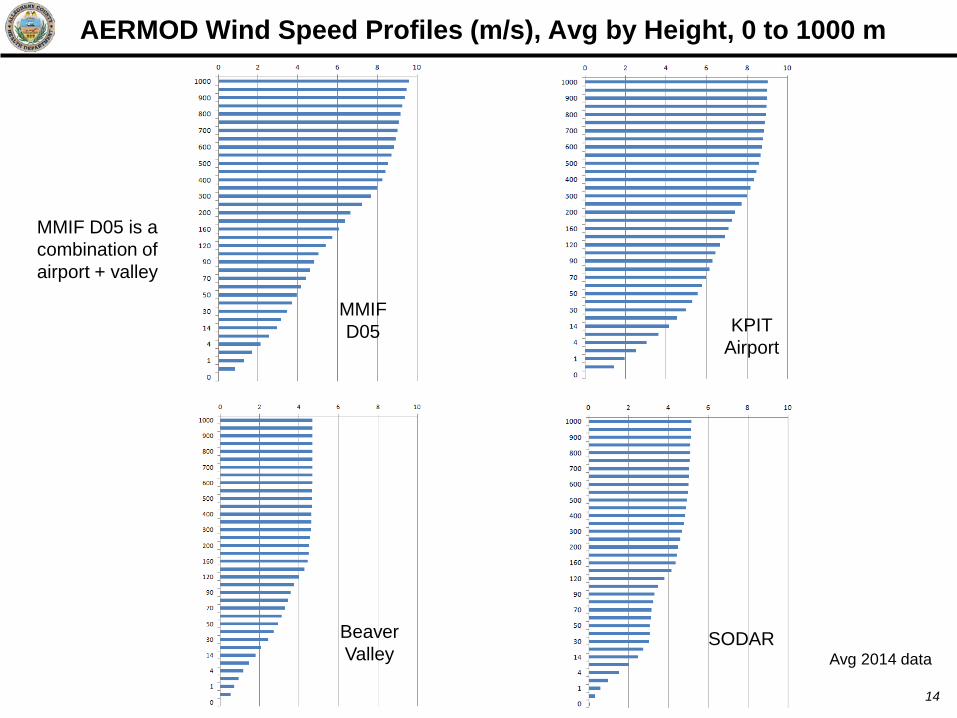
AERMOD Wind Speed Profiles (m/s), Avg by Height, 0 to 1000 m
14
MMIF D05
SODAR
KPIT Airport
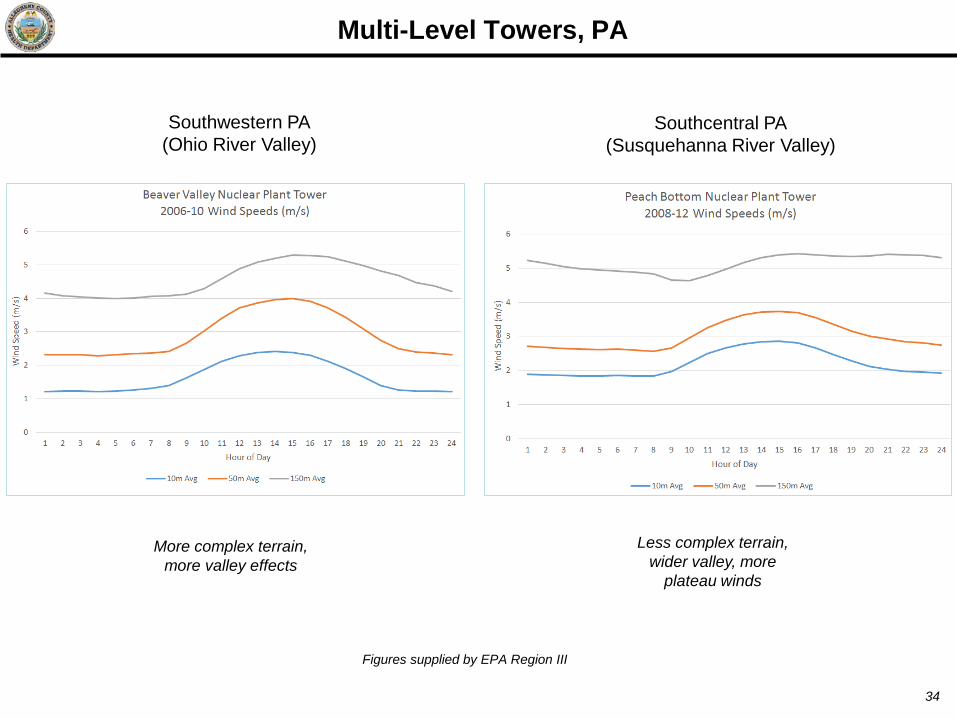
Beaver Valley
MMIF D05 is a combination of airport + valley
Avg 2014 data
AERMOD Avg Hourly Speeds, Measured and Predicted (to 160 m)
15
MMIF shows similar wind speeds to multi-level sites (when using surface
speeds from ONSITE)
SODAR Wind Speeds (2014)
MMIF D05 Wind Speeds (2014)
Beaver Valley Wind Speeds (2014)
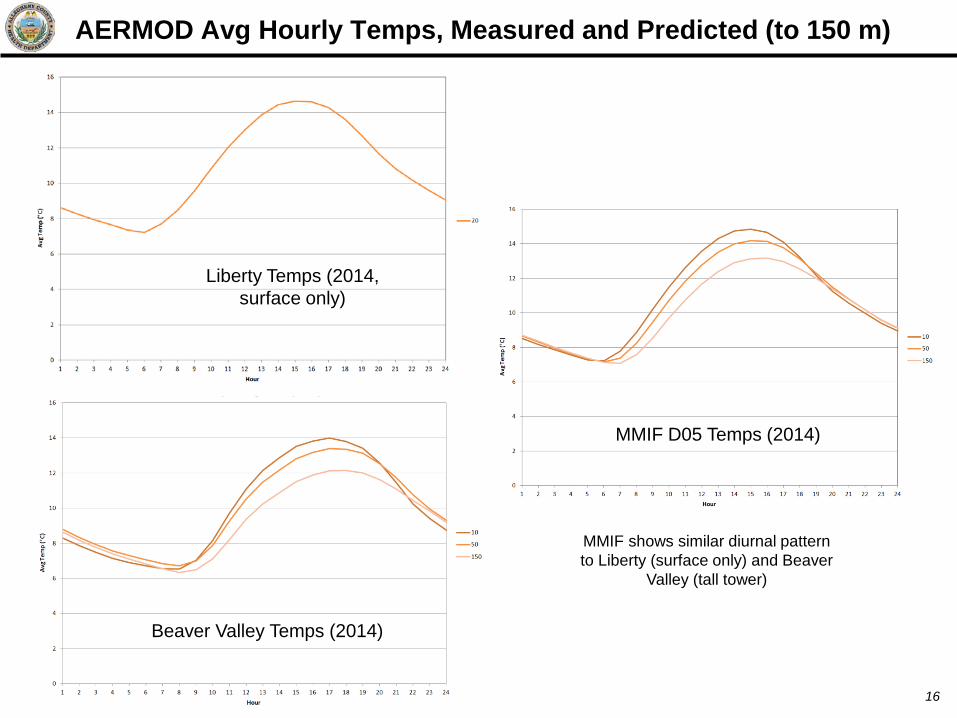
AERMOD Avg Hourly Temps, Measured and Predicted (to 150 m)
16
MMIF shows similar diurnal pattern to Liberty (surface only) and Beaver
Valley (tall tower)
Beaver Valley Temps (2014)
MMIF D05 Temps (2014)
Liberty Temps (2014, surface only)
• MMIF is adequately reproducing known met, with some smoothing– Site-specific met for any location
• Bulk Richardson for stable/unstable transitions– Includes valley wind flow at in-valley locations– Realistic temps/gradients
• Some speed bias at higher levels– Airport/plateau flow is carried through from WRF
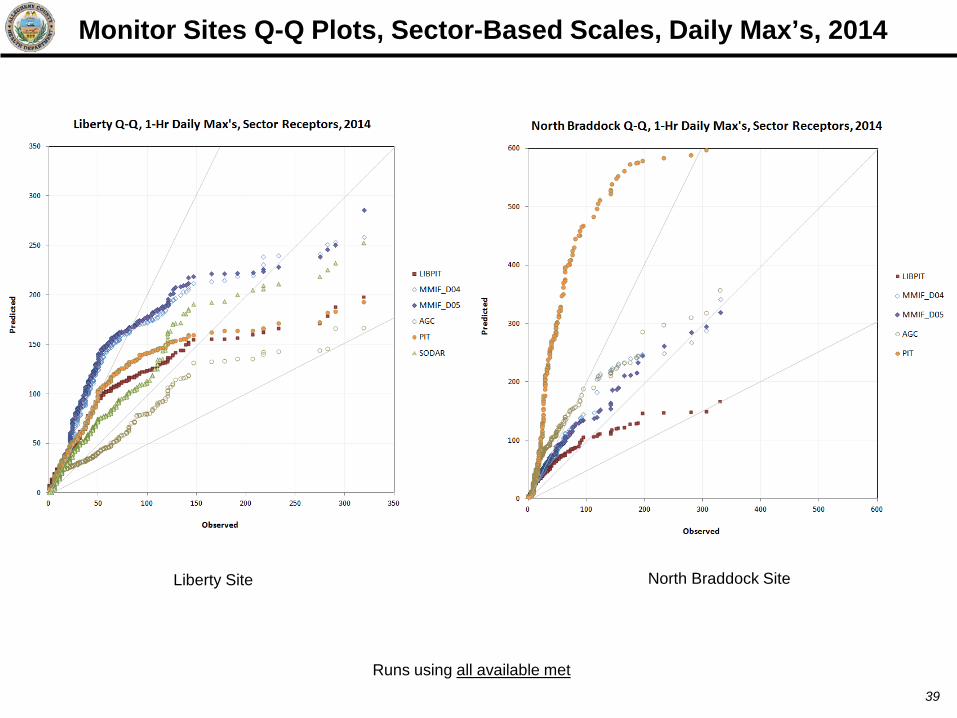
• Outperforms any other met data with AERMOD for our NAA– Very stable nighttime conditions (matches real-life)– Best daily maximums throughout area
• Airports – overprediction• Local sites – underprediction
• D05 domain (444 m resolution) showed best results– Less resolution may also be adequate for modeling (case-by-case)
MMIF Analysis
17
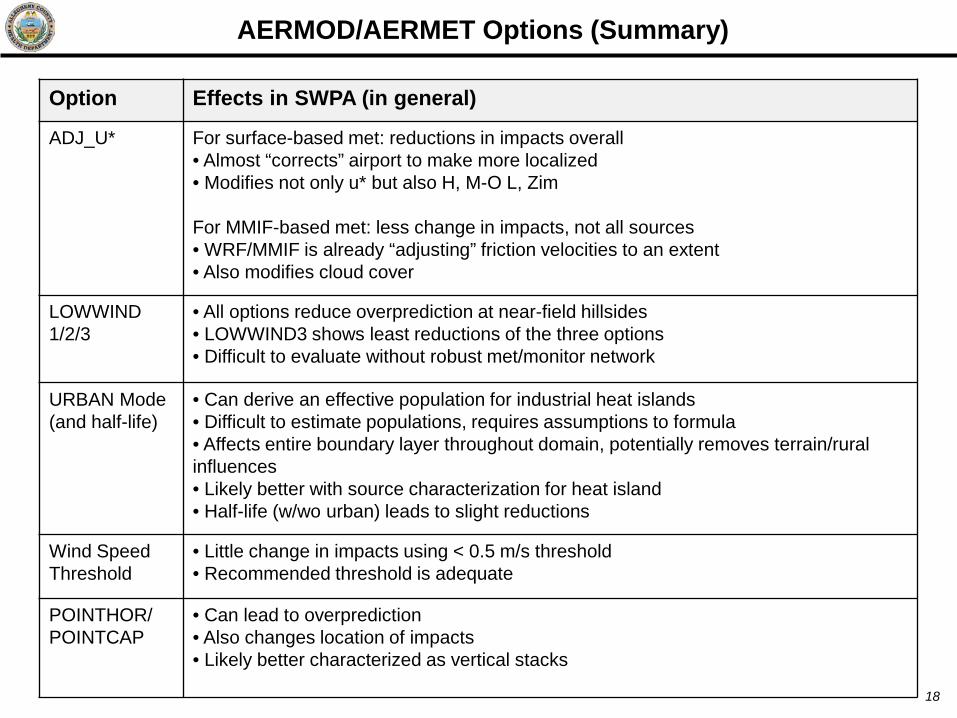
AERMOD/AERMET Options (Summary)
18
Option Effects in SWPA (in general)
ADJ_U* For surface-based met: reductions in impacts overall• Almost “corrects” airport to make more localized• Modifies not only u* but also H, M-O L, Zim
For MMIF-based met: less change in impacts, not all sources• WRF/MMIF is already “adjusting” friction velocities to an extent• Also modifies cloud cover
LOWWIND 1/2/3
• All options reduce overprediction at near-field hillsides• LOWWIND3 shows least reductions of the three options• Difficult to evaluate without robust met/monitor network
URBAN Mode(and half-life)
• Can derive an effective population for industrial heat islands• Difficult to estimate populations, requires assumptions to formula• Affects entire boundary layer throughout domain, potentially removes terrain/rural influences• Likely better with source characterization for heat island• Half-life (w/wo urban) leads to slight reductions
Wind Speed Threshold
• Little change in impacts using < 0.5 m/s threshold• Recommended threshold is adequate
POINTHOR/POINTCAP
• Can lead to overprediction• Also changes location of impacts• Likely better characterized as vertical stacks
• With MMIF, user can select mixing height methodology– AERMET, WRF, MMIF
• AERMET processing can lead to very low mixing heights in general– Especially with multi-level data (multi-level tower, MMIF)– AERMET default minimum = 1 m– Can lead to high impacts/overprediction
• WRF heights are more consistent with “packaged” MMIF data set– MMIF heights are in between WRF and AERMET
• Can also correct for a minimum mixing height– Edit SFC file (with any met) or MMIF ONSITE file– Based on average building tier heights, or other method– Can lower impacts for some sources
• Examine performance
Mixing Heights
19
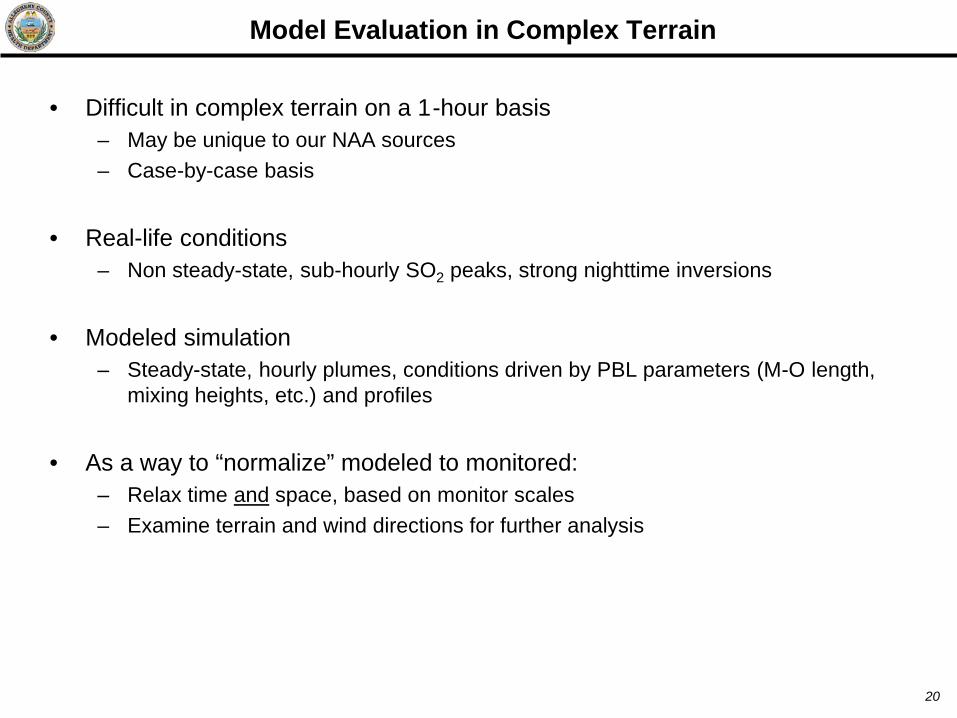
• Difficult in complex terrain on a 1-hour basis– May be unique to our NAA sources– Case-by-case basis
• As a way to “normalize” modeled to monitored:– Relax time and space, based on monitor scales– Examine terrain and wind directions for further analysis
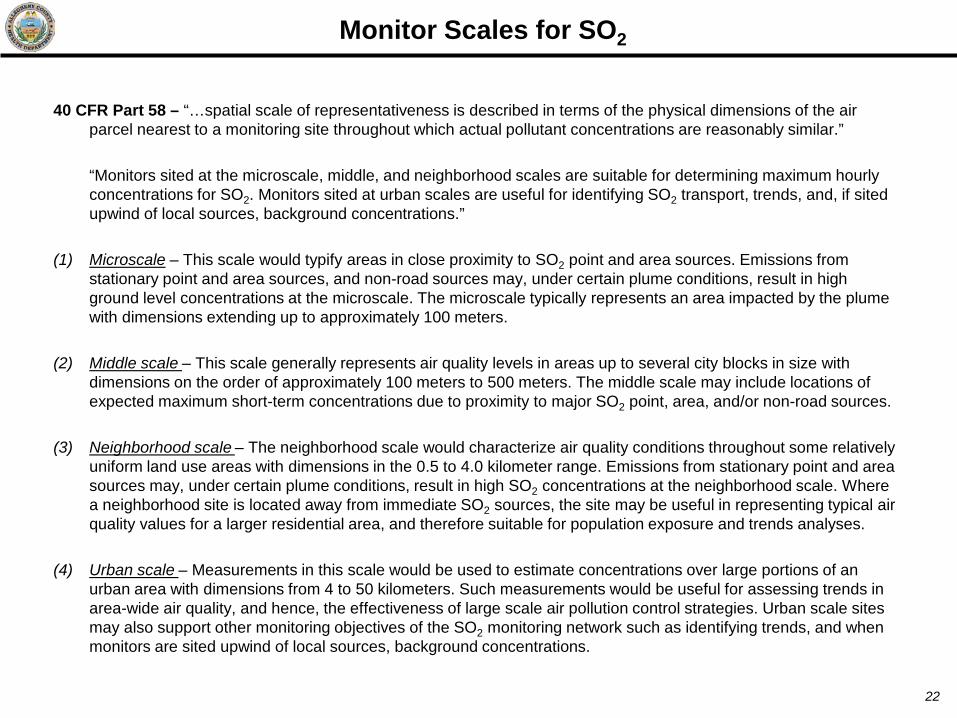
40 CFR Part 58 – “…spatial scale of representativeness is described in terms of the physical dimensions of the air parcel nearest to a monitoring site throughout which actual pollutant concentrations are reasonably similar.”
“Monitors sited at the microscale, middle, and neighborhood scales are suitable for determining maximum hourly concentrations for SO2. Monitors sited at urban scales are useful for identifying SO2 transport, trends, and, if sited upwind of local sources, background concentrations.”
(1) Microscale – This scale would typify areas in close proximity to SO2 point and area sources. Emissions from stationary point and area sources, and non-road sources may, under certain plume conditions, result in high ground level concentrations at the microscale. The microscale typically represents an area impacted by the plume with dimensions extending up to approximately 100 meters.
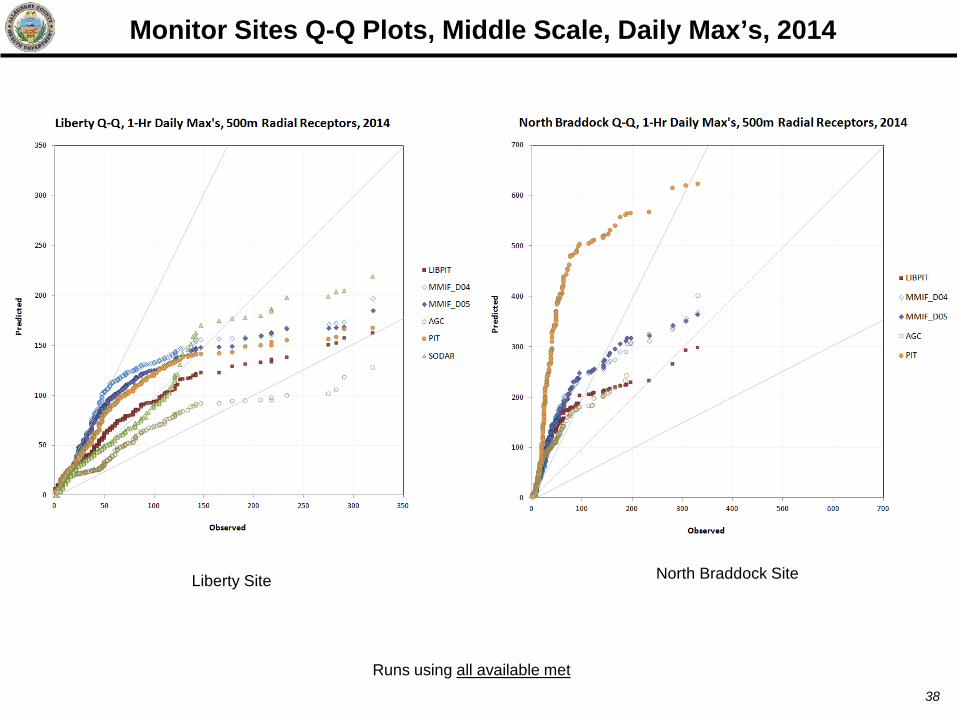
(2) Middle scale – This scale generally represents air quality levels in areas up to several city blocks in size with dimensions on the order of approximately 100 meters to 500 meters. The middle scale may include locations of expected maximum short-term concentrations due to proximity to major SO2 point, area, and/or non-road sources.
(3) Neighborhood scale – The neighborhood scale would characterize air quality conditions throughout some relatively uniform land use areas with dimensions in the 0.5 to 4.0 kilometer range. Emissions from stationary point and area sources may, under certain plume conditions, result in high SO2 concentrations at the neighborhood scale. Where a neighborhood site is located away from immediate SO2 sources, the site may be useful in representing typical air quality values for a larger residential area, and therefore suitable for population exposure and trends analyses.
(4) Urban scale – Measurements in this scale would be used to estimate concentrations over large portions of an urban area with dimensions from 4 to 50 kilometers. Such measurements would be useful for assessing trends in area-wide air quality, and hence, the effectiveness of large scale air pollution control strategies. Urban scale sites may also support other monitoring objectives of the SO2 monitoring network such as identifying trends, and when monitors are sited upwind of local sources, background concentrations.
Monitor Scales for SO2
22
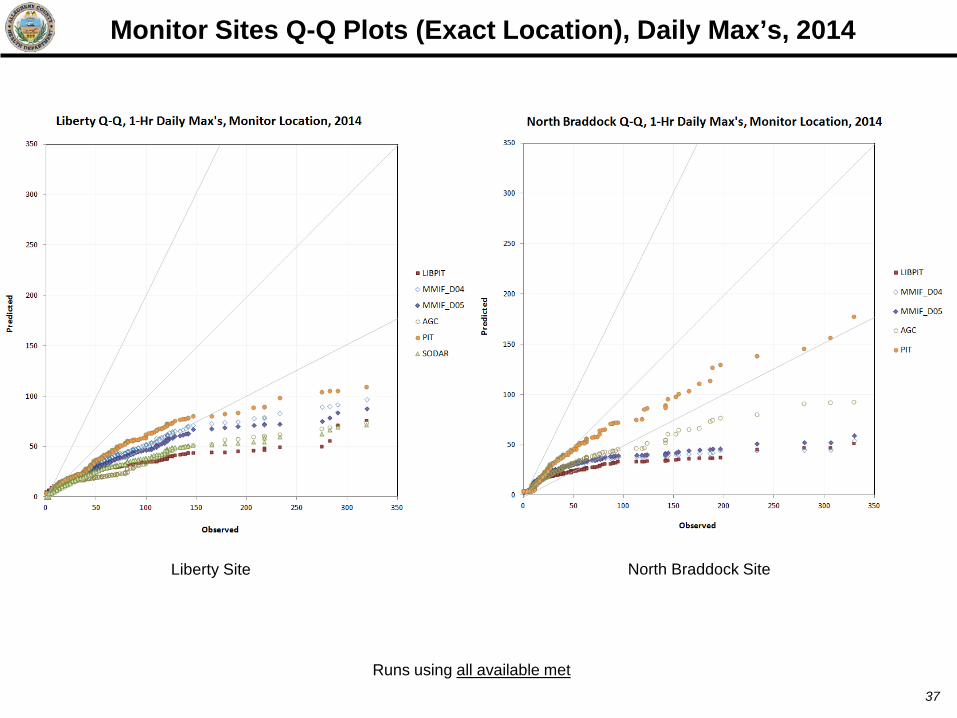
Monitor Receptors at Middle Scale (to 500 m radius)
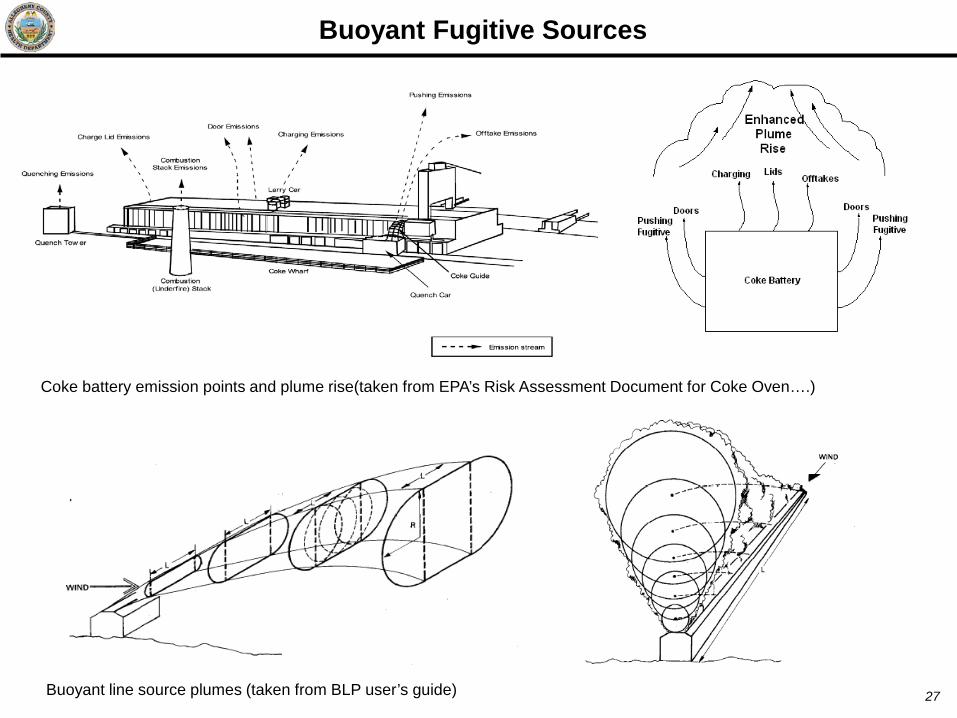
Coke battery emission points and plume rise(taken from EPA’s Risk Assessment Document for Coke Oven….)
Buoyant line source plumes (taken from BLP user’s guide)
• Fugitives with substantial heat– Observed plume rise, localized heat island effect– Can be tested several ways in model
• BUOYLINE in AERMOD v15181 showed questionable results– Overprediction at some areas, underprediction at other areas
• Does not match expected– Rotational errors; also only one line at a time– Large line plume are difficult to disperse in complex terrain– No DEBUG MODEL results for BUOYLINE
• Same sources as series of high-temp stacks showed overprediction– High dependence on release height in complex terrain
• Series of volumes with fixed release heights– Likely too arbitrary; heights are varying by hour
Buoyant Fugitive Sources in AERMOD
28
• Line inputs and buoyancies for buoyant lines– F’ buoyancy parameter dependent on size and temp– AERMET data reformatted into RAMMET ASCII format (including P-G stabilities)
• BLP was modified by ACHD to generate plume rise by hour– Volume sources are then modeled in AERMOD with hourly-variable dimensions
BLP Processing
29
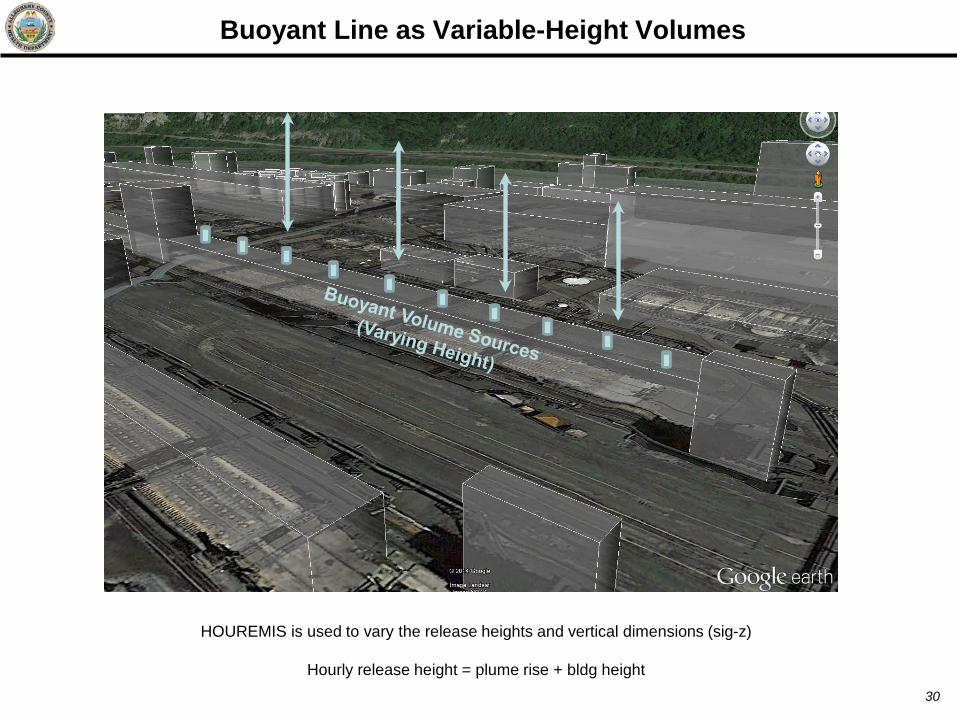
Buoyant Line as Variable-Height Volumes
30
HOUREMIS is used to vary the release heights and vertical dimensions (sig-z)
Hourly release height = plume rise + bldg height
• AERMOD– Point sources for stacks– Fixed-height volumes for roof monitors or other ambient fugitives– Varying-height volumes for buoyant fugitives
• Heights based on plume rises generated from BLP
• AERMET– Using MMIF D05 (444 m resolution) inputs, developed from WRF– MMIF ONSITE, UPPERAIR, and SURF characteristics– Unique to each source modeled– Each source modeled as separate AERMOD run– Results from different runs combined in post-processing
• Years selected: 2012-2014– Based on WRF runs
• Best science + regulatory approach
Optimal Model Configuration
31
• AERMOD– Continue evaluations– SO2 SIP
• PM2.5 SIP: CAMx with Plume-in-Grid (PiG)
• Emerging models or techniques– CFD
• CMU is currently developing a study for the area– SCICHEM– WRF/MMIF enhancements
• Installation of additional met/monitor sites– Multi-level tower(s) with collocated SODAR/RASS
Summary and Future Work
32
Questions?
Jason MarancheA.P.C. Engineer III
Air Quality Program301 39th St., Bldg. 7Pittsburgh, PA 15201office: 412-578-8104
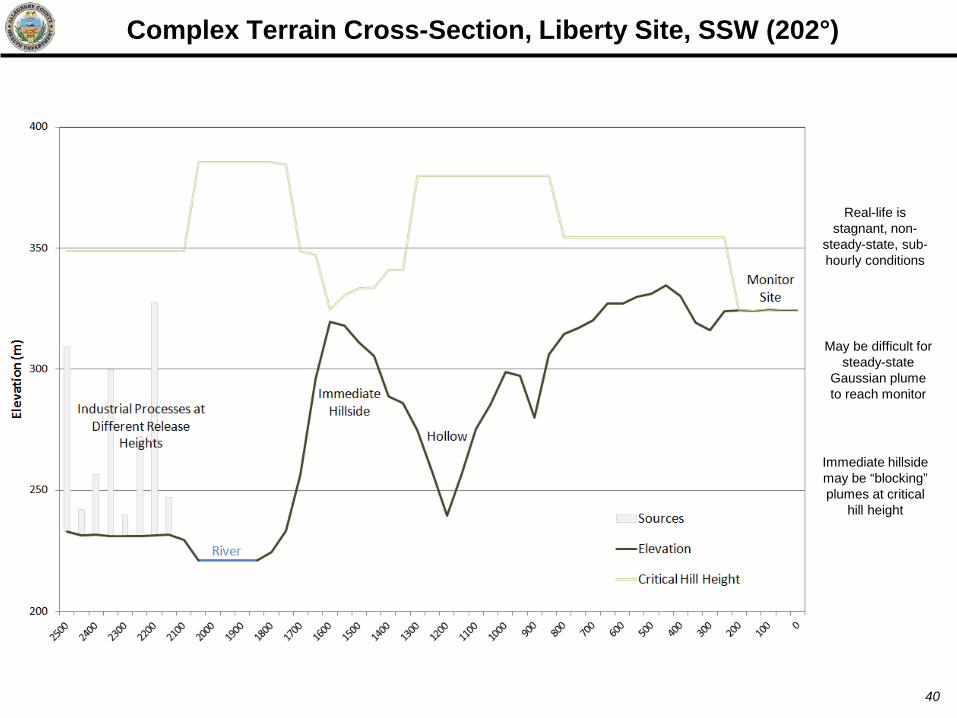
Complex Terrain Cross-Section, Liberty Site, SSW (202°)
40
May be difficult for steady-state
Gaussian plume to reach monitor
Immediate hillside may be “blocking” plumes at critical
hill height
Real-life is stagnant, non-
steady-state, sub-hourly conditions
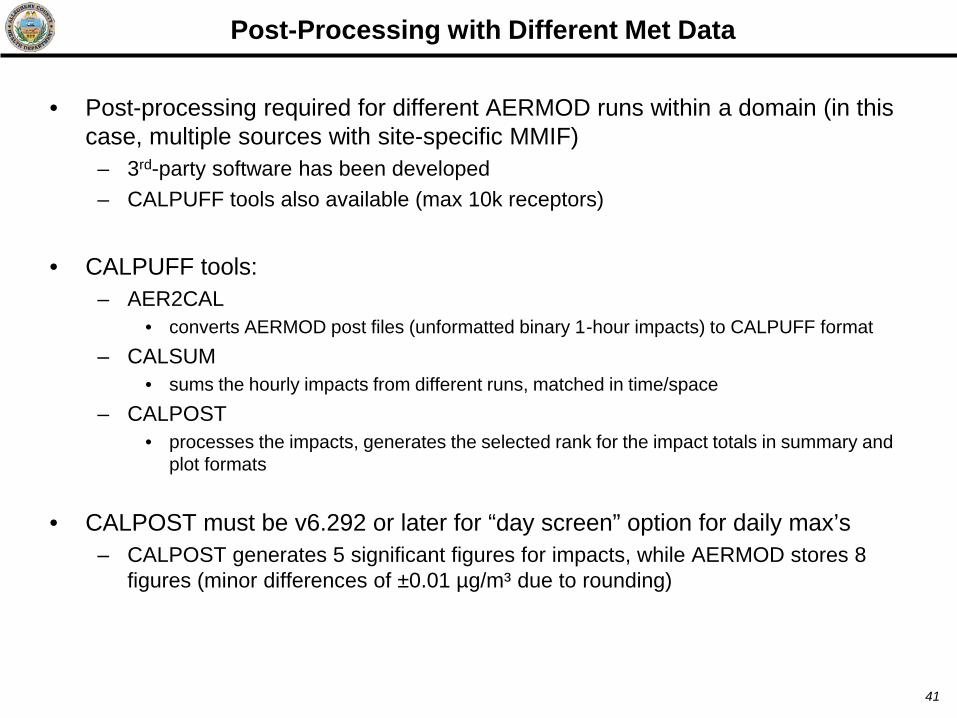
• Post-processing required for different AERMOD runs within a domain (in this case, multiple sources with site-specific MMIF)
– 3rd-party software has been developed– CALPUFF tools also available (max 10k receptors)
• CALPUFF tools:– AER2CAL
• converts AERMOD post files (unformatted binary 1-hour impacts) to CALPUFF format– CALSUM
• sums the hourly impacts from different runs, matched in time/space– CALPOST
• processes the impacts, generates the selected rank for the impact totals in summary and plot formats
• CALPOST must be v6.292 or later for “day screen” option for daily max’s– CALPOST generates 5 significant figures for impacts, while AERMOD stores 8
figures (minor differences of ±0.01 µg/m³ due to rounding)
Post-Processing with Different Met Data
41
• ADJ_U*– May be appropriate for in-valley, low wind situations in SWPA– With surface-based met, noticeably lower impacts
• For some scenarios, sort of like “correcting” airport data to make more localized• Also modifies sensible heat flux (H), M-O length, and mech. mixing height (Zim)
– With MMIF met, less of an effect• WRF turbulence scheme is already “adjusting” u* to an extent• Also modifies cloud cover (in addition to H and M-O length)
• LOWWIND– Corrects plume handling (not met data)– Can adjust near-field overprediction at hillsides using any met in SWPA– Reductions vary by source in complex terrain– LOWWIND3 leads to more subtle reductions than LOWWIND1/2– Difficult to evaluate performance without more monitors and towers
• Metrics or qualifiers to use low wind options– Modeled/monitored speeds during high impacts
AERMOD Options
42
• URBAN mode– An effective “industrial” population can be derived to represent heat islands
• Many assumptions go into the calculation– Modeled contours show too much of a ”pancake” effect in our complex terrain
• Boundary layer extends through full modeling domain• Surrounding area beyond industrial facilities are rural• Goal is to simulate “capped” emissions in NAA
– Heat island effect can be localized within facilities• Better to enhance plume rise for these sources, not adjust the SBL for all• BLP plume rise for buoyant line sources
• Half-life– Localized sulfates are evident based on PM speciation analysis– Conditions in the river valley can be conducive to transformation
• Periods of stagnation during inversions, with calm/low winds• High heat and condensate plumes from some sources
– Automatically invoked if urban mode is on (4-hr half-life for SO2)– Can enable half-life if modeling is rural– Effect is minimal – slightly lowered concentrations
AERMOD Options (cont.)
43
• Wind speed threshold– Little change in impacts at lower thresholds (0.3 m/s, 0.4 m/s)– Threshold of 0.5 m/s for calms is adequate (for steady-state)– Calms handling in general may still be “missing” impacts in stagnant conditions
• POINTHOR– Some release points in NAA are physically horizontal or diagonal stacks– Can lead to overprediction, also changes locations of hotspots– Likely better treated as vertical stacks in our NAA
• Stacks also have observed vertical flow, with heat and downwash
• POINTCAP– Results similar to horizontal stacks– Likely better to keep momentum for some capped stacks
AERMOD Options (cont.)
44
• Source screening performed for NAA– AERSCREEN
• If below SIL (3 ppb), screen out• If above SIL, use refined screening w/AERMOD
– AERMOD• If above SIL, examine background• If below background already to be added, examine monitored/wind data
– Monitor/met data• If concentrations were high from direction of source, include in final model• If concentrations were low, examine other factors
– Supplemental data• Concentration gradients (both cross-wind and along-wind)• Permits/controls, topography, federal/state rules, etc.• If evidence suggests source does/will not contribute to high days, screen out
– For intermittent sources, some are not applicable to allowable scenario• Examples: excess flares, emergency operations