1 Improvement Measurement plan in Vulnerable Children Program Orame Ngozi M&E/KM Advisor University Research Company Plot 432,AMMA House,Yakubu J. Pam st opposite National Hospital Abuja 18 th September 2013
Transcript
1
Improvement Measurement plan in Vulnerable Children
Program
Orame Ngozi
M&E/KM Advisor
University Research Company
Plot 432,AMMA House,Yakubu J. Pam st opposite National Hospital Abuja
18th September 2013
USAID Applying Science to Strengthen and Improve Systems
What Is Improvement Science? ‘Quality Improvement?’ (QI)
• The science underlying modern improvement draws on psychology, organizational behavior, adult learning, and statistical analysis of variation and is grounded in a systems understanding of work
2
USAID Applying Science to Strengthen and Improve Systems
Principles of Improvement
Fundamental Concept of Improvement: “Every system is perfectly designed to achieve exactly the results it achieves”Principles of Improvement:
Understanding work in terms of processes and systemsDeveloping solutions by teams of Health and care value chains providers with patients, target population, stakeholders & service providers
Focusing on target population and outcome/result
Testing and measuring effects of changes
Shared Learning
3
USAID Applying Science to Strengthen and Improve Systems
QI Framework
4
•The fundamental concept underlying improvement is that a system left unchanged can only be expected to continue to produce the same results.
•To achieve better performance, one must change the system.
•The approach also identifies unnecessary, redundant, or incorrect parts of processes and then changes them to yield streamlined and efficient care delivery.
USAID Applying Science to Strengthen and Improve Systems
What is improvement measurement plan ?
• A tool in the tool kit for the National Standard for Improving the Quality of Vulnerable Children Services in Nigeria.
• Performance Improvement Measurement in VC care documents what is done and how well it is done. The goal is to understand the basis for current procedure in order to improve the procedure and achieve an improved outcome.
5
USAID Applying Science to Strengthen and Improve Systems
Why improvement measurement plan ?
• This measurement plan will enables organizations to understand how well it is doing over time and provides continuous access to objective data to support claims of quality.
• The organization can verify the effectiveness of corrective actions, identify areas of excellence and compare its performance with that of peer organization using the same measure.
• Used to measure the performance of the standard based quality improvement approach in communities, local governments and states. This tool can also be used to identify positive deviants in communities, LG or states doing very well and those needing more support.
• The measurement plan can help users determine whether the changes that are being made in vulnerable children programs are leading to improvement.
N/B The use of quality improvement service standard approach will result into changes which may or not lead to improvement in the wellbeing of the vulnerable children.
Evidence has shown that “All improvement will require change, but not all change will result in improvement” G.Langley et al., The Improvement Guide, 1996.
6
USAID Applying Science to Strengthen and Improve Systems
Improvement Measurement tool
• Maturity Index
• Quality Improvement dash boards (Community, CSOs, LGA and State )
• Data Collect plan
• QI journal
7
USAID Applying Science to Strengthen and Improve Systems
How do we measure improvement
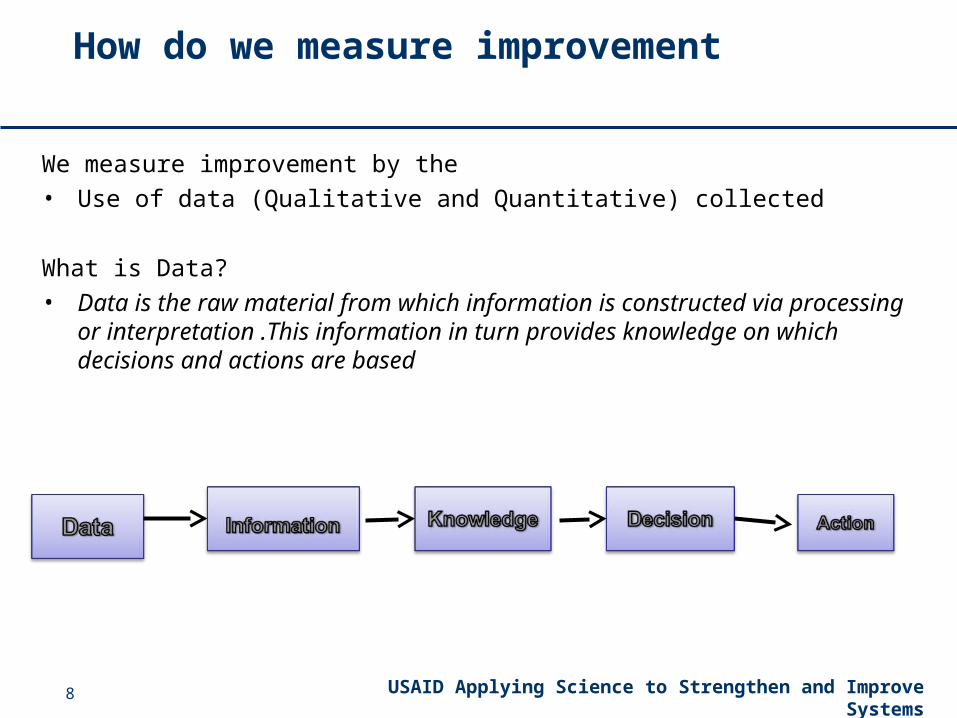
We measure improvement by the
• Use of data (Qualitative and Quantitative) collected
What is Data?
• Data is the raw material from which information is constructed via processing or interpretation .This information in turn provides knowledge on which decisions and actions are based
8
USAID Applying Science to Strengthen and Improve Systems
Data and Improvement
• Quality improvement is now a driving force in health care and is an essential aspect of service delivery at all levels.(Put simply, quality is everyone’s business).
• Unless we measure, it’s difficult to know exactly what to improve and whether we have in fact achieved improvement,
• Efforts to improve systems or processes must be driven by reliable data.
• Data not only enables us to accurately identify problems, it also assists to priorities quality improvement initiatives and enables objective assessment of whether change and improvement have indeed occurred.
• Collecting and analyzing data are therefore central to the function of quality improvement in provision of services to VC.
9
USAID Applying Science to Strengthen and Improve Systems
Data and Improvement cont……
With (good) data you can:
• assess current performance and identify performance gaps
• understand the needs and opinions of stakeholders
• priorities problems and improvement projects
• establish overall aims and targets for improvement
• establish a clear case for the need for improvement
• define the processes and people involved in the processes
• identify problem steps in the process
• identify and priorities opportunities for improvement
• establish clear objectives for improvement of process steps
• Identify opportunities for improvement
10
USAID Applying Science to Strengthen and Improve Systems
Data presentation
• The data collected is being presented using run charts
• Run chart is a simple and effective way to determine whether the changes you are making are leading to improvement or not. Run charts can also show a number of important information as listed below: how well our current process is performing whether we have reached an
aim how much variation is in our data/process whether the changes have resulted in an improvement whether a change has been sustained
11
USAID Applying Science to Strengthen and Improve Systems
Run chart example with sample results, comparing an aggregate result with a single site
12
USAID Applying Science to Strengthen and Improve Systems