1 INTRODUCTION AND OBJECTIVES Since the mid-1990s, the Maryland Biological Stream Survey (MBSS) has monitored and assessed the condition of the State’s non-tidal streams. Primary assessment tools include fish and benthic macroinvertebrate assemblages. The MBSS also collects relevant information on rare, threatened, and endangered species, stream water chemistry, physical habitat conditions, riparian zone characteristics, and other ancillary data (e.g., herpetofauna, crayfish, exotic plants) that contribute to our understanding of stream conditions. This guide provides a description of MBSS data and is organized by three MBSS “Rounds” (1995-1997; 2000-2004; 2007-2009). It includes descriptions of data tables and data fields within each table. Further background information and protocols can be found in several documents on the MBSS website at http://www.dnr.state.md.us/streams/mbss/index.html. 2 SUMMARY OF DATA TABLES The MBSS Program maintains a Microsoft Access (2002) database containing all data collected since 1995. The data are arranged into tables by general subject matter. Queries can be generated from these tables to create datasets for summary or analysis. Table 1. List of MBSS data tables Table Name Description MasterSiteList List of all sites sampled by the MBSS. Includes information on year, sample round, site type, and project. SiteInfo List of data types collected at each sample site SiteCoordinates Coordinate and watershed information for each sample site WaterChemistry Laboratory and field water chemistry Habitat Physical habitat measurements taken from sample site Discharge Stream flow and gradient measurement for sample site StreamBlockage Type and location of man-made stream blockages over six inches in height ErosionSeverity Extent and severity of bank erosion within sample site BufferStrip Buffer characteristics adjacent to sample site BufferBreak Type and severity of riparian buffer break AllBenthics List of benthic macroinvertebrate taxa collected from sample site BIBI Benthic Index of Biotic Integrity metrics values and scores and BIBI scores FishList Fish collected by electrofishing from sample site FIBI Fish Index of Biotic Integrity metrics values and scores and FIBI scores ExoticPlants Exotic plants observed near sample site HerpList Amphibians and reptiles observed near sample site Crayfish Crayfish observed near sample site CrayfishAbundance Crayfish abundance from sample site StreamSalamanders Abundance values for stream salamanders collected from sample site MusselList Freshwater mussels observed in sample site 3 GENERAL SITE INFORMATION This information describes the location of each sample site and the types of data collected. 3.1 MasterSiteList List of all sites sampled by the MBSS program since 1995. Table 2. Site variables available with MBSS data Field Name Data Type Round 1 Data Notes Round 2 Data Notes Round 3 Data Notes Defined Value List Definition SITEYR Char Site identification YEAR Num Calendar year sampled ROUND Num 1, 2, 3 Round 1 (1995-1997) Round 2 (2000-2004) Round 3 (2007-2009) STYPE Char A – Tier II B – MDE 319 Site type 1
Transcript
1 INTRODUCTION AND OBJECTIVES Since the mid-1990s, the Maryland Biological Stream Survey (MBSS) has monitored and assessed the condition of the State’s non-tidal streams. Primary assessment tools include fish and benthic macroinvertebrate assemblages. The MBSS also collects relevant information on rare, threatened, and endangered species, stream water chemistry, physical habitat conditions, riparian zone characteristics, and other ancillary data (e.g., herpetofauna, crayfish, exotic plants) that contribute to our understanding of stream conditions. This guide provides a description of MBSS data and is organized by three MBSS “Rounds” (1995-1997; 2000-2004; 2007-2009). It includes descriptions of data tables and data fields within each table. Further background information and protocols can be found in several documents on the MBSS website at http://www.dnr.state.md.us/streams/mbss/index.html. 2 SUMMARY OF DATA TABLES The MBSS Program maintains a Microsoft Access (2002) database containing all data collected since 1995. The data are arranged into tables by general subject matter. Queries can be generated from these tables to create datasets for summary or analysis.
Table 1. List of MBSS data tables
Table Name Description
MasterSiteList List of all sites sampled by the MBSS. Includes information on year, sample round, site type, and project.
SiteInfo List of data types collected at each sample site
SiteCoordinates Coordinate and watershed information for each sample site
WaterChemistry Laboratory and field water chemistry
Habitat Physical habitat measurements taken from sample site
Discharge Stream flow and gradient measurement for sample site
StreamBlockage Type and location of man-made stream blockages over six inches in height
ErosionSeverity Extent and severity of bank erosion within sample site
BufferStrip Buffer characteristics adjacent to sample site
BufferBreak Type and severity of riparian buffer break
AllBenthics List of benthic macroinvertebrate taxa collected from sample site
BIBI Benthic Index of Biotic Integrity metrics values and scores and BIBI scores
FishList Fish collected by electrofishing from sample site
FIBI Fish Index of Biotic Integrity metrics values and scores and FIBI scores
ExoticPlants Exotic plants observed near sample site
HerpList Amphibians and reptiles observed near sample site
Crayfish Crayfish observed near sample site
CrayfishAbundance Crayfish abundance from sample site
StreamSalamanders Abundance values for stream salamanders collected from sample site
MusselList Freshwater mussels observed in sample site 3 GENERAL SITE INFORMATION This information describes the location of each sample site and the types of data collected. 3.1 MasterSiteList List of all sites sampled by the MBSS program since 1995.
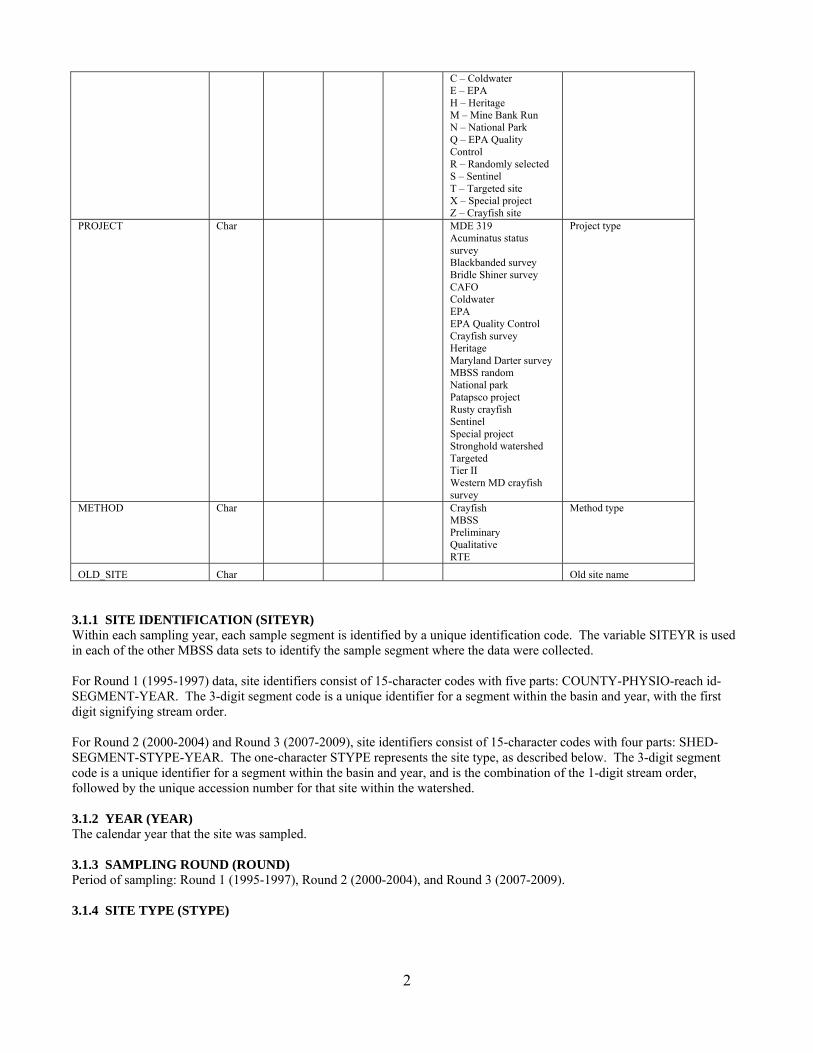
C – Coldwater E – EPA H – Heritage M – Mine Bank Run N – National Park Q – EPA Quality Control R – Randomly selected S – Sentinel T – Targeted site X – Special project Z – Crayfish site
PROJECT Char
MDE 319 Acuminatus status survey Blackbanded survey Bridle Shiner survey CAFO Coldwater EPA EPA Quality Control Crayfish survey Heritage Maryland Darter survey MBSS random National park Patapsco project Rusty crayfish Sentinel Special project Stronghold watershed Targeted Tier II Western MD crayfish survey
Project type
METHOD Char
Crayfish MBSS Preliminary Qualitative RTE
Method type
OLD_SITE Char Old site name 3.1.1 SITE IDENTIFICATION (SITEYR) Within each sampling year, each sample segment is identified by a unique identification code. The variable SITEYR is used in each of the other MBSS data sets to identify the sample segment where the data were collected. For Round 1 (1995-1997) data, site identifiers consist of 15-character codes with five parts: COUNTY-PHYSIO-reach id-SEGMENT-YEAR. The 3-digit segment code is a unique identifier for a segment within the basin and year, with the first digit signifying stream order. For Round 2 (2000-2004) and Round 3 (2007-2009), site identifiers consist of 15-character codes with four parts: SHED-SEGMENT-STYPE-YEAR. The one-character STYPE represents the site type, as described below. The 3-digit segment code is a unique identifier for a segment within the basin and year, and is the combination of the 1-digit stream order, followed by the unique accession number for that site within the watershed. 3.1.2 YEAR (YEAR) The calendar year that the site was sampled. 3.1.3 SAMPLING ROUND (ROUND) Period of sampling: Round 1 (1995-1997), Round 2 (2000-2004), and Round 3 (2007-2009). 3.1.4 SITE TYPE (STYPE)
2
Data were collected from various site types: random (R), Tier II (A), MDE 319 (B), Coldwater (C), EPA (E), DNR Heritage (H), Mine Bank Run (M), National Park (N), EPA quality control (Q), sentinel (S), targeted (T), special project (X), and crayfish (Z). 3.1.5 SAMPLING PROJECT (PROJECT) Specific project associated with each sample site. 3.1.6 SAMPLING METHOD (METHOD) Sampling method used for each site. See Stranko et al. (2007) for a more detailed description of field sampling protocols, including gear used, index periods, safety, training, and QA/QC. 3.2 SiteInfo List of data types collected at each sample site
Table 3. Site information variables available with MBSS data
Field Name Data Type
Round 1 Data Notes
Round 2 Data Notes
Round 3 Data Notes
Defined Value List Definition
SITEYR Char Site identification
ST_NAME Char Stream name
YEAR Num Calendar year sampled PHYSIO Char
A – Appalachian Plateau B – Blue Ridge N – North Coastal Plain P – Piedmont S – South Coastal Plain V – Valley & Ridge
Physiographic region
BASIN Char See Table 4 Drainage basin
ORDER Num 1, 2, 3, 4 Strahler stream order
SAMP_SPR Char Y, N Sampled spring
DATE_SPR Num mm/dd/yyyy Spring sampling date
SAMP_BEN Char See Table 5
Sampleability for benthic macroinvertebrates during the spring
SAMP_HAB Char See Table 5 Sampleability for physical habitat during the spring
SAMP_WQT Char See Table 5 Sampleability for water quality during the spring
SAMP_VERNPL Char n/a n/a See Table 5 Sampleability for vernal pools during the spring
VERNPLOBS Char n/a n/a P – Present A – Absent Vernal pool observed
SAMP_SUM Char Y, N Sampled summer
DATE_SUM Num mm/dd/yyyy Summer sampling date
SAMPELEC Char See Table 5 Sampleability for electrofishing during the summer
SAMPHAB Char See Table 5 Sampleability for physical habitat during the summer
SAMPWATCHEM Char See Table 5 Sampleability for water quality during the summer
SAMPHERP Char See Table 5 Sampleability for reptiles and amphibians during the summer
SAMPMUSS Char See Table 5 Sampleability for mussels during the summer
SAMPSAV Char n/a n/a See Table 5
Sampleability for submerged aquatic vegetation during the summer
SAMPSALAM Char n/a n/a See Table 5 Sampleability for salamanders during the summer
3
SAMPCRAY Char n/a n/a See Table 5 Sampleability for crayfish during the summer
SAMPAQPLANT Char n/a n/a See Table 5 Sampleability for aquatic vegetation during the summer
SAMPEXOTPLANT Char n/a n/a See Table 5 Sampleability for exotic plants during the summer
3.2.1 PHYSIOGRAPHIC REGION (PHYSIO) One of the physiographic provinces with the state of Maryland (Figure 1). One letter codes for the variable PHYSIO are given in Table 3. The PHYSIO code is included as the second part of the SITEYR code for Round 1 data.
Figure 1. Maryland’s physiographic regions.
4
3.2.2 DRAINAGE BASIN (BASIN) Sampling sites for the MBSS were located in 17 distinct drainage basins (Figure 2). A basin is specified by a two-letter code (Table 4).
Figure 2. Maryland’s 6-digit river basins. Table 4. Drainage basin codes for each of Maryland’s 6-digit drainage basins.
Drainage Basin Code Basin Name BU Bush River
CK Choptank River
CR Chester River
CO Conewego Creek
EL Elk River
GU Gunpowder River
LP Lower Potomac River
MP Middle Potomac River
NO North Branch Potomac River
NW Nanticoke River
OC Ocean Coastal
PC Pocomoke River
PP Patapsco River
PW Washington Metro Potomac River
PX Patuxent River
SQ Susquehanna River
UP Upper Potomac River
WC West Chesapeake
YG Youghiogheny River
5
3.2.3 STREAM ORDER (ORDER) The Strahler convention (Strahler 1957) was used for ranking stream reaches by order. 3.2.4 SAMPLEABILITY (SAMP_SPR, SAMP_SUM) Spring sampleability indicates whether or not a site was able to be sampled during the spring index period. Sampleability is indicated by “Y” or “N”. A site’s spring sampleability is defined as yes if the site was sampleable for any of the following parameters: water quality, spring physical habitat, or benthic macroinvertebrates. A site’s sampleability is defined as no if none of the parameters were sampleable. Summer sampleability indicates whether or not a site was able to be sampled during the summer index period. Sampleability is indicated by “Y” or “N”. A site’s summer sampleability is defined as yes if the site was sampleable for any of the following parameters: electrofishing, summer physical habitat, water quality, herpetofauna, mussels, salamanders, or crayfish. A site’s sampleability is defined as no if none of the parameters were sampleable. MBSS field biologists recorded specific reasons why sites were considered unsampleable. Table 5 defines the sampleability codes. Table 5. Sampleability codes for MBSS sampling events
Sampleability Code Definition S Sampleable 1 Dry streambed 2 Too deep 3 Marsh, no defined channel 4 Excessive vegetation 5 Impoundment 6 Tidally influenced 7 Permission denied 8 Unsafe 9 Beaver
10 Other 3.3 SiteCoordinates Coordinate and watershed information for each sample site.
Table 6. Site coordinate variables available with MBSS data
Field Name Data Type
Round 1 Data Notes
Round 2 Data Notes
Round 3 Data Notes Defined Value List Definition
SITEYR Char Site identification
Year Num Year sampled
StreamName Char Stream name
Northing83 Num Maryland plane coordinate (NAD83)
Easting83 Num Maryland plane coordinate (NAD83)
Latitude83 Num Latitude (decimal degree)
Longitude83 Num Longitude (decimal degree)
MDE6Digit Num Maryland 6-digit watershed code
MDE6Name Char Maryland 6-digit watershed name
Basin Char See Table 4 Drainage basin
MDE8Digit Num Maryland 8-digit watershed code
MDE8Name Char Maryland 8-digit watershed name
SHEDNUM Num Last 4 digits of the Maryland 12-digit watershed code
DNR12DIG Num Maryland 12-digit watershed
6
code
CountyName Char See Table 7 County name
CountyCode Char County code
BIBIStrata Char Coastal, Epiedmont, Highland Benthic IBI strata
FIBIStrata Char Coastal, Epiedmont, Highland, Cold Fish IBI strata
3.3.1 MARYLAND STATE PLANE COORDINATES (Northing83, Easting83) Using the Maryland State Plane Coordinate System, the geographic location of the sample site is specified using a pair of coordinates (Northing83 and Easting83). MBSS Maryland State Plane Coordinates are based on the North American Datum 1983, the basis of the 1987 Maryland Coordinate System. These coordinates are given in meters. 3.3.2 LATITUDE AND LONGITUDE (Latitude83, Longitude83) The location of the sample site is specified using a pair of geographic coordinates, latitude (Latitude83) and longitude (Longitude83). These coordinates are given in decimal degrees. 3.3.3 WATERSHED CODES AND NAMES (MDE6Digit, MDE6Name, MDE8Digit, MDE8Name, DNR12Digit) This code identifies the watershed where the site is located. Maryland’s 17 6-digit watersheds are represented by MDE6Digit and MDE6Name. MDE8Digit and MDE8Name refer to the 8-digit Hydrologic Unit Code (HUC) assigned to each of the 138 intermediate-size watersheds by the Maryland Department of the Environment (MDE) and DNR. Each 12-digit watershed identifier, corresponding to local watersheds, is represented by DNR12DIG. 3.3.4 COUNTY (CountyName, CountyCode) The variable specifies one of 24 counties within the state of Maryland, as designated by political boundaries (Figure 3). Two-letter codes for the counties are given in Table 7.
Figure 3. Maryland’s counties
7
Table 7. County codes for each of Maryland’s counties County Code County Name
AA Anne Arundel AL Allegany BA Baltimore BC Baltimore City CA Calvert CE Cecil CH Charles CN Caroline CR Carroll DO Dorchester FR Frederick GA Garrett HA Harford HO Howard KE Kent MO Montgomery PG Prince George’s QA Queen Anne’s SM St. Mary’s SO Somerset TA Talbot WA Washington WI Wicomico WO Worcester
3.3.5 STRATUM (BIBIStrata, FIBIStrata) Calculation of the biotic indices requires knowledge of the physiographic stratum in which each site is located. The strata used for benthic IBI calculations are: Coastal, Epiedmont, and Highland. The strata used for fish IBI calculations are: Coastal, Epiedmont, Highland, and Cold (Southerland et al. 2005). 4 FIELD MEASUREMENTS Data collected from field visits to the sample sites. 4.1 WaterChemistry Roth et al. 2005 provides details regarding analytical methods and detection limits.
Table 8. Water chemistry variables available with MBSS data
Field Name Data Type
Round 1 Data Notes
Round 2 Data Notes
Round 3 Data Notes Defined Value List Definition
SITEYR Char Site identification
ST_NAME Char Stream name
YEAR Num Year sampled
ROUND Num Round sampled
SAMP_WQT_LAB Char See Table 5. Sampleability codes
Sampled water quality laboratory
SAMP_WQT_FLD Char See Table 5. Sampleability codes
Sampled water quality field
PH_LAB Num Lab pH
COND_LAB Num Lab conductance (µmho/cm)
ANC_LAB Num Acid Neutralizing Capacity (µeq/L)
DOC_LAB Num Dissolved organic carbon (mg/L)
CL_LAB Num n/a Chloride (mg/L)
SO4_LAB Num Sulfate (mg/L)
TN Num n/a Total nitrogen (mg/L)
TP Num n/a Total phosphorus (mg/L)
8
O_PHOS Num n/a Ortho-Phosphate (mg/L)
NH3 Num n/a Ammonia (mg/L)
NO2 Num n/a Nitrite nitrogen (mg/L)
NO3_LAB Num Nitrate nitrogen (mg/L)
TEMP_FLD Num In-situ water temperature (° C)
DO_FLD Num Dissolved oxygen (mg/L)
PH_FLD Num In-situ pH
COND_FLD Num In-situ conductance (µmho/cm)
TURB_FLD Num n/a In-situ turbidity (NTU)
4.1.1 SPRING AND SUMMER pH (PH_LAB, PH_FLD) The spring pH (pH_LAB) and the in situ summer pH (PH_FLD) are given in standard pH units.
4.1.2 SPRING AND SUMMER CONDUCTANCE (COND_LAB, COND_FLD) Conductance in both the spring (COND_LAB) and summer (COND_FLD) is given in μmho/cm.
4.1.3 ACID NEUTRALIZING CAPACITY (ANC_LAB) Acid neutralizing capacity is given in μeq/L.
4.1.4 CARBON ANALYTES (DOC_LAB) Dissolved organic carbon concentration is given in mg/L.
4.1.5 CHLORIDE (CL) Chloride concentration is given in mg/L.
4.1.6 SULFATE (SO4_LAB) Sulfate, nitrate nitrogen, and dissolved organic carbon concentrations are given in mg/L.
4.1.7 NITROGEN ANALYTES (NO3_LAB, NO2, NH3, TN) Nitrogen analytes included nitrate-nitrogen, nitrite-nitrogen, ammonia-nitrogen, and total nitrogen. Concentrations appear in mg/L.
4.1.8 PHOSPHORUS ANALYTES (O_PHOS, TP) Phosphorus analytes include ortho-phosphate (also called reactive phosphorus) and total phosphate. Concentrations appear in mg/L.
4.1.9 TEMPERATURE (TEMP_FLD) Temperature is given in ˚C (degrees Celsius). Stream temperature measurements occur during summer field sampling events using an electronic multimeter.
4.1.10 DISSOLVED OXYGEN (DO_FLD) Dissolved oxygen is given in mg/L.
4.1.11 SUMMER TURBIDITY (TURB_FLD) Stream turbidity is measured during summer field sampling. Data are provided in Nephelometric Turbidity Units (NTUs).
9
4.2 Habitat Physical habitat measurements taken from sample site reaches. Descriptions of all MBSS physical habitat measurements can be found in Stranko 2007; page 47.
Table 9. Physical habitat variables available with MBSS data
Field Name Data Type
Round 1 Data Notes
Round 2 Data Notes
Round 3 Data Notes Defined Value List Definition
SITEYR Char Site identification
ST_NAME Char Stream name
YEAR Num Year sampled
PASTURE Char Y, N Presence of pasture land
CHANNEL Char Y, N Evidence of channel straightening or dredging
CONCRETE Char Y, N Presence of concrete/gabion
EFF_DIS Char Y, N Presence of effluent discharge
BEAVPND Char Y, N Presence of beaver pond
INSTRHAB Num 0-20 Instream habitat structure
EPI_SUB Num 0-20 Epifaunal substrate
VEL_DPTH Num 0-20 Velocity/depth diversity
POOLQUAL Num 0-20 Pool/glide/eddy quality
EXPOOL Num Extent of pool or glide (m)
RIFFQUAL Num 0-20 Riffle/run quality
EXRIFRUN Num Extent of riffle or run (m)
CHAN_ALT Num 0-20 Channel alteration
BAR_FORM Char Bar formation
BANKSTAB Num 0-20 Bank stability
EMBEDDED Num 0-100 Embeddedness (%)
CH_FLOW Num n/a n/a 0-100 Channel flow status (% channel filled with water)
SHADING Num 0-100 Shading (%)
REMOTE Num n/a n/a 0-20 Remoteness score
DIST_RD Num n/a Distance to nearest road (m)
AESTHET Num 0-20 Trash rating
WOOD_DEB Num n/a Number of woody debris
NUMROOT Num n/a Number of rootwads
INSTREAMWOOD Num n/a n/a Number of instream woody debris
DEWATERWOOD Num n/a n/a Number of dewatered woody debris
INSTREAMROOT Num n/a n/a Number of instream rootwads
DEWATERROOT Num n/a n/a Number of dewatered rootwads
RIP_WID Num n/a Riparian buffer width (m)
RV_WID_L Num n/a Riparian buffer width, left bank (m)
RV_WID_R Num n/a Riparian buffer width, right bank (m)
ADJ_COVR Char
n/a FR – forest OF – old forest EM – emergent vegetation LN – mowed lawn TG – tall grass LO – logged area SL – bar soil RR – railroad PV – paved road PK – parking lot
Adjacent land cover type
10
GR – gravel road DI – dirt road PA – pasture OR – orchard CP – cropland HO - housing
AdjCoverL Char n/a n/a Adjacent land cover type, left bank
AdjCoverR Char n/a n/a Adjacent land cover type, right bank
MAXDEPTH Num Maximum depth in sample reach (cm)
AVGWID Num Average wetted width (m)
AVGTHAL Num Average thalweg depth (cm)
AVG_VEL Num Average velocity (m/s)
COB_BAR Char n/a Y, N Cobble bar substrate present
GRAV_BAR Char n/a Y, N Gravel bar substrate present
SAND_BAR Char n/a Y, N Sand bar substrate present
SC_BAR Char n/a Y, N Silt/clay bar substrate present
BRAIDED Char n/a
A – Absent P – Present E – Extensive Presence of stream braiding
RIFFLE Char n/a
A – Absent P – Present E – Extensive Presence of stream riffles
RUNGLIDE Char n/a
A – Absent P – Present E – Extensive Presence of runs and glides
DEEPOOL Char n/a
A – Absent P – Present E – Extensive Presence of deep pools
SHALPOOL Char n/a
A – Absent P – Present E – Extensive Presence of shallow pools
LRGBOULD Char n/a
A – Absent P – Present E – Extensive Presence of large boulders
SMBOULD Char n/a
A – Absent P – Present E – Extensive Presence of small boulders
COBBLE Char n/a
A – Absent P – Present E – Extensive Presence of cobbles
BEDROCK Char n/a
A – Absent P – Present E – Extensive Presence of bedrock
GRAVEL Char n/a
A – Absent P – Present E – Extensive Presence of gravel
SAND Char n/a
A – Absent P – Present E – Extensive Presence of sand
SILTCLAY Char n/a
A – Absent P – Present E – Extensive Presence of silt and clay
UNDERCUT Char n/a
A – Absent P – Present E – Extensive Presence of undercut banks
OH_COVER Char n/a
A – Absent P – Present E – Extensive Presence of overhead cover
PHI_98 Num n/a 1-5 Physical habitat index (1998)
PHI_05 Num n/a n/a 1-5 New physical habitat index (2005)
11
4.2.1 INSTREAM HABITAT QUALITY (INSTRHAB) Instream habitat is rated based on perceived value of the habitat to the fish community. Higher scores are assigned to sites with a variety of habitats and particle sizes. Scores range from 0 (poor) to 20 (optimal). 4.2.2 EPIFAUNAL SUBSTRATE (EPI_SUB) Epifaunal substrate is rated based on the amount and variety of hard, stable substrates useable by benthic macroinvertebrates. Scores range from 0 (poor) to 20 (optimal). 4.2.3 VELOCITY AND DEPTH DIVERSITY (VEL_DPTH) Velocity depth and diversity is based on the variety of velocity/depth regimes present at the site. Scores range from 0 (poor) to 20 (optimal). 4.2.4 POOL QUALITY AND EXTENT (POOLQUAL, EXPOOL) Pool quality is based on the variety and special complexity of slow- or still-water habitat within the sample segment. Scores range from 0 (poor) to 20 (optimal). The linear extent of the pools within the site segment is recorded in m. 4.2.5 RIFFLE QUALITY AND EXTENT (RIFFQUAL, EXRIFRUN) Riffle quality is based on the depth, complexity, and functional importance of riffle/run habitat present at the site. The linear extent of the riffle/run habitat within the site segment is recorded in m. 4.2.6 SUBSTRATE EMBEDDEDNESS (EMBEDDED) Substrate embeddedness is presented as the percentage of the surface area of larger particles that is surrounded by fine sediments and/or floc on the stream bottom. 4.2.7 CHANNEL FLOW (CH_FLOW) Channel flow is presented as the percentage of the stream channel containing water. 4.2.8 WOODY DEBRIS AND ROOTWADS (WOOD_DEB, INSTREAMWOOD, DEWATERWOOD, NUMROOT, INSTREAMROOT, DEWATERROOT) The number of pieces of woody debris (WOOD_DEB) and the number of rootwads (NUMROOT) at each site were recorded during the Round 1 and 2 periods. For Round 3, distinctions were made for instream woody debris (INSTREAMWOOD) and rootwads (INSTREAMROOT) and for dewatered dewatered woody debris (DEWATWOOD) and rootwads (DEWATERROOT). 4.2.9 PERCENTAGE OF CHANNEL SHADED (SHADING) The percentage of the channel shaded refers to the shading extent and duration during the summer. A site that is fully exposed all day during the summer would have 0% shading, while a site that is fully shaded all day during the summer would have 100% shading. 4.2.10 REMOTENESS (REMOTE, DIST_RD) Remoteness scores the relative absence of human activity and the difficulty of accessing the site segment. Scores range from 0 (poor) to 20 (optimal). For Round 2 and 3, the distance to the nearest road was determined and recorded in m. 4.2.11 AESTHETICS (AESTHET) The aesthetic rating is based on the visual appeal of the site and the presence or absence of human refuse. Scores range from 0 (poor) to 20 (optimal). 4.2.12 RIPARIAN BUFFER WIDTH (RIP_WID, RIP_WID_L, RIP_WID_R) The width of the vegetated riparian buffer was estimated in m, to a maximum of 50 m. If a buffer break was observed, the riparian buffer width equals zero. 4.2.13 BUFFER TYPE AND ADJACENT LAND COVER (ADJ_COVR, Adj_coverL, Adj_coverR) The dominant type of riparian buffer is described by one of the vegetative cover codes. 4.2.14 MAXIMUM DEPTH (MAXDEPTH) Maximum stream depth with the 75 m segment, recorded in cm.
12
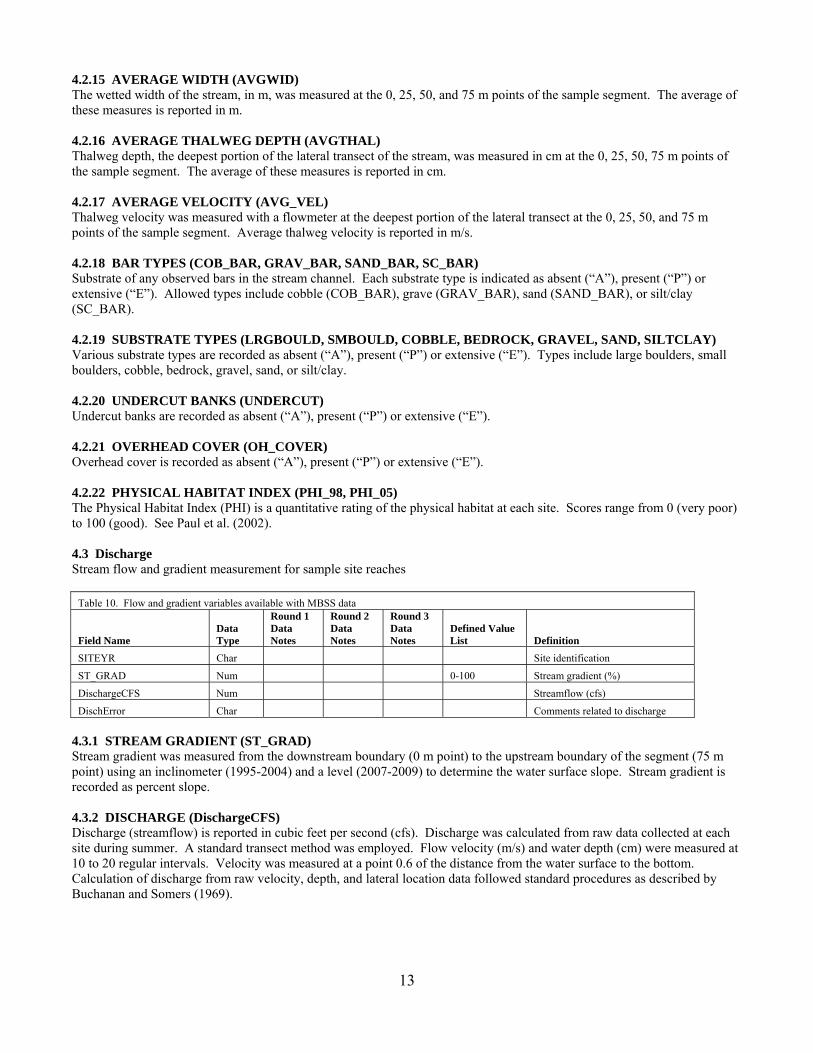
4.2.15 AVERAGE WIDTH (AVGWID) The wetted width of the stream, in m, was measured at the 0, 25, 50, and 75 m points of the sample segment. The average of these measures is reported in m. 4.2.16 AVERAGE THALWEG DEPTH (AVGTHAL) Thalweg depth, the deepest portion of the lateral transect of the stream, was measured in cm at the 0, 25, 50, 75 m points of the sample segment. The average of these measures is reported in cm. 4.2.17 AVERAGE VELOCITY (AVG_VEL) Thalweg velocity was measured with a flowmeter at the deepest portion of the lateral transect at the 0, 25, 50, and 75 m points of the sample segment. Average thalweg velocity is reported in m/s. 4.2.18 BAR TYPES (COB_BAR, GRAV_BAR, SAND_BAR, SC_BAR) Substrate of any observed bars in the stream channel. Each substrate type is indicated as absent (“A”), present (“P”) or extensive (“E”). Allowed types include cobble (COB_BAR), grave (GRAV_BAR), sand (SAND_BAR), or silt/clay (SC_BAR). 4.2.19 SUBSTRATE TYPES (LRGBOULD, SMBOULD, COBBLE, BEDROCK, GRAVEL, SAND, SILTCLAY) Various substrate types are recorded as absent (“A”), present (“P”) or extensive (“E”). Types include large boulders, small boulders, cobble, bedrock, gravel, sand, or silt/clay. 4.2.20 UNDERCUT BANKS (UNDERCUT) Undercut banks are recorded as absent (“A”), present (“P”) or extensive (“E”). 4.2.21 OVERHEAD COVER (OH_COVER) Overhead cover is recorded as absent (“A”), present (“P”) or extensive (“E”). 4.2.22 PHYSICAL HABITAT INDEX (PHI_98, PHI_05) The Physical Habitat Index (PHI) is a quantitative rating of the physical habitat at each site. Scores range from 0 (very poor) to 100 (good). See Paul et al. (2002). 4.3 Discharge Stream flow and gradient measurement for sample site reaches
Table 10. Flow and gradient variables available with MBSS data
Field Name Data Type
Round 1 Data Notes
Round 2 Data Notes
Round 3 Data Notes
Defined Value List Definition
SITEYR Char Site identification
ST_GRAD Num 0-100 Stream gradient (%)
DischargeCFS Num Streamflow (cfs)
DischError Char Comments related to discharge 4.3.1 STREAM GRADIENT (ST_GRAD) Stream gradient was measured from the downstream boundary (0 m point) to the upstream boundary of the segment (75 m point) using an inclinometer (1995-2004) and a level (2007-2009) to determine the water surface slope. Stream gradient is recorded as percent slope. 4.3.2 DISCHARGE (DischargeCFS) Discharge (streamflow) is reported in cubic feet per second (cfs). Discharge was calculated from raw data collected at each site during summer. A standard transect method was employed. Flow velocity (m/s) and water depth (cm) were measured at 10 to 20 regular intervals. Velocity was measured at a point 0.6 of the distance from the water surface to the bottom. Calculation of discharge from raw velocity, depth, and lateral location data followed standard procedures as described by Buchanan and Somers (1969).
13
4.4 StreamBlockage Type and location of man-made stream blockages.
Table 11. Stream blockage variables available with MBSS data
Field Name Data Type
Round 1 Data Notes
Round 2 Data Notes
Round 3 Data Notes
Defined Value List Definition
SITEYR Char n/a Site identification
YEAR Num n/a Year sampled
ChannelizedYN Char n/a Y, N Evidence of channel straightening or dredging
ConcreteL Num n/a Extent of concrete along the left bank of the reach (m)
ConcreteB Num n/a Extent of concrete along the bottom of the reach (m)
ConcreteR Num n/a Extent of concrete along the right bank of the reach (m)
GabionL Num n/a Extent of gabion along the left bank of the reach (m)
GabionB Num n/a Extent of gabion along the bottom of the reach (m)
GabionR Num n/a Extent of gabion along the right bank of the reach (m)
RiprapL Num n/a Extent of riprap along the left bank of the reach (m)
RiprapB Num n/a Extent of riprap along the bottom of the reach (m)
RiprapR Num n/a Extent of riprap along the right bank of the reach (m)
BermL Num n/a Extent of earthen berm along the left bank of the reach (m)
BermR Num n/a Extent of earthen berm along the right bank of the reach (m)
DredgeL Num n/a Extent of dredge material along the left bank of the reach (m)
DredgeR Num n/a Extent of dredge material along the right bank of the reach (m)
PipeL Num n/a Extent of pipe along the left bank of the reach (m)
PipeB Num n/a Extent of pipe along the bottom of the reach (m)
PipeR Num n/a Extent of pipe along the right bank of the reach (m)
CulvertPresent Char n/a Y, N Culvert present
CulvertSampled Char n/a Y, N Culvert sampleable
CulvertWidth Num n/a Width of culvert (m)
CulvertLength Num n/a Length of culvert (m)
StreamBlockLat Num n/a Latitude of stream blockage
StreamBlockLong Num n/a Longitude of stream blockage
StreamBlockHeight Num n/a Height of stream blockage (m) StreamBlockType Char n/a
DM – Dam PC – Pipe culvert F – Fishway G – Gabion PX – Pipeline crossing AC – Arch culvert BC – Box culvert GW – gaging station
Type of stream blockage
4.4.1 CHANNELIZATION (ChannelizedYN) Evidence of stream channelization within the sample reach. The allowed values include “Y” or “N”.
14
4.4.2 CONCRETE (ConcreteL, ConcreteB, ConcreteR) Linear extent of concrete along each bank and the stream bottom measured in m. 4.4.3 GABION (GabionL, GabionB, GabionR) Linear extent of gabion baskets along each bank and the stream bottom measured in m. 4.4.4 RIPRAP (RiprapL, RiprapB, RiprapR) Linear extent of riprap material along each bank and the stream bottom measured in m. 4.4.5 BERM (BermL, BermR) Linear extent of earthen berm along each bank measured in m. 4.4.6 DREDGE (DredgeL, DredgeR) Linear extent of dredge material along each bank measured in m. 4.4.7 PIPE (PipeL, PipeB, PipeR) Linear extent of pipe along each bank and the stream bottom measured in m. 4.4.8 CULVERT (CulvertPresent, CulvertSampled, CulvertWidth, CulvertLength) The presence of culvert within the site. Sampleability of the culvert using standard MBSS methods is indicated using “Y” or “N”. Culvert width and culvert length were measured in m. 4.4.9 STREAM BLOCKAGE (StreamBlockLat, StreamBlockLong, StreamBlockHeight, StreamBlockType) Latitude and longitude of stream blockage in decimal degrees. Stream blockage height measured in m. Stream blockage type from Instream Blockage Codes found in Table 11. 4.5 ErosionSeverity Extent and severity of bank erosion within sample site reaches
Table 12. Bank erosion variables available with MBSS data
Field Name Data Type
Round 1 Data Notes
Round 2 Data Notes
Round 3 Data Notes
Defined Value List Definition
SITEYR Char n/a Site identification
Year Num n/a Year sampled
ErodedExtentL Num n/a Extent of erosion along left bank (m)
ErodedExtentR Num n/a Extent of erosion along right bank (m)
ErosionSeverityL Num n/a 0, 1, 2, 3 Erosion severity along left bank
ErosionSeverityR Num n/a 0, 1, 2, 3 Erosion severity along right bank
ErodedHeightL Num n/a Average height of erosion on left bank (m)
ErodedHeightR Num n/a Average height of erosion on right bank (m)
4.5.1 EROSION (ErodedExtent, ErosionSeverity, ErodedHeight) The extent, severity, and height of bank erosion within the sample reach. Extent and height are measured in m. Severity is given a score of 0 to 3, with 0 indicating no erosion and 3 indicating severe bank erosion. 4.6 BufferStrip Buffer characteristics adjacent to sample site reaches
Table 13. Buffer strip variables available with MBSS data
Field Name Data Type
Round 1 Data Notes
Round 2 Data Notes
Round 3 Data Notes Defined Value List Definition
15
SITEYR Char n/a Site identification
YEAR Num n/a Year sampled
RipVegWidthL Num n/a 0-50 Average riparian buffer width, left bank (m)
RipVegWidthR Num n/a 0-50 Average riparian buffer width, right bank (m)
AdjCoverL Char n/a
FR – Forest OF – Old forest EM – Emergent vegetation LN – Mowed lawn TG – Tall grass LO – Logged area SL – Bare soil RR – Railroad PV – Paved Road PK – Parking lot GR – Gravel road DI – Dirt road PA – Pasture OR – Orchard CP – Cropland HO - Housing
Adjacent land cover type, left bank
AdjCoverR Char n/a
FR – Forest OF – Old forest EM – Emergent vegetation LN – Mowed lawn TG – Tall grass LO – Logged area SL – Bare soil RR – Railroad PV – Paved Road PK – Parking lot GR – Gravel road DI – Dirt road PA – Pasture OR – Orchard CP – Cropland HO - Housing
Adjacent land cover type, right bank
VegType1L Char n/a
G – Grasses R – Regen deciduous trees/shrubs (<4” DBH) Y – Young deciduous trees (4-12” DBH) M – Mature deciduous trees (12-24” DBH) O – Old deciduous trees (>24” DBH) A – Regen coniferous trees (<4” DBH) B – Young coniferous trees (4-12” DBH) C – Mature coniferous trees (12-24” DBH) D – Old coniferous trees (>24” DBH) L – Lawn
Primary buffer vegetation type, left bank
VegType1R Char n/a
G – Grasses R – Regen deciduous trees/shrubs (<4” DBH) Y – Young deciduous trees (4-12” DBH) M – Mature deciduous trees (12-24” DBH) O – Old deciduous trees (>24” DBH) A – Regen coniferous trees (<4” DBH) B – Young coniferous trees (4-12” DBH)
Primary buffer vegetation type, right bank
16
C – Mature coniferous trees (12-24” DBH) D – Old coniferous trees (>24” DBH) L – Lawn
VegType2L Char n/a Secondary buffer vegetation type, left bank
VegType2R Char n/a Secondary buffer vegetation type, right bank
VegType3L Char n/a Tertiary buffer vegetation type, left bank
VegType3R Char n/a Tertiary buffer vegetation type, right bank
VegType4L Char n/a Quaternary buffer vegetation type, left bank
VegType4R Char n/a Quaternary buffer vegetation type, right bank
RipBufferBreakL Char n/a Y, N Buffer break present, left bank
RipBufferBreakR Char n/a Y, N Buffer break present, right bank
4.6.1 RIPARIAN BUFFER WIDTH (RIP_WID_L, RIP_WID_R) The width of the vegetated riparian buffer was estimated in meters, to a maximum of 50 m. If a buffer break was observed, the riparian buffer width equals zero. 4.6.2 BUFFER TYPE AND ADJACENT LAND COVER (Adj_coverL, Adj_coverR) The dominant type of riparian buffer is described by one of the vegetative cover codes. 4.6.3 VEGETATION TYPE (VegTypeL, VegTypeR) The type of land cover immediately adjacent to the stream buffer. If the buffer is 50 m or more, then the same code recorded for the buffer was recorded for the adjacent land cover. 4.7 BufferBreaks Type and severity of riparian buffer break
Table 14. Buffer break variables available with MBSS data
Field Name Data Type
Round 1 Data Notes
Round 2 Data Notes
Round 3 Data Notes Defined Value List Definition
SITEYR Char n/a Site identification
Year Num n/a Year sampled
BufferBreakSide Char n/a L, R Side of bank with buffer break
BufferBreakType Char n/a
Storm drain Tile drain Impervious drainage Gully Orchard Crop Pasture New construction Dirt road Gravel road Railroad
Type of buffer break
BufferBreakSeverity Char n/a M – Minor S – Severe Severity of buffer break
4.7.1 BUFFER BREAK TYPES (BufferBreakType, BufferBreakSeverity) If a buffer break is observed, the severity of the break is recorded as minor (M) or severe (S) along with the buffer break type (Table 14).
17
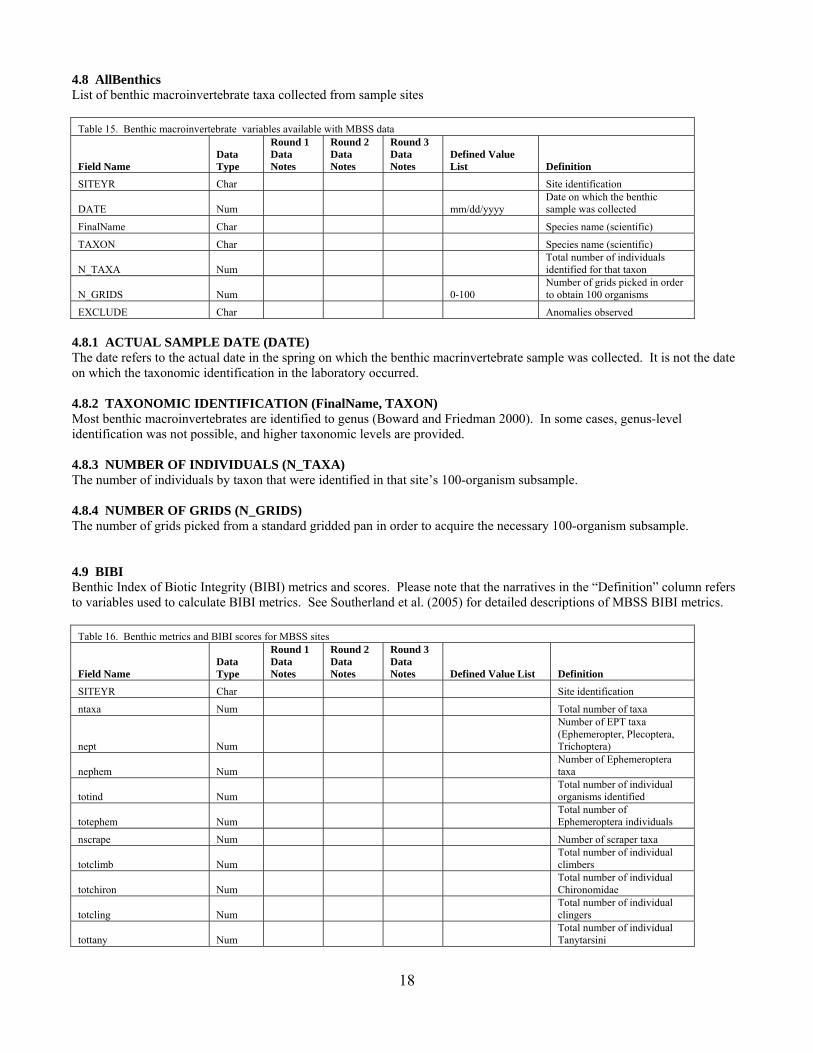
4.8 AllBenthics List of benthic macroinvertebrate taxa collected from sample sites
Table 15. Benthic macroinvertebrate variables available with MBSS data
Field Name Data Type
Round 1 Data Notes
Round 2 Data Notes
Round 3 Data Notes
Defined Value List Definition
SITEYR Char Site identification
DATE Num mm/dd/yyyy Date on which the benthic sample was collected
FinalName Char Species name (scientific)
TAXON Char Species name (scientific)
N_TAXA Num Total number of individuals identified for that taxon
N_GRIDS Num 0-100 Number of grids picked in order to obtain 100 organisms
EXCLUDE Char Anomalies observed 4.8.1 ACTUAL SAMPLE DATE (DATE) The date refers to the actual date in the spring on which the benthic macrinvertebrate sample was collected. It is not the date on which the taxonomic identification in the laboratory occurred. 4.8.2 TAXONOMIC IDENTIFICATION (FinalName, TAXON) Most benthic macroinvertebrates are identified to genus (Boward and Friedman 2000). In some cases, genus-level identification was not possible, and higher taxonomic levels are provided. 4.8.3 NUMBER OF INDIVIDUALS (N_TAXA) The number of individuals by taxon that were identified in that site’s 100-organism subsample. 4.8.4 NUMBER OF GRIDS (N_GRIDS) The number of grids picked from a standard gridded pan in order to acquire the necessary 100-organism subsample. 4.9 BIBI Benthic Index of Biotic Integrity (BIBI) metrics and scores. Please note that the narratives in the “Definition” column refers to variables used to calculate BIBI metrics. See Southerland et al. (2005) for detailed descriptions of MBSS BIBI metrics.
Table 16. Benthic metrics and BIBI scores for MBSS sites
Field Name Data Type
Round 1 Data Notes
Round 2 Data Notes
Round 3 Data Notes Defined Value List Definition
SITEYR Char Site identification
ntaxa Num Total number of taxa
nept Num
Number of EPT taxa (Ephemeropter, Plecoptera, Trichoptera)
nephem Num Number of Ephemeroptera taxa
totind Num Total number of individual organisms identified
totephem Num Total number of Ephemeroptera individuals
nscrape Num Number of scraper taxa
totclimb Num Total number of individual climbers
totchiron Num Total number of individual Chironomidae
totcling Num Total number of individual clingers
tottany Num Total number of individual Tanytarsini
18
totscrape Num Total number of individual scrapers
totswim Num Total number of individual swimmers
totdipt Num Total number of individual Diptera
totintol_urb Num Total number of individual intolerant urban
pephem Num 0-100 Percentage of Ephemeroptera
pclimb Num 0-100 Percentage of climbers
pchiron Num 0-100 Percentage of Chironomidae
pcling Num 0-100 Percentage of clingers
ptany Num 0-100 Percentage of Tanytarsini
pscrape Num 0-100 Percentage of scrapers
pswim Num 0-100 Percentage of swimmers
pdipt Num 0-100 Percentage of Diptera
pintol_urb Num 0-100 Percentage intolerant urban
BIBIStrata Char Coastal, Epiedmont, Highland Benthic IBI stratum
sc_ntaxa Num 1, 3, 5 Score for number of taxa
sc_nept Num 1, 3, 5 Score for number of EPT taxa
sc_nepehm Num 1, 3, 5 Score for number of Ephemeroptera taxa
sc_pintol_urb Num 1, 3, 5 Score for percentage intolerant urban
sc_pephem Num 1, 3, 5 Score for percentage Ephemeroptera
sc_nscrape Num 1, 3, 5 Score for number of scraper taxa
sc_pclimb Num 1, 3, 5 Score for percentage climbers
bibi_05 Num 1-5 Final calculated benthic index of biotic integrity (2005)
sc_pchiron Num 1, 3, 5 Score for percentage Chironomidae
sc_pcling Num 1, 3, 5 Score for percentage clingers
sc_ptany Num 1, 3, 5 Score for percentage Tanytarsini
sc_pscrape Num 1, 3, 5 Score for percentage scrapers
sc_pswim Num 1, 3, 5 Score for percentage swimmers
sc_pdipt Num 1, 3, 5 Score for percentage Diptera 4.9.1 TAXONOMIC RICHNESS (ntaxa, nept, nephem) Taxonomic richness metrics are counts of the distinct number of taxa within selected taxonomic groups. Total taxa (ntaxa), EPT taxa (nept), and Ephemeroptera (nephem) are broadly used metrics that provide information on the overall taxonomic diversity. 4.9.2 TAXONOMIC COMPOSITION (pephem, pchiron, ptany, pdipt) These metrics are based on the proportion of individuals in a sample belonging to a specified taxonomic group relative to all individuals. Specifically, these metrics describe the percentage of Ephemeroptera (pephem), Chironomidae (pchiron), Tanytarsini (ptany), and Diptera (pdipt). 4.9.3 TOLERANCE/INTOLERANCE (pintol_urb) The tolerance of a taxon is based on its ability to survive short- and long-term exposure to physiochemical stressors that result from chemical pollution, hydrologic alteration, or habitat degradation. Tolerance values range from 0 to 10. Taxa with the greatest sensitivity (least tolerance) to stressors have tolerance values of 0, and taxa with the least sensitivity (most tolerance) have tolerance values of 10. Criteria for determining tolerance values are described in Stribling et al. (1998) and Bressler et al (2004). 4.9.4 TROPHIC FEEDING HABITS (nscrape, pscrape)
19
These metrics are based on the dominant mode of feeding. Specifically, the number and percentage of taxa that feed by scraping are identified. Scrapers are those organisms that remove periphyton or other algal material and the associated microbes from substrates. 4.9.5 HABITAT (pclimb, pcling, pswim) These metrics describe the organisms’ dominant habitat, according to their locomotion or behavior in relation to their habitat. Climbers live on the surface of living plant material or organic detritus. Clingers have morphological or behavioral adaptations that allow them to avoid or withstand the hydraulic forces of stream riffles or other fast-flowing zones. Swimmers are adapted for locomotion in the open water column. 4.9.6 STRATUM (BIBIStrata) Calculation of the Benthic Index of Biotic Integrity requires knowledge of the physiographic stratum in which each site is located. The three strata are: Coastal, Eastern Piedmont (Epiedmont), and Highland. 4.9.7 FINAL BIBI SCORE (bibi_05) Final calculated Benthic Index of Biotic Integrity score. BIBI values range from 1 to 5. Site scores <3 are considered “Poor”, 3-4 are considered “Fair”, and scores >4 are considered “Good”. See Southerland et al. (2005) for a more detailed explanation of IBI development. 4.10 FishList Fish collected by electrofishing from sample sites
Table 17. Fish species variables available with MBSS data
Field Name Data Type
Round 1 Data Notes
Round 2 Data Notes
Round 3 Data Notes
Defined Value List Definition
SITEYR Char Site identification
FishTaxa Char See Appendix E Species name (common)
Total Num Total abundance 4.10.1 TAXONOMIC IDENTIFICATION (FishTaxa) Species names are given as common names, as listed in Appendix E 4.11 FIBI Fish Index of Biotic Integrity (FIBI) metrics and scores. Please note that the narratives in the “Definition” column refer to variables used to calculate FIBI metrics. See Southerland et al. 2005 for detailed descriptions of MBSS FIBI metrics.
Table 18. Fish metrics and FIBI scores for MBSS sites
Field Name Data Type
Round 1 Data Notes
Round 2 Data Notes
Round 3 Data Notes Defined Value List Definition
SITEYR Char Site identification
FIBISTRATA Char Coastal, Epiedmont, Highland, Cold Fish IBI strata
ACREAGE Num Catchment area (acres)
LOGACRES Num Log (base 10) of catchment area
LEN_SAMP Num Length of reach sampled (m)
STRMAREA Num
Stream area in square meters (calculated from length sampled times average stream width)
TOTCNT Num Total number of fish collected
ABUNSQM Num Fish abundance per square meter
SC_ABUNSQM Num 1, 3, 5 Score for abundance per square meter
20
ABDOM Num Abundance of dominant taxa
PABDOM Num 0-100 Percentage abundance of dominant taxa
SC_PABDOM Num 1, 3, 5 Score for percentage abundance of dominant taxa
TOTBIOM Num Total biomass (g)
BIOM_MSQ Num Biomass per square meter
SC_BIOM_MSQ Num 1, 3, 5 Score for biomass per square meter
NUMBENTSP Num Number of benthic species
NUMBENTSPA Num Number of benthic species adjusted for catchment area
SC_NUMBENTSPA Num 1, 3, 5
Score for number of benthic species adjusted for catchment area
NUMBROOK Num Number of brook trout
PBROOK Num 0-100 Percentage brook trout
SC_PCBROOK Num 1, 3, 5 Score for percentage brook trout
NUMGEOMIV Num
Number of generalist, omnivorous, and insectivorous species
PGEOMIV Num 0-100
Percentage generalist, omnivorous, and insectivorous species
SC_PGEOMIV Num 1, 3, 5
Score for percentage number of generalist, omnivorous, and insectivorous species
NUMIS Num Number of insectivores
P_IS Num 0-100 Percentage insectivores
SC_P_IS Num 1, 3, 5 Score for percentage number of insectivores
NUMLITH Num Number lithophilic spawners
P_LITH Num 0-100 Percentage lithophilic spawners
SC_P_LITH Num 1, 3, 5 Score for percentage lithophilic spawners
NUMROUND Num Number of round-bodied suckers
PROUND Num 0-100 Percentage of round-bodied suckers
SC_PROUND Num 1, 3, 5 Score for percentage of round-bodied suckers
NUMSCULP Num Number of sculpins
PSCULP Num 0-100 Percentage sculpins
SC_PSCULP Num 1, 3, 5 Score for percentage sculpins
NUMTOL Num Number of tolerant individuals
PTOL Num 0-100 Percentage tolerant individuals
SC_PTOL Num 1, 3, 5 Score for percentage tolerant individuals
FIBI_05 Num 1-5 Final calculated fish index of biotic integrity (2005)
4.11.1 FISH ABUNDANCE AND CONDITION (ABUNSQM, BIOM_MSQ) Two fish abundance metrics were used in calculating the Fish Index of Biotic Integrity: abundance per square meter of stream sampled and biomass per square meter of stream sampled. 4.11.2 SPECIES RICHNESS AND COMPOSITION (NUMBENTSP, NUMBENTSPA, PROUND, PBROOK, PSCULP) Several measures of species richness and composition re provided, including the number of benthic species (both unadjusted and adjusted for catchment area), percentage or round-bodied suckers, percentage of brook trout, and percentage sculpins.
21
4.11.3 INDICATOR SPECIES (PABDOM, PTOL) Two metrics indicating the presence of indicator species (i.e., species that are particularly tolerant or intolerant of short- and long-term exposure to physiochemical stressors that result from chemical pollution, hydrologic alteration, or habitat degradation) are presented: percentage of dominant taxa and percentage of tolerant taxa. 4.11.4 TROPHIC COMPOSITION (PGEOMIV, P_IS) Trophic composition metrics are based on the dominant feeding mode exhibited by the observed taxa. Generalists and omnivores are less sensitive to environmental stresses because they can more easily vary their diets. Insectivores have a more specialized diet, and may show lower tolerance to stressors. The percentage of generalist, omnivorous, and insectivorous species and the percentage of insectivores are presented. 4.11.5 REPRODUCTIVE FUNCTION (P_LITH) The percentage of lithophilic spawners refers to the percentage of individual fish that spawn in gravel. These fish are sensitive to siltation, which results from development and excessive erosion. 4.11.6 NORMALIZING VARIABLES (TOTCNT, STRMAREA, ACREAGE, LOGACRES) Several variables are required to calculate some of the metrics presented above. Total count of fish (TOTCNT) is required to estimate abundances; stream area (STRMAREA) is used to calculate abundance per square meter and biomass per square meter; and catchment area (ACREAGE) is used to adjust the number of benthic species for catchment area. 4.11.7 STRATUM (FIBISTRATA) Calculation of the Fish Index of Biotic Integrity requires knowledge of the physiographic stratum in which each site is located. The four strata are: Coastal, Eastern Piedmont (Epiedmont), Highland, and Cold. 4.11.8 FINAL FIBI SCORE (FIBI_05) Final calculated Fish Index of Biotic Integrity score. FIBI values range from 1 to 5. Site scores <3 are considered “Poor”, 3-4 are considered “Fair”, and scores >4 are considered “Good”. See Southerland et al. (2005) for a more detailed explanation of IBI development. 4.12 ExoticPlants Exotic plants observed in or near sample sites
Table 19. Exotic plant variables available with MBSS data
Field Name Data Type
Round 1 Data Notes
Round 2 Data Notes
Round 3 Data Notes
Defined Value List Definition
SITEYR Char n/a Site identification
PlantTaxa Char n/a See Appendix B Species name (common)
Abundvalue Char n/a P – Present E – Extensive Relative abundance
4.12.1 TAXONOMIC IDENTIFICATION (PlantTaxa) Species names are given as common names, as listed in Appendix B. 4.13 HerpList Amphibians and reptiles observed near sample sites
Table 20. Herpetofauna variables available with MBSS data
Field Name Data Type
Round 1 Data Notes
Round 2 Data Notes
Round 3 Data Notes
Defined Value List Definition
SITEYR Char Site identification
HerpTaxa Char See Appendix D Species name (common)
HerpAdultObs Char n/a n/a Y, N Adult herpetofauna observed
HerpJuvObs Char n/a n/a Y, N Juvenile herpetofauna observed
22
HerpLarvaObs Char n/a n/a Y, N Larval herpetofauna observed
HerpEggObs Char n/a n/a Y, N Herpetofauna eggs observed
HerpSeen Char Y, N Herpetofauna visually observed
HerpHeard Char Y, N Herpetofauna heard
HerpRetained Char Y, N Herpetofauna retained
NumHerpRetained Num Number of herpetofauna retained
HerpSeason Char
Spring, summer, vernal pool, stream salamander
Season when herpetofauna was observed
HerpComment Char Herpetofauna comments 4.13.1 TAXONOMIC IDENTIFICATION (HerpTaxa) Species names are given as common names, as listed in Appendix D. 4.13.2 HERPETOFAUNA OBSERVATIONS For Round 3 herpetofauna data, the life stage of the individual was recorded as either adult, juvenile, larval, or egg. The observations were indicated with “Y” or “N”. 4.14 Crayfish Crayfish observed near sample sites
Table 21. Crayfish variables available with MBSS data
Field Name Data Type
Round 1 Data Notes
Round 2 Data Notes
Round 3 Data Notes
Defined Value List Definition
SITEYR Char Site identification
OLDSITE Char Name of old site
STREAM Char Stream name
SITE Char Brief site description
YEAR Num Year sampled
NORTHING Num Maryland plane coordinate (NAD83)
EASTING Num Maryland plane coordinate (NAD83)
COLLECTOR Char Name of collector
PROJECT Char Name of crayfish project
CRAYFISH_TAXA Char See Appendix C Species name (scientific) 4.14.1 TAXONOMIC IDENTIFICATION (CRAYFISH_TAXA) Species names are given as scientific names, as listed in Appendix C. 4.15 CrayfishAbundance Crayfish abundance values from sample site reaches
Table 22. Crayfish abundance variables available with MBSS data
Field Name Data Type
Round 1 Data Notes
Round 2 Data Notes
Round 3 Data Notes
Defined Value List Definition
SITEYR Char n/a n/a Site identification
Year Num n/a n/a Year sampled
CrayfishTaxa Char n/a n/a See Appendix C Species name (scientific)
NumPass1 Num n/a n/a Number crayfish collected from first electrofishing pass
NumPass2 Num n/a n/a Number of crayfish collected from second electrofishing pass
23
NUM_TOTAL Num n/a n/a Total number of crayfish collected by electrofishing
CrayfishRetained Num n/a n/a Number of crayfish retained 4.15.1 TAXONOMIC IDENTIFICATION (CrayfishTaxa) Species names are given as scientific names, as listed in Appendix C. 4.16 StreamSalamanders Abundance values for stream salamanders collected from sample sites
Table 23. Stream salamander variables available with MBSS data
Field Name Data Type
Round 1 Data Notes
Round 2 Data Notes
Round 3 Data Notes
Defined Value List Definition
SITEYR Char n/a n/a Site identification
YEAR Num n/a n/a Year sampled
HerpTaxa Char n/a n/a See Appendix D Species name (common)
Lifestage Char n/a n/a A - Adult L - Larval Lifestage
ElectrofishingCatch Num n/a n/a
Number of salamanders collected during stream electrofishing
GeneralCatch Num n/a n/a
Number of salamanders collected from general search of area
TransectCatch Num n/a n/a
Number of salamanders collected from downstream 25 m transect
NumRetained Num n/a n/a Number of salamanders retained
4.16.1 TAXONIMIC IDENTIFICATION (HerpTaxa) Species names are given as common names, as listed in Appendix D. 4.16.2 STAGE OF LIFE (Lifestage) Life stage of salamanders collected, adult (A) or larval (L). 4.16.3 METHOD OF COLLECTION (ElectrofishingCatch, GeneralCatch, TransectCatch) Number of salamanders collected from stream electrofishing, general search, and downstream 25m transect search. 4.17 MusselList Freshwater mussels observed in sample site reaches
Table 24. Mussel variables available with MBSS data
Field Name Data Type
Round 1 Data Notes
Round 2 Data Notes
Round 3 Data Notes
Defined Value List Definition
SITEYR Char Site identification
MusselTaxa Char See Appendix A Species name (scientific)
Observation Char Y, N Mussels observed at the site
Condition Char L – Living D – Dead
Condition of mussels collected from site
MusselsRetained Char Mussels retained from the site
24
25
4.17.1 TAXONOMIC IDENTIFICATION (MusselTaxa) Species names are given as scientific names, as listed in Appendix A 4.17.2 MUSSEL CONDITION (Condition) Condition of mussels collected from sample reaches, living (L) or dead (D).
5 LITERATURE CITED
Boward, D. and E. Friedman. 2000. Maryland biological stream survey laboratory methods for benthic macroinvertebrate laboratory processing and taxonomy. Maryland Department of Natural Resources, Monitoring and Non-Tidal Assessment Division.
Buchanan, T.J., and Somers, W.P., 1969, Discharge measurements at gaging stations: U.S. Geological Survey Techniques of Water-Resources Investigations, book 3, chap. A8, 65 p. Paul, M.J., J.B. Stribling, R.J. Klauda, P.F. Kazyak, M.T. Southerland, and N.E. Roth. 2002. A physical habitat index for freshwater wadeable streams in Maryland. Maryland Department of Natural Resources, Monitoring and Non-Tidal Assessment Division. Roth, N., J. Volstad, L. Erb, E. Weber, P. Kazyak, S. Stranko, and D. Boward. 2005. Maryland Biological Stream Survey 2000-2004 Volume 6: Laboratory, field, and analytical methods. Prepared for the Maryland Department of Natural Resources Southerland, M.T., G.M. Rogers, M.J. Kline, R.P. Morgan, D.M. Boward, P.F. Kazyak, R.J. Klauda, and S.A. Stranko. 2005. New biological indicators to better assess the condition of Maryland streams. Maryland Department of Natural Resources, Monitoring and Non-Tidal Assessment Division. Strahler, A.N. 1957. Quantitative analysis of watershed geomorphology. Transactions of the American Geophysical Union 38: 913-920. Stranko, S.A., D. Boward, J. Kilian, C. Millard, A. Becker, R. Gauza, A. Schenk, A. Roseberry-Lincoln, and M. O’Connor. 2007. Sampling manual: field protocols. Maryland Department of Natural Resources, Monitoring and Non-Tidal Assessment Division.