1 Introduction to Optical Spectroscopy Bene docet, qui bene distinguit (Horace) Good choices means good teaching 1.1 Overview The term Optical Spectroscopy (OS) in this book covers all types of qualitative and quantitative analytical methods that are based on the interaction of light with living and non-living matter. Here the term “light” includes electromagnetic radiation covering the spectral range from the far-ultraviolet (UV), followed by visible light (VIS) up to the near- infrared region (NIR). For more than 200 years optical spectroscopy has been uti- lized in various fields of science, industry and medicine, particularly in (bio-) chemistry, biology, physics and astronomy. OS is highly specific, each substance is discernible from all others by its spectral properties. Samples can be qualita- tively and quantitatively analyzed. In contrast to other spectroscopic methods such as NMR (nuclear magnetic resonance), ESR (electron spin resonance), MȰßbauer or mass spectroscopy, the requirements of the samples to be analyzed are not particularly restrictive. Measurements of various optical parameters as a function of wavelength/energy (“spectrum”) or time (“kinetics”) provide valuable insights that are not, or not readily, attainable by other analytical methods. Optical spectral analysis is a well developed method. However, there is still a rapidly growing market for spectrophotometers and in addition to routine ana- lyses many novel applications are being continuously reported. Depending on their required specifications, spectrophotometers differ markedly in size, form and usability and, last but not least, in price. They can be specifically adapted to the envisaged purpose. Therefore, the current trend is to use highly specific, moderately priced spectrophotometers rather than installing and using the most expensive “all-purpose machines” that have the best specifications available for more diverse applications. Optical Spectroscopy in Chemistry and Life Sciences. W. Schmidt Copyright c 2005 WILEY-VCH Verlag GmbH & Co. KGaA, Weinheim ISBN 3-527-29911-4
Transcript
1Introduction to Optical Spectroscopy
Bene docet, qui bene distinguit(Horace)
Good choices means good teaching
1.1Overview
The term Optical Spectroscopy (OS) in this book covers all types of qualitative andquantitative analytical methods that are based on the interaction of light withliving and non-living matter.Here the term “light” includes electromagnetic radiation covering the spectral
range from the far-ultraviolet (UV), followed by visible light (VIS) up to the near-infrared region (NIR). For more than 200 years optical spectroscopy has been uti-lized in various fields of science, industry and medicine, particularly in (bio-)chemistry, biology, physics and astronomy. OS is highly specific, each substanceis discernible from all others by its spectral properties. Samples can be qualita-tively and quantitatively analyzed. In contrast to other spectroscopic methodssuch as NMR (nuclear magnetic resonance), ESR (electron spin resonance),M�ßbauer or mass spectroscopy, the requirements of the samples to be analyzedare not particularly restrictive. Measurements of various optical parameters as afunction of wavelength/energy (“spectrum”) or time (“kinetics”) provide valuableinsights that are not, or not readily, attainable by other analytical methods.Optical spectral analysis is a well developed method. However, there is still a
rapidly growing market for spectrophotometers and in addition to routine ana-lyses many novel applications are being continuously reported. Depending ontheir required specifications, spectrophotometers differ markedly in size, formand usability and, last but not least, in price. They can be specifically adaptedto the envisaged purpose. Therefore, the current trend is to use highly specific,moderately priced spectrophotometers rather than installing and using themost expensive “all-purpose machines” that have the best specifications availablefor more diverse applications.
Optical Spectroscopy in Chemistry and Life Sciences. W. SchmidtCopyright c 2005 WILEY-VCH Verlag GmbH & Co. KGaA, WeinheimISBN 3-527-29911-4
The specifications of modern optical spectrophotometers are now approachingthe limits set by physics; the advantages compared with other analytical methodsare many, as follows.x OS is not destructive or invasive.x Remote measurements are feasible, i. e., measurements rangingfrom distances of a few millimeters up to long distances, such asfrom airplanes or satellites, without any physical contact with thesample. Hazardous or unattainable objects are easily analyzed.
x In principle liquid samples as well as solids and gases areacceptable, independent of their “optical quality”. Transparentsamples as well as highly light scattering, turbid and opaquesamples are measurable.
x The photometric as well as kinetic time scales covered are extra-ordinarily wide and are unmatched by other analytical methods.
x OS (for example, femtosecond laser spectroscopy) allows mea-surements of extremely fast reactions down to a femtosecondtime scale (10–15 s).
x Minute samples in the micrometer range (microspectroscopy) orvery rare events can be investigated using single photon counting(measurement of a few photons per second).
x Extremely low concentrations down to 10–18 moles are detectableby luminescence methods.
x Radioactive markers for the investigation of biochemical andmolecular-biological processes are increasingly being replaced bycheaper and easy to use luminescence markers and low costluminescence spectrometers.
In this book we will discuss the essential features of optical spectroscopy withminimum descriptions of complex theories, various spectrophotometric proce-dures and apparatus. This is not an easy task in light of the significant progressthat has been made in optoelectronics, laser and microcomputer techniques inrecent years. However, the book is not intended to be a “how to use” manualfor a specific spectrophotometer. For this purpose the reader should consult themanufacturer’s manual. In addition, spectrophotometer manufacturers offerpractical and theoretical introductory seminars; however, they are often ratherexpensive, time consuming and only focus on their own products.After a short journey through the history of optical spectroscopy in the current
chapter, Chapter 2 offers a short orientation and introduction to quantum theore-tical concepts that are a prerequisite to the understanding of the spectroscopicproperties of matter. Starting with the hydrogen atom as the simplest quantummechanical system we then focus on the spectroscopic properties of small,diatomic molecules and finally turn our attention to complex (bio-)molecules.Optical spectroscopy is intimately connected to optical physics. Thus, in Chap-
ter 3 we will establish the necessary fundamental knowledge and becomeacquainted with the diverse optical elements: starting with the radiometric and
2 1 Introduction to Optical Spectroscopy
photometric definition of light units, the basics of geometric, wave and particleoptics, and finally the generation of light and its measurement will be described.We will discuss the properties of optical components such as filters, mirrors,lenses, optical fibers, integrating spheres as well as methods for dispersinglight by prisms, gratings and interferometers.In the fourth chapter we will utilize the theoretical and practical knowledge
obtained from the first three chapters to describe atomic absorption (AAS) andatomic emission spectrometry (AES) as two variants of atomic spectroscopy fortheoretical and practical discussions.In the fifth chapter we will discuss in more detail the theoretical and practical
aspects of molecular absorption spectroscopy, the most widely utilized analyticaltool in various fields. We will discuss different versions of absorption spectropho-tometers and also focus on diverse methods of spectral evaluation in order to ex-tract “hidden” information from spectra that may not be immediately apparent atfirst glance.The sixth chapter deals with luminescence spectroscopy. While absorption or
extinction is the only measured parameter to be determined in absorption spec-troscopy, luminescence spectroscopy provides a number of measurable para-meters for the molecular system of interest.Photoacoustic spectroscopy (PAS), where heat emission rather than light is
detected, will be discussed in the seventh chapter. Supplementing absorptionand luminescence spectroscopy, PAS allows conclusions to be drawn about ther-modynamic relationships, particularly of complex molecular systems in biology,chemistry and medicine. Moreover, it allows spectral scans to be made of non-visi-ble, subsurface layers of sample materials such as skin or fruit shells.Measuring methods and phenomena that depend on various scattering effects
such as Rayleigh, Mie, Fraunhofer or Raman scattering, including the relatedreflection and ATR spectroscopy (attenuated total reflection), will be discussed inthe eighth chapter.Because of the importance of the chiral and stereochemical properties of biomo-
lecules, we introduce ORD (optical rotational dispersion) and CD (circular dichroism)spectroscopy in the ninth chapter, even though both methods are derivatives ofabsorption spectroscopy and are related to Chapters 5 and 8. Finally, ellipsometryutilizes the phase shift from the surface reflection of polarized light, an effect thatis applicable for the highly sensitive analysis of biologically relevant molecules.With the availability of low cost, fast, on-line microcomputers with large mem-
ories, near-infrared spectroscopy (NIR) has experienced an unprecedented boomin recent years, particularly in routine industrial analysis. NIR spectroscopy hasbecome indispensable in the pharmaceutical industry, medicine and the food in-dustry, and in petrochemical, geological and environmental analysis. Further tech-nical developments in these areas are anticipated, also extending into other appli-cation areas of industrial research. Therefore, this topic is treated in Chapter 10.The most important physical constants as used in this book can be found in the
Appendix. The Periodic Table of the elements, including detailed electron distri-butions, may serve as a quick overview. Another table allows the easy conversion
31.1 Overview
4 1 Introduction to Optical Spectroscopy
Figu
re1.1
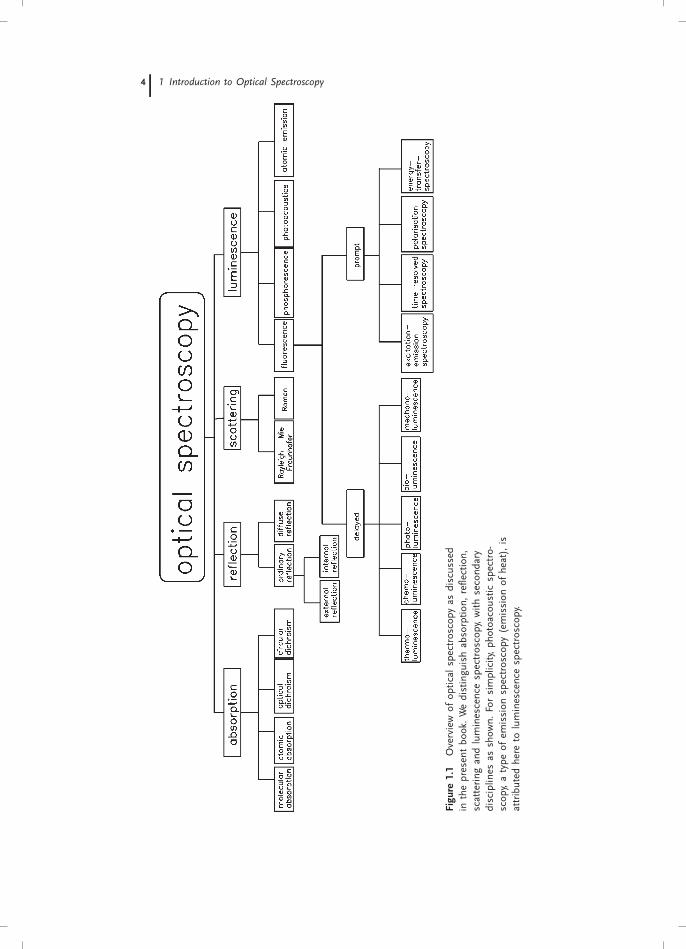
Overview
ofop
ticalspectroscopy
asdiscussed
inthepresen
tbo
ok.Wedistingu
ishab
sorptio
n,reflection,
scattering
andluminescencespectroscopy,withsecond
ary
disciplin
esas
show
n.Forsimplicity,ph
otoa
cousticspectro-
scop
y,atype
ofem
ission
spectroscopy
(emission
ofheat),is
attributed
here
toluminescencespectroscopy.
of various units of energy. As an “interface” between the reader and variousmanufacturers and distributors of optical spectrophotometers and componentsof all types, important addresses including email and URL addresses are listed.Supplementary literature is given at the end of each chapter. Figure 1.1 depictsthe whole field of optical spectroscopy as discussed in the present book.
1.2History of Optical Spectroscopy
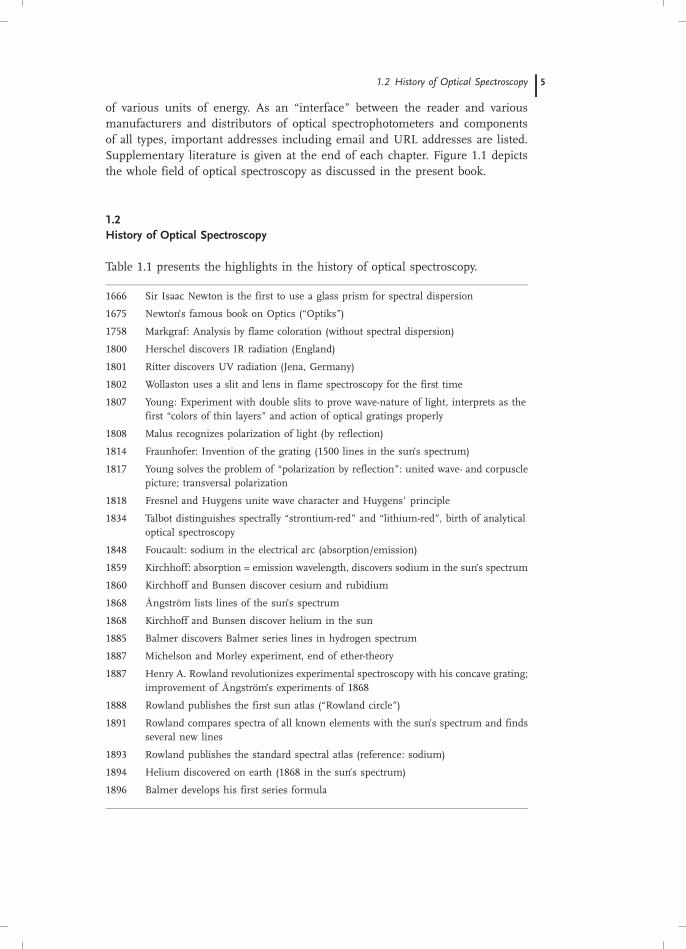
Table 1.1 presents the highlights in the history of optical spectroscopy.
51.2 History of Optical Spectroscopy
1666 Sir Isaac Newton is the first to use a glass prism for spectral dispersion
1675 Newton’s famous book on Optics (“Optiks”)
1758 Markgraf: Analysis by flame coloration (without spectral dispersion)
1802 Wollaston uses a slit and lens in flame spectroscopy for the first time
1807 Young: Experiment with double slits to prove wave-nature of light, interprets as thefirst “colors of thin layers” and action of optical gratings properly
1808 Malus recognizes polarization of light (by reflection)
1814 Fraunhofer: Invention of the grating (1500 lines in the sun’s spectrum)
1817 Young solves the problem of “polarization by reflection”: united wave- and corpusclepicture; transversal polarization
1818 Fresnel and Huygens unite wave character and Huygensl principle
1834 Talbot distinguishes spectrally “strontium-red” and “lithium-red”, birth of analyticaloptical spectroscopy
1848 Foucault: sodium in the electrical arc (absorption/emission)
1859 Kirchhoff: absorption = emission wavelength, discovers sodium in the sun’s spectrum
1860 Kirchhoff and Bunsen discover cesium and rubidium
1868 �Angstr�m lists lines of the sun’s spectrum
1868 Kirchhoff and Bunsen discover helium in the sun
1885 Balmer discovers Balmer series lines in hydrogen spectrum
1887 Michelson and Morley experiment, end of ether-theory
1887 Henry A. Rowland revolutionizes experimental spectroscopy with his concave grating;improvement of �Angstr�m’s experiments of 1868
1888 Rowland publishes the first sun atlas (“Rowland circle”)
1891 Rowland compares spectra of all known elements with the sun’s spectrum and findsseveral new lines
1893 Rowland publishes the standard spectral atlas (reference: sodium)
1894 Helium discovered on earth (1868 in the sun’s spectrum)
1896 Balmer develops his first series formula
6 1 Introduction to Optical Spectroscopy
1897 Thompson discovers the electron
1897 Rubens succeeds with the first isolation of an infrared band utilizing multiplereflections at metal layers
1911 Rutherford discovers the atomic nucleus
1920 H. v. Halban: first determination of concentration of molecules utilizing “light electricapparati”
1925 G. Scheibe, W. Gerlach and E. Schweitzer: first real quantitative spectral analysis
1926 G. Hansen builds the first recording double beam spectrophotometer following theplans of P. P. Koch (1912)
1941 The famous prism photometer, Model DU, from Zeiss comes to the market; for thefirst time this spectrophotometer covers the UV range, resolution 1 nm, measuredvalues are read from a scale with a needle pointer
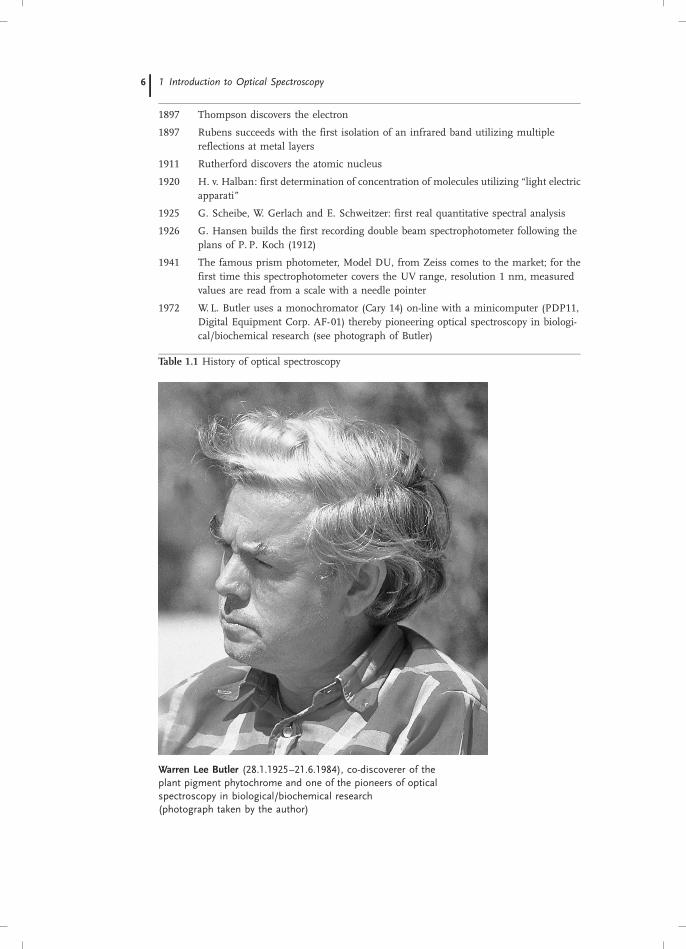
1972 W. L. Butler uses a monochromator (Cary 14) on-line with a minicomputer (PDP11,Digital Equipment Corp. AF-01) thereby pioneering optical spectroscopy in biologi-cal/biochemical research (see photograph of Butler)
Table 1.1 History of optical spectroscopy
Warren Lee Butler (28.1.1925–21.6.1984), co-discoverer of theplant pigment phytochrome and one of the pioneers of opticalspectroscopy in biological/biochemical research(photograph taken by the author)
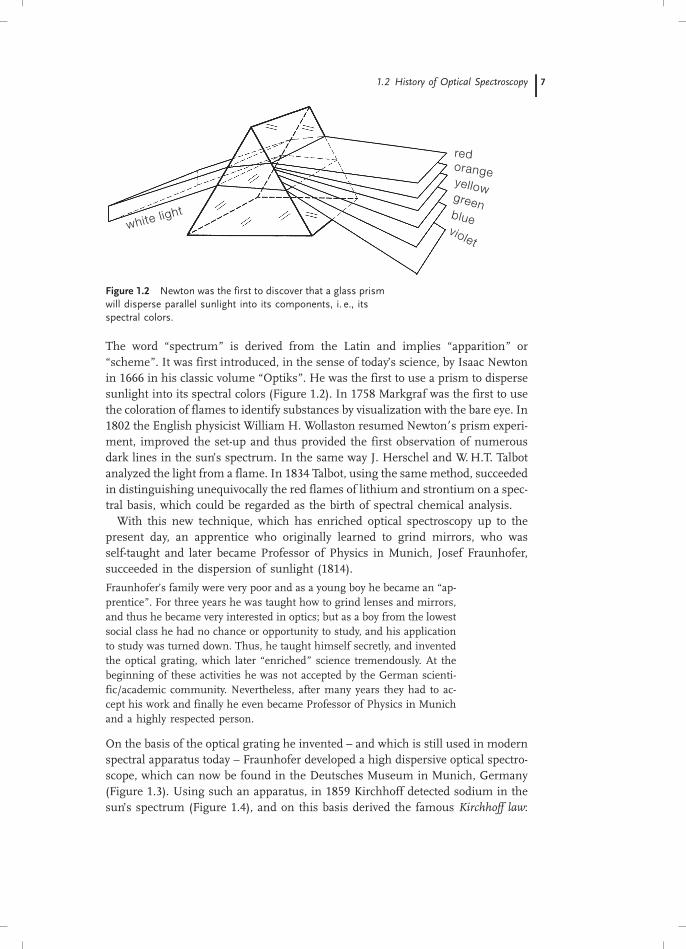
The word “spectrum” is derived from the Latin and implies “apparition” or“scheme”. It was first introduced, in the sense of today’s science, by Isaac Newtonin 1666 in his classic volume “Optiks”. He was the first to use a prism to dispersesunlight into its spectral colors (Figure 1.2). In 1758 Markgraf was the first to usethe coloration of flames to identify substances by visualization with the bare eye. In1802 the English physicist William H. Wollaston resumed Newtonls prism experi-ment, improved the set-up and thus provided the first observation of numerousdark lines in the sun’s spectrum. In the same way J. Herschel and W.H.T. Talbotanalyzed the light from a flame. In 1834 Talbot, using the same method, succeededin distinguishing unequivocally the red flames of lithium and strontium on a spec-tral basis, which could be regarded as the birth of spectral chemical analysis.With this new technique, which has enriched optical spectroscopy up to the
present day, an apprentice who originally learned to grind mirrors, who wasself-taught and later became Professor of Physics in Munich, Josef Fraunhofer,succeeded in the dispersion of sunlight (1814).
Fraunhofer’s family were very poor and as a young boy he became an “ap-prentice”. For three years he was taught how to grind lenses and mirrors,and thus he became very interested in optics; but as a boy from the lowestsocial class he had no chance or opportunity to study, and his applicationto study was turned down. Thus, he taught himself secretly, and inventedthe optical grating, which later “enriched” science tremendously. At thebeginning of these activities he was not accepted by the German scienti-fic/academic community. Nevertheless, after many years they had to ac-cept his work and finally he even became Professor of Physics in Munichand a highly respected person.
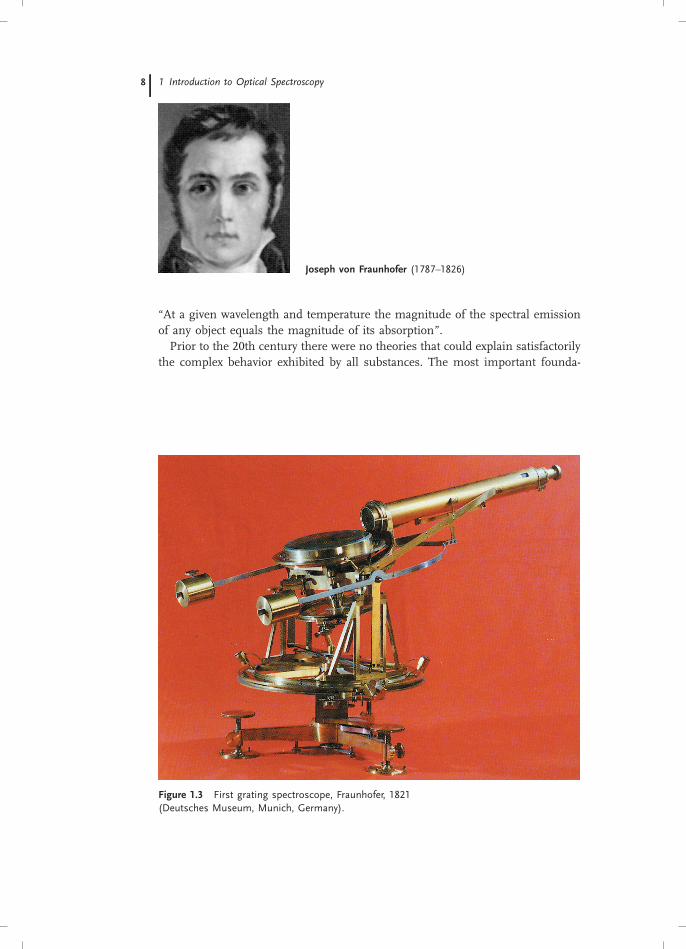
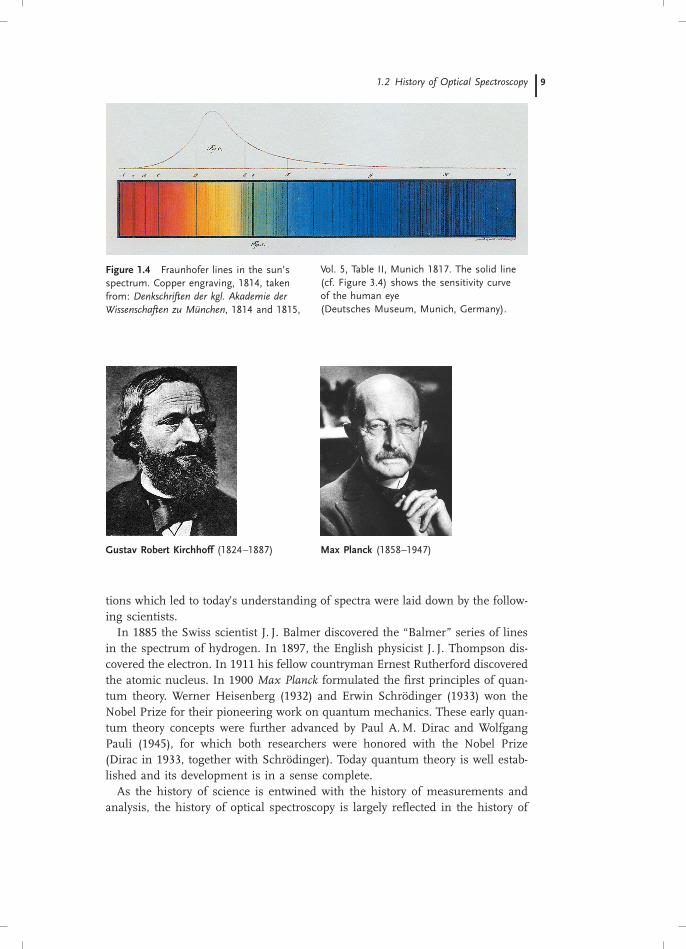
On the basis of the optical grating he invented – and which is still used in modernspectral apparatus today – Fraunhofer developed a high dispersive optical spectro-scope, which can now be found in the Deutsches Museum in Munich, Germany(Figure 1.3). Using such an apparatus, in 1859 Kirchhoff detected sodium in thesun’s spectrum (Figure 1.4), and on this basis derived the famous Kirchhoff law:
71.2 History of Optical Spectroscopy
white light
redorangeyellowgreenblueviolet
Figure 1.2 Newton was the first to discover that a glass prismwill disperse parallel sunlight into its components, i. e., itsspectral colors.
“At a given wavelength and temperature the magnitude of the spectral emissionof any object equals the magnitude of its absorption”.Prior to the 20th century there were no theories that could explain satisfactorily
the complex behavior exhibited by all substances. The most important founda-
8 1 Introduction to Optical Spectroscopy
Figure 1.3 First grating spectroscope, Fraunhofer, 1821(Deutsches Museum, Munich, Germany).
Joseph von Fraunhofer (1787–1826)
tions which led to today’s understanding of spectra were laid down by the follow-ing scientists.In 1885 the Swiss scientist J. J. Balmer discovered the “Balmer” series of lines
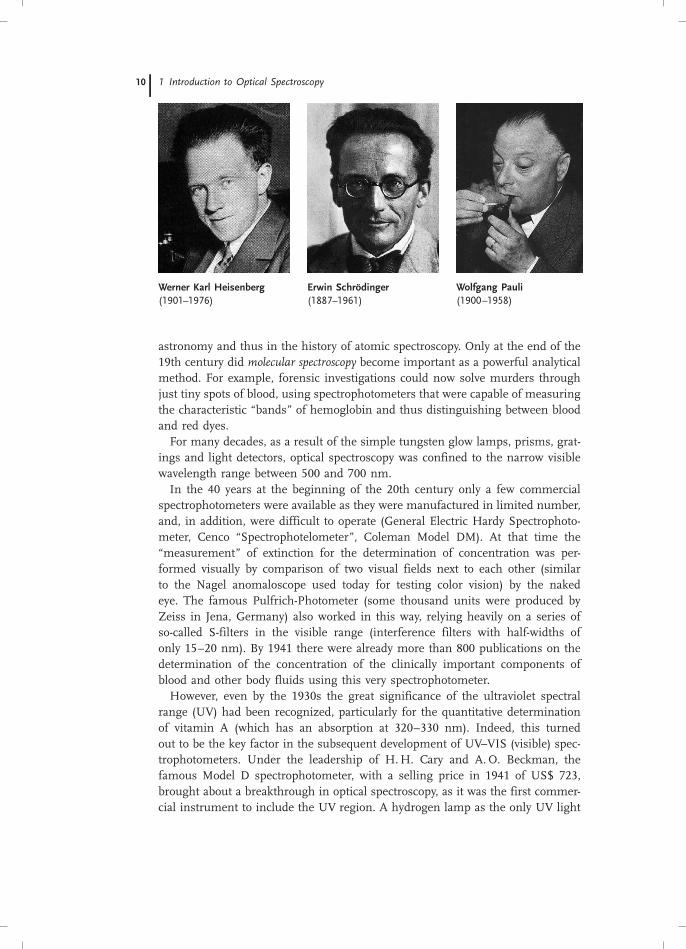
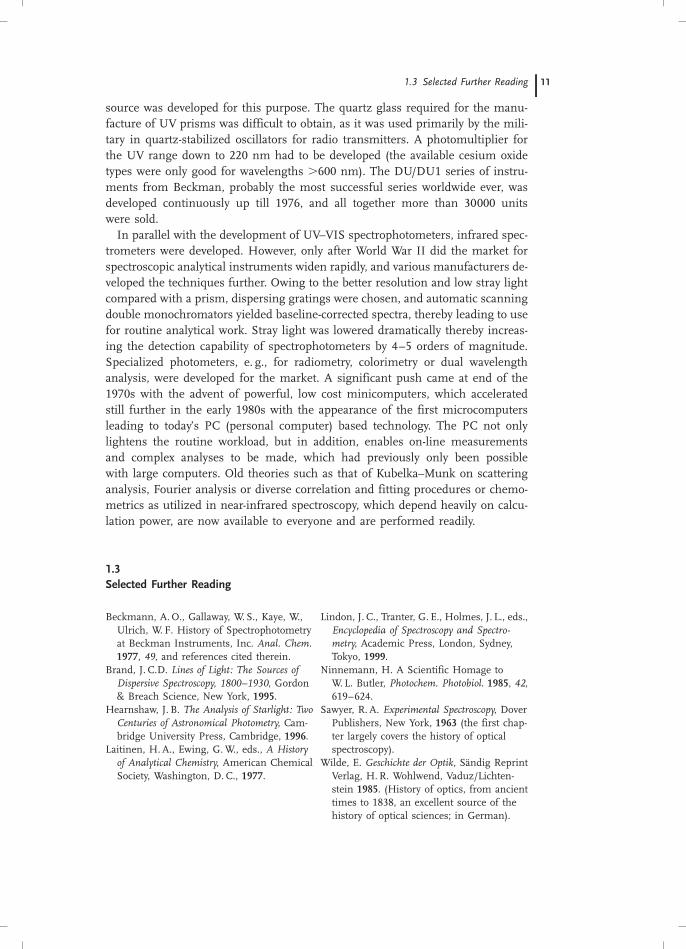
in the spectrum of hydrogen. In 1897, the English physicist J. J. Thompson dis-covered the electron. In 1911 his fellow countryman Ernest Rutherford discoveredthe atomic nucleus. In 1900 Max Planck formulated the first principles of quan-tum theory. Werner Heisenberg (1932) and Erwin Schr�dinger (1933) won theNobel Prize for their pioneering work on quantum mechanics. These early quan-tum theory concepts were further advanced by Paul A.M. Dirac and WolfgangPauli (1945), for which both researchers were honored with the Nobel Prize(Dirac in 1933, together with Schr�dinger). Today quantum theory is well estab-lished and its development is in a sense complete.As the history of science is entwined with the history of measurements and
analysis, the history of optical spectroscopy is largely reflected in the history of
91.2 History of Optical Spectroscopy
Figure 1.4 Fraunhofer lines in the sun’sspectrum. Copper engraving, 1814, takenfrom: Denkschriften der kgl. Akademie derWissenschaften zu M�nchen, 1814 and 1815,
Vol. 5, Table II, Munich 1817. The solid line(cf. Figure 3.4) shows the sensitivity curveof the human eye(Deutsches Museum, Munich, Germany).
Gustav Robert Kirchhoff (1824–1887) Max Planck (1858–1947)
astronomy and thus in the history of atomic spectroscopy. Only at the end of the19th century did molecular spectroscopy become important as a powerful analyticalmethod. For example, forensic investigations could now solve murders throughjust tiny spots of blood, using spectrophotometers that were capable of measuringthe characteristic “bands” of hemoglobin and thus distinguishing between bloodand red dyes.For many decades, as a result of the simple tungsten glow lamps, prisms, grat-
ings and light detectors, optical spectroscopy was confined to the narrow visiblewavelength range between 500 and 700 nm.In the 40 years at the beginning of the 20th century only a few commercial
spectrophotometers were available as they were manufactured in limited number,and, in addition, were difficult to operate (General Electric Hardy Spectrophoto-meter, Cenco “Spectrophotelometer”, Coleman Model DM). At that time the“measurement” of extinction for the determination of concentration was per-formed visually by comparison of two visual fields next to each other (similarto the Nagel anomaloscope used today for testing color vision) by the nakedeye. The famous Pulfrich-Photometer (some thousand units were produced byZeiss in Jena, Germany) also worked in this way, relying heavily on a series ofso-called S-filters in the visible range (interference filters with half-widths ofonly 15–20 nm). By 1941 there were already more than 800 publications on thedetermination of the concentration of the clinically important components ofblood and other body fluids using this very spectrophotometer.However, even by the 1930s the great significance of the ultraviolet spectral
range (UV) had been recognized, particularly for the quantitative determinationof vitamin A (which has an absorption at 320–330 nm). Indeed, this turnedout to be the key factor in the subsequent development of UV–VIS (visible) spec-trophotometers. Under the leadership of H.H. Cary and A.O. Beckman, thefamous Model D spectrophotometer, with a selling price in 1941 of US$ 723,brought about a breakthrough in optical spectroscopy, as it was the first commer-cial instrument to include the UV region. A hydrogen lamp as the only UV light
10 1 Introduction to Optical Spectroscopy
Werner Karl Heisenberg(1901–1976)
Erwin Schr�dinger(1887–1961)
Wolfgang Pauli(1900–1958)
source was developed for this purpose. The quartz glass required for the manu-facture of UV prisms was difficult to obtain, as it was used primarily by the mili-tary in quartz-stabilized oscillators for radio transmitters. A photomultiplier forthe UV range down to 220 nm had to be developed (the available cesium oxidetypes were only good for wavelengths i600 nm). The DU/DU1 series of instru-ments from Beckman, probably the most successful series worldwide ever, wasdeveloped continuously up till 1976, and all together more than 30000 unitswere sold.In parallel with the development of UV–VIS spectrophotometers, infrared spec-
trometers were developed. However, only after World War II did the market forspectroscopic analytical instruments widen rapidly, and various manufacturers de-veloped the techniques further. Owing to the better resolution and low stray lightcompared with a prism, dispersing gratings were chosen, and automatic scanningdouble monochromators yielded baseline-corrected spectra, thereby leading to usefor routine analytical work. Stray light was lowered dramatically thereby increas-ing the detection capability of spectrophotometers by 4–5 orders of magnitude.Specialized photometers, e. g., for radiometry, colorimetry or dual wavelengthanalysis, were developed for the market. A significant push came at end of the1970s with the advent of powerful, low cost minicomputers, which acceleratedstill further in the early 1980s with the appearance of the first microcomputersleading to today’s PC (personal computer) based technology. The PC not onlylightens the routine workload, but in addition, enables on-line measurementsand complex analyses to be made, which had previously only been possiblewith large computers. Old theories such as that of Kubelka–Munk on scatteringanalysis, Fourier analysis or diverse correlation and fitting procedures or chemo-metrics as utilized in near-infrared spectroscopy, which depend heavily on calcu-lation power, are now available to everyone and are performed readily.
1.3Selected Further Reading
111.3 Selected Further Reading
Beckmann, A.O., Gallaway, W. S., Kaye, W.,Ulrich, W. F. History of Spectrophotometryat Beckman Instruments, Inc. Anal. Chem.1977, 49, and references cited therein.
Brand, J. C.D. Lines of Light: The Sources ofDispersive Spectroscopy, 1800–1930, Gordon& Breach Science, New York, 1995.
Hearnshaw, J. B. The Analysis of Starlight: TwoCenturies of Astronomical Photometry, Cam-bridge University Press, Cambridge, 1996.
Laitinen, H.A., Ewing, G.W., eds., A Historyof Analytical Chemistry, American ChemicalSociety, Washington, D. C., 1977.
Lindon, J. C., Tranter, G. E., Holmes, J. L., eds.,Encyclopedia of Spectroscopy and Spectro-metry, Academic Press, London, Sydney,Tokyo, 1999.
Ninnemann, H. A Scientific Homage toW. L. Butler, Photochem. Photobiol. 1985, 42,619–624.
Sawyer, R. A. Experimental Spectroscopy, DoverPublishers, New York, 1963 (the first chap-ter largely covers the history of opticalspectroscopy).
Wilde, E. Geschichte der Optik, S�ndig ReprintVerlag, H. R. Wohlwend, Vaduz/Lichten-stein 1985. (History of optics, from ancienttimes to 1838, an excellent source of thehistory of optical sciences; in German).