LUCRAREA NR.1 INTRODUCERE ÎN LabVIEW 1.Obiectivele lucrării : Însuşirea modului de utilizare a celor mai importante componente ale mediului de programare grafic LabVIEW. 2.Aparatura şi suporturile utilizate: a) PC în configuraţia unitate centrală,monitor, tastatură; b) Precizările din prezentul îndrumar; c) Manual de prezentare a mediului de programare grafic LabVIEW. 3.Breviar 3.1 INTRODUCTION LabVIEW (short for Laboratory Virtual Instrumentation Engineering Workbench) is a platform and development environment for a visual programming language from National Instruments. The graphical language is named "G". Originally released for the Apple Macintosh in 1986, LabVIEW is commonly used for data acquisition, instrument control, and industrial automation on a variety of platforms including Microsoft Windows, various flavors of UNIX, Linux, and Mac OS X. The latest version of LabVIEW is version LabVIEW 2009, released in August 2009. Visit National Instruments at www.ni.com. The code files have the extension “.vi”, which is an abbreviation for “Virtual Instrument”. 3.1.1 DATAFLOW PROGRAMMING The programming language used in LabVIEW, also referred to as G, is a dataflow programming language. Execution is determined by the structure of a graphical block diagram (the LV-source code) on which the programmer connects different function-nodes by drawing wires. These wires propagate variables and any node can execute as soon as all its input data become available. Since this might be the case for multiple nodes simultaneously, G is inherently capable of parallel execution. Multi-processing and multi-threading hardware is automatically exploited by the built-in scheduler, which multiplexes multiple OS threads over the nodes ready for execution. 1
Transcript
LUCRAREA NR.1
INTRODUCERE ÎN LabVIEW
1.Obiectivele lucrării :
Însuşirea modului de utilizare a celor mai importante componente ale mediului de programare grafic LabVIEW.
2.Aparatura şi suporturile utilizate:
a) PC în configuraţia unitate centrală,monitor, tastatură;b) Precizările din prezentul îndrumar;c) Manual de prezentare a mediului de programare grafic LabVIEW.
3.Breviar
3.1 INTRODUCTIONLabVIEW (short for Laboratory Virtual Instrumentation Engineering Workbench) is a platform and development environment for a visual programming language from National Instruments. The graphical language is named "G". Originally released for the Apple Macintosh in 1986, LabVIEW is commonly used for data acquisition, instrument control, and industrial automation on a variety of platforms including Microsoft Windows, various flavors of UNIX, Linux, and Mac OS X. The latest version of LabVIEW is version LabVIEW 2009, released in August 2009. Visit National Instruments at www.ni.com. The code files have the extension “.vi”, which is an abbreviation for “Virtual Instrument”.
3.1.1 DATAFLOW PROGRAMMING The programming language used in LabVIEW, also referred to as G, is a dataflow programming language. Execution is determined by the structure of a graphical block diagram (the LV-source code) on which the programmer connects different function-nodes by drawing wires. These wires propagate variables and any node can execute as soon as all its input data become available. Since this might be the case for multiple nodes simultaneously, G is inherently capable of parallel execution. Multi-processing and multi-threading hardware is automatically exploited by the built-in scheduler, which multiplexes multiple OS threads over the nodes ready for execution.
3.1.2 GRAPHICAL PROGRAMMING LabVIEW ties the creation of user interfaces (called front panels) into the development cycle. LabVIEW programs/subroutines are called virtual instruments (VIs). Each VI has three components: a block diagram, a front panel, and a connector panel. The last is used to represent the VI in the block diagrams of other, calling VIs. Controls and indicators on the front panel allow an operator to input data into or extract data from a running virtual instrument. However, the front panel can also serve as a programmatic interface. Thus a virtual instrument can either be run as a program, with the front panel serving as a user interface, or, when dropped as a node onto the block diagram, the front panel defines the inputs and outputs for the given node through the connector pane. This implies each VI can be easily tested before being embedded as a subroutine into a larger program.The graphical approach also allows non-programmers to build programs simply by dragging and dropping virtual representations of lab equipment with which they are already familiar. The LabVIEW programming environment, with the included examples and the documentation, makes it simple to create small applications. This is a benefit on one side, but there is also a
1
certain danger of underestimating the expertise needed for good quality "G" programming. For complex algorithms or large-scale code, it is important that the programmer possess an extensive knowledge of the special LabVIEW syntax and the topology of its memory management. The most advanced LabVIEW development systems offer the possibility of building stand-alone applications. Furthermore, it is possible to create distributed applications, which communicate by a client/server scheme, and are therefore easier to implement due to the inherently parallel nature of G-code.
3.1.3 BENEFITS One benefit of LabVIEW over other development environments is the extensive support for accessing instrumentation hardware. Drivers and abstraction layers for many different types of instruments and buses are included or are available for inclusion. These present themselves as graphical nodes. The abstraction layers offer standard software interfaces to communicate with hardware devices. The provided driver interfaces save program development time. The sales pitch of National Instruments is, therefore, that even people with limited coding experience can write programs and deploy test solutions in a reduced time frame when compared to more conventional or competing systems. A new hardware driver topology (DAQmxBase), which consists mainly of G-coded components with only a few register calls through NI Measurement Hardware DDK (Driver Development Kit) functions, provides platform independent hardware access to numerous data acquisition and instrumentation devices. The DAQmxBase driver is available for LabVIEW on Windows, Mac OS X and Linux platforms.
3.2 START USING LABVIEW
3.2.1 THE LABVIEW ENVIRONMENT LabVIEW programs are called Virtual Instruments, or VIs, because their appearance and operation imitate physical instruments, such as oscilloscopes and multimeters. LabVIEW contains a comprehensive set of tools for acquiring analyzing, displaying, and storing data, as well as tools to help you troubleshoot your code. When opening LabVIEW, you first come to the “Getting Started” window.
In order to create a new VI, select “Blank VI” or in order to create a new LabVIEW project, select “Empty project”.
2
When you open a blank VI, an untitled front panel window appears. This window displays the front panel and is one of the two LabVIEW windows you use to build a VI. The other window contains the block diagram. The sections below describe the front panel and the block diagram.
3.2.2 FRONT PANEL When you have created a new VI or selected an existing VI, the Front Panel and the Block Diagram for that specific VI will appear.
In LabVIEW, you build a user interface, or front panel, with controls and indicators. Controls are knobs, push buttons, dials, and other input devices. Indicators are graphs, LEDs, and other displays. You build the front panel with controls and indicators, which are the interactive input and output terminals of the VI, respectively. Controls are knobs, push buttons, dials, and other input devices. Indicators are graphs, LEDs, and other displays. Controls simulate instrument input devices and supply data to the block diagram of the VI. Indicators simulate instrument output devices and display data the block diagram acquires or generates. E.g., a “Numeric” can either be a “Numeric Control” or a “Numeric Indicator”, as seen below.
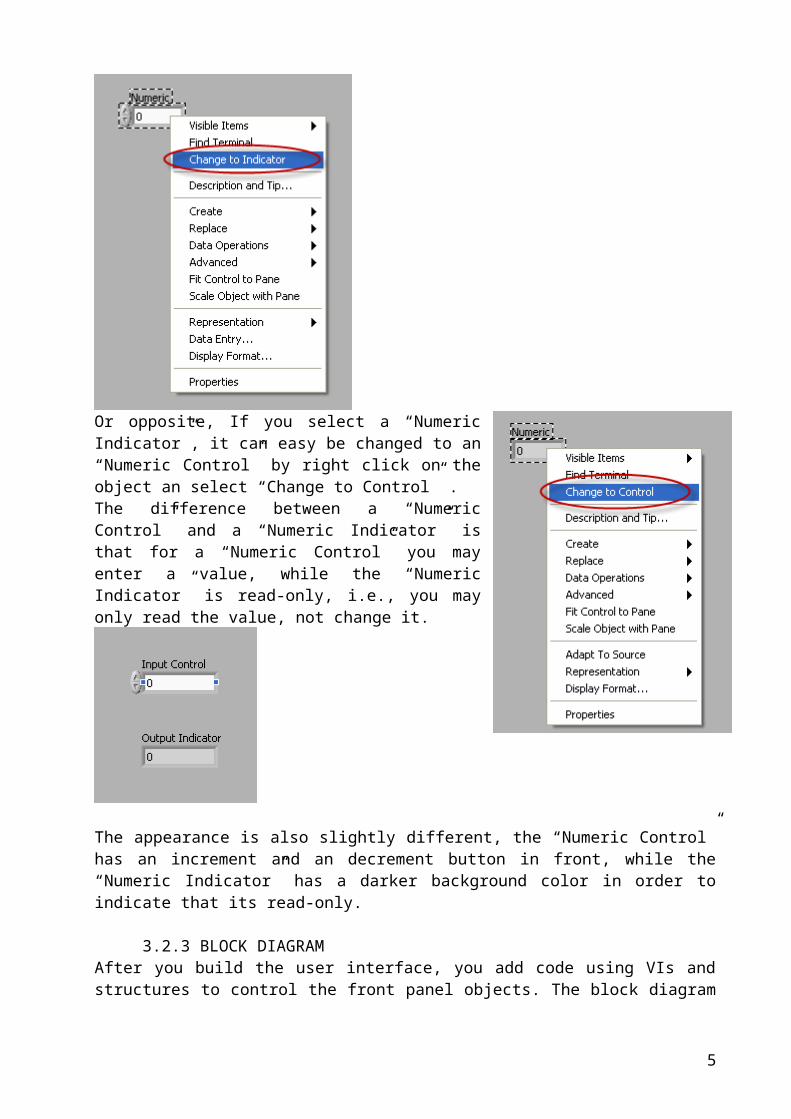
If you select a “Numeric Control”, it can easy be changed to an “Numeric Indicator” by right click on the object an select “Change to Indicator”.
3
Or opposite, If you select a “Numeric Indicator”, it can easy be changed to an “Numeric Control” by right click on the object an select “Change to Control” .The difference between a “Numeric Control” and a “Numeric Indicator” is that for a “Numeric Control” you may enter a value, while the “Numeric Indicator” is read-only, i.e., you may only read the value, not change it.
The appearance is also slightly different, the “Numeric Control” has an increment and an decrement button in front, while the “Numeric Indicator” has a darker background color in order to indicate that its read-only.
3.2.3 BLOCK DIAGRAM After you build the user interface, you add code using VIs and structures to control the front panel objects. The block diagram contains this code. In some ways, the block diagram resembles a flowchart.
4
After you build the front panel, you add code using graphical representations of functions to control the front panel objects. The block diagram contains this graphical source code. Front panel objects appear as terminals, on the block diagram. Block diagram objects include terminals, subVIs, functions, constants, structures, and wires, which transfer data among other block diagram objects. The Figure below shows a front panel and its corresponding block diagram with front panel and block diagram components.
5
The different components are as follows: 1. Toolbar 2. Owned Label 3. Numeric Control 4. Free Label 5. Numeric Control Terminal 6. Knob Terminal 7. Numeric Constant 8. Multiply Function
3.2.4 CONTROLS PALETTE The Controls and Functions palettes contain sub palettes of objects you can use to create a VI. When you click a sub palette icon, the entire palette changes to the sub palette you selected. To use an object on the palettes, click the object and place it on the front panel or block diagram. The Controls palette is available only on the front panel. The Controls palette contains the controls and indicators you use to build the front panel.
6
9. Icon 10. Knob Control 11. Plot Legend 12. XY Graph 13. Wire Data Path 14. XY Graph Terminal 15. Bundle Function 16. SubVI 17. For Loop Structure
3.2.4.1 NUMERIC SUB PALETTE “Numerical Control” and “Numerical Indicator” are the most used objects in the numeric sub palette.
3.2.4.2 BOOLEAN SUB PALETTE This palette has lots of different buttons you may use. OK, Cancel and Stop buttons are useful.
7
The most used Sub Palettes are the Numeric Sub Palette, the Boolean Sub Palette and the String & Path Sub Palette.You may change the appearance and the contents of the Controls palette:You may Pin the palette, so it is always visible, just click the little pin button in the upper left corner of the palette.If you want to change the content and appearance of the palette, click the “View” button. If you click “Change Visible Categories…” you may change which Categories you want to have visible.
3.2.4.3 STRING & PATH SUB PALETTEIn the String and Path palette we have String Controls, Combo Box, etc.
3.2.5 FUNCTION PALETTE The Functions palette is available only on the block diagram. The Functions palette contains the VIs and functions you use to build the block diagram.
8
3.2.6 TOOLS PALETTE You can create, modify, and debug VIs using the tools located on the floating Tools palette. The Tools palette is available on both the front panel and the block diagram. A tool is a special operating mode of the mouse cursor. The cursor corresponds to the icon of the tool selected in the Tools palette. Use the tools to operate and modify front panel and block diagram objects.
9
3.2.7 WIRING In order to create the logical flow between the object on the Block Diagram, you need to use the Wiring tool in order to connect the different objects together.
Use the Wiring tool to wire objects together on the block diagram.
3.2.8 TOOLBAR Below we see the LabVIEW Toolbar:
3.2.10 DATAFLOW PROGRAMMING LabVIEW follows a dataflow model for running VIs. A block diagram node executes when all its inputs are available. When a node completes execution, it supplies data to its output terminals and passes the output data to the next node in the dataflow path. Visual Basic, C++/C#, Java, and most other text-based programming languages follow a control flow model of program execution. In control flow, the sequential order of program elements determines the execution order of a program.
10
The Tools palette is available from the View menu:
3.2.9 THE OBJECTS SHORT-CUT MENU The most often-used menu is the object shortcut menu. All LabVIEW objects and empty space on the front panel and block diagram have associated shortcut menus. Use the shortcut menu items to change the look or behavior of front panel and block diagram objects. To access the shortcut menu, right-click the object, front panel, or block diagram. The Numeric control has the following short-cut/right-click menu:The Tools palette is available from the View menu.The short-cut menu will be different for the different controls or objects.
Example: Dataflow Programming
The Example shows a block diagram that adds two numbers and then subtracts 50.00 from the result of the addition. In this case, the block diagram executes from left to right, not because the objects are placed in that order, but because the Subtract function cannot execute until the Add function finishes executing and passes the data to the Subtract function. Remember that a node executes only when data are available at all of its input terminals, and it supplies data to its output terminals only when it finishes execution.Example: Dataflow Programming
In this example, consider which code segment would execute first-the Add, Random Number, or Divide function. You cannot know because inputs to the Add and Divide functions are available at the same time, and the Random Number function has no inputs. In a situation where one code segment must execute before another and no data dependency exists between the functions, use other programming methods, such as error clusters, to force the order of execution.
4. Mod de lucru
a) Se alimentează sistemul cu tensiune;b) Se lansează mediul LabVIEW;c) Se identifică principalele elemente componente ale mediului de programare grafic
LabVIEW utilizând breviarul prezentat anterior.d) Se implementează programele descrise mai jos.
4.1. Convertor Secunde
DescriptionYou creat a VI from an employee that takes the seconds until a plane arrives at an airport and converts the time into a combination of hours/minutes/seconds. You must evaluate this VI to see if it works as expected and can display the remaining time until the plane arrives.
11
Implementation
1. Creati Panoul Frontal și Diagrama Bloc a VI-ului din figurile de mai jos
Figure 1. Front Panel Items
Figure 2. Block Diagram Items
2. On the front panel, identify the following items:❑ Control❑ Indicator❑ Icon❑ Connector Pane3. To view the front panel and block diagram at the same time, select
12
Window»Tile Up and Down or Window»Tile Left and Right.4. On the block diagram, identify the following items:❑ Control❑ Indicator5. Test the VI using the values given in Table 1.❑ Enter the input value in the Total Time in Seconds control.❑ Click the Run button.❑ For each input, compare the given outputs to the outputs listed in Table 1. If the VI works correctly, they should match.
Table 1. Testing Values for Seconds Breakdown.vi
4.2. Convertor C in FCreati un VI care sa faca conversia din grade Celsius in grade Fahrenheit si care sa poate fi utilizat apoi ca un subVI.
1. Creati un control numeric digital pentru a introduce temperatura in grade Celsius. Selectati controlul din caseta Controls»Numeric. Mutati controlul in panoul frontal dand in locul in care doriti sa-l pozitionati. Editati eticheta (grade Celsius)
2. Creati un indicator numeric digital pentru a introduce temperatura in grade Fahrenheit. Selectati indicatorul din caseta Controls»Numeric. Mutati indicatorul in panoul frontal dand clic in locul in care doriti sa-l
pozitionati. Editati eticheta (grade Fahrenheit)
LabVIEW creeaza terminalele corespunzatoare controalele si indicatoarele in diagrama bloc.
3. Afisati diagrama bloc folosind Window»Show Diagram.4. Selectati functiile inmultire si adunare din caseta Functions»Numeric.5. Selectati constante numerice din caseta Functions»Numeric, tipariti valorile
corespunzatoare in casutele acestora.
13
6. Conectati obiectele din diagrama bloc.7. Salvati VI: File»Save. (conversia grade Celsius in grade Fahrenheit.vi)8. Introduceti un numar in controlul digital si rulati VI.
4.2. Create a simple Calculator Create a simple calculator that Add and Subtract 2 numbers like this: