111
Department of Science, Information Technology and Innovation 1 JULY – 12 DECEMBER 2017
| Date post: | 10-Jan-2019 |
| Category: |
Documents |
| Upload: | nguyendiep |
| View: | 214 times |
| Download: | 0 times |

11 JULY – 12 DECEMBER 2017Department of Science, Information Technology and Innovation
1 JULY – 12 DECEMBER 2017

THIS PAGE IS INTENTIONALLY LEFT BLANK

Letter of compliance15 May 2018
The Honourable Leeanne Enoch MP Minister for Innovation, Science and the Digital Economy and Minister for Small Business Level 32, 1 William Street Brisbane Qld 4000
Dear Minister
I am pleased to submit for presentation to the Parliament the Final report 2017–18 and Final Financial Statements for the Department of Science, Information Technology and Innovation (DSITI).
Following the machinery-of-government changes implemented on 12 December 2017, DSITI was abolished as a department. The functions of the former Department of Science, Information Technology and Innovation were transferred to the following departments:
• Department of Innovation, Tourism Industry Development and the Commonwealth Games
• Department of Housing and Public Works (DHPW)
• Department of Environment and Science
• Department of the Premier and Cabinet—administered the Queensland Government Chief Information Office (QGCIO), Digital Economy and One-Stop Shop for the period 12 December 2017 to 8 February 2018. From 9 February 2018 these functions transferred to DHPW.
The final report outlines the activities and achievements of the former Department of Science, Information Technology and Innovation for the period 1 July to 12 December 2017.
I certify this annual report complies with:
• the prescribed requirements of the Financial Accountability Act 2009 and the Financial and Performance Management Standard 2009
• the detailed requirements set out in the Annual report requirements for Queensland Government agencies.
A checklist outlining the Queensland Government’s annual reporting requirements is included in section 8 of this report.
Yours sincerely
Jamie Merrick Former Director-General

FINALREPORT1 JULY – 12 DECEMBER 2017
PART ACopyright © The State of Queensland (Department of Science, Information Technology and Innovation) 2017
Licence This annual report is licensed by the State of Queensland (Department of Science, Information Technology and Innovation) under a Creative Commons Attribution (CC BY) 4.0 Australia licence.
CC BY licence summary statement In essence, you are free to copy, communicate and adapt this annual report, as long as you attribute the work to the State of Queensland (Department of Science, Information Technology and Innovation). To view a copy of this licence, visit: http://creativecommons.org/licenses/by/4.0/
Attribution Content from this annual report should be attributed as: The State of Queensland (Department of Science, Information Technology and Innovation) Final report 2017–18
ISSN 2205-2712
DSITI FINAL REPORT

11 JULY – 12 DECEMBER 2017
FINALREPORT1 JULY – 12 DECEMBER 2017
PART A

2 DSITI FINAL REPORT
Table of contentsPART A About our final report . . . . . . . . . . . . . . . . . . . . . . . . . . . . . . . . . . 4
View our report online . . . . . . . . . . . . . . . . . . . . . . . . . . . . . . . . . . . . . . . . . . . . 4
From the Director-General . . . . . . . . . . . . . . . . . . . . . . . . . . . . . . 5
1. About the department . . . . . . . . . . . . . . . . . . . . . . . . . . . . . . . 6Who we are . . . . . . . . . . . . . . . . . . . . . . . . . . . . . . . . . . . . . . . . . . . . . . . . . . . . . 6Machinery-of-government changes . . . . . . . . . . . . . . . . . . . . . . . . . . . . . . . . . . 6Our structure as at 12 December 2017 . . . . . . . . . . . . . . . . . . . . . . . . . . . . . . . 7Our vision . . . . . . . . . . . . . . . . . . . . . . . . . . . . . . . . . . . . . . . . . . . . . . . . . . . . . . 8Our purpose . . . . . . . . . . . . . . . . . . . . . . . . . . . . . . . . . . . . . . . . . . . . . . . . . . . . 8Our strategic objectives . . . . . . . . . . . . . . . . . . . . . . . . . . . . . . . . . . . . . . . . . . . 8Our success indicators . . . . . . . . . . . . . . . . . . . . . . . . . . . . . . . . . . . . . . . . . . . . 9Our values . . . . . . . . . . . . . . . . . . . . . . . . . . . . . . . . . . . . . . . . . . . . . . . . . . . . . . 9Our role . . . . . . . . . . . . . . . . . . . . . . . . . . . . . . . . . . . . . . . . . . . . . . . . . . . . . . . . 9Our operating environment . . . . . . . . . . . . . . . . . . . . . . . . . . . . . . . . . . . . . . . 10Our strategic risks . . . . . . . . . . . . . . . . . . . . . . . . . . . . . . . . . . . . . . . . . . . . . . 11Legislation administered by the department . . . . . . . . . . . . . . . . . . . . . . . . . 11
2. Our service performance . . . . . . . . . . . . . . . . . . . . . . . . . . . . 12Advancing Queensland through innovation . . . . . . . . . . . . . . . . . . . . . . . . . 12Services for Queenslanders . . . . . . . . . . . . . . . . . . . . . . . . . . . . . . . . . . . . . . . 17Services for government . . . . . . . . . . . . . . . . . . . . . . . . . . . . . . . . . . . . . . . . . 20Our performance . . . . . . . . . . . . . . . . . . . . . . . . . . . . . . . . . . . . . . . . . . . . . . . 21Performance review . . . . . . . . . . . . . . . . . . . . . . . . . . . . . . . . . . . . . . . . . . . . . 24Other whole-of-government plans and specific initiatives . . . . . . . . . . . . . . 26

31 JULY – 12 DECEMBER 2017
3. Our governance . . . . . . . . . . . . . . . . . . . . . . . . . . . . . . . . . . . 28Our leaders . . . . . . . . . . . . . . . . . . . . . . . . . . . . . . . . . . . . . . . . . . . . . . . . . . . . 28Governance framework . . . . . . . . . . . . . . . . . . . . . . . . . . . . . . . . . . . . . . . . . . 30Our leadership and accountability model . . . . . . . . . . . . . . . . . . . . . . . . . . . 31Our committees . . . . . . . . . . . . . . . . . . . . . . . . . . . . . . . . . . . . . . . . . . . . . . . . 32Audit arrangements . . . . . . . . . . . . . . . . . . . . . . . . . . . . . . . . . . . . . . . . . . . . . 35Risk management . . . . . . . . . . . . . . . . . . . . . . . . . . . . . . . . . . . . . . . . . . . . . . . 35External assurance . . . . . . . . . . . . . . . . . . . . . . . . . . . . . . . . . . . . . . . . . . . . . . 36Information systems and knowledge management . . . . . . . . . . . . . . . . . . . . 36
4. Our people . . . . . . . . . . . . . . . . . . . . . . . . . . . . . . . . . . . . . . . 37
5. Our locations . . . . . . . . . . . . . . . . . . . . . . . . . . . . . . . . . . . . . 43
6. Our financial performance . . . . . . . . . . . . . . . . . . . . . . . . . . . 46
7. Glossary of terms . . . . . . . . . . . . . . . . . . . . . . . . . . . . . . . . . . 50
8. Compliance checklist . . . . . . . . . . . . . . . . . . . . . . . . . . . . . . . 52
PART B Financial Statements . . . . . . . . . . . . . . . . . . . . . . . . . . . . . . . . . 55

4 DSITI FINAL REPORT
About our final reportThe Department of Science, Information Technology and Innovation (DSITI) Final Report 1 July – 12 December 2017 is an integral part of our corporate governance framework. It is a key tool in ensuring we are accountable to stakeholders, the Queensland Parliament and the community about our activities.
This report details our achievements, performance and financial position for the period from 1 July to 12 December 2017. It aligns with the DSITI Strategic Plan 2017–2021 and the Queensland Government’s objectives for the community of:
` creating jobs and a diverse economy
` delivering quality frontline services
` protecting the environment
` building safe, caring and connected communities.
It also provides information on our people management and corporate governance.
View our report onlineThis report and the information on DSITI government bodies is available online: http://www.qld.gov.au/dsiti/annual-report.
More information on the Queensland Government Open Data websiteSeveral annual reporting requirements for this year are addressed by publishing information on the Queensland Government Open Data website. These are:
` consultancies
` overseas travel
` Queensland language services policy.
For further information, please visit https://data.qld.gov.au.

51 JULY – 12 DECEMBER 2017
I am proud to present the Final report 2017–18 for the former Department of Science, Information Technology and Innovation (the department) for the period 1 July to 12 December 2017.
On 12 December 2017, the Queensland Government announced its decision to abolish the Department of Science, Information Technology and Innovation.
As in previous years, the department successfully delivered a range of whole-of-government programs, making major strides in improving service delivery across government and Queensland.
This report celebrates our achievements, provides insight into our diverse and vital service delivery, and highlights our commitment to the Queensland Government’s objectives for the community.
In an increasingly competitive global economy, our aim was to position Queensland as a vibrant research and innovation hub and an attractive destination for research and development, venture capital and industry investment. We harnessed strategic opportunities to build a stronger and more diversified Queensland economy. Of particular note, in December 2017 the leadership of the Office of the Queensland Chief Scientist and the Science Division was instrumental in attracting the headquarters of the Defence Co-operative Research Centre for Trusted Autonomous Systems to Queensland.
Through the Advance Queensland initiative, we have backed local businesses to start and grow, and fostered world-class, applied research that will transform lives, communities and industries. With our partners we are delivering a real and lasting change. In November 2017, the Commonwealth Bank Business Insights report identified Queensland as the most innovative state in the nation, with the highest rate of improvement in the past 12 months.
Innovation and digital transformation are also at the heart of delivering improved public services and increasing collaboration between government, business and customers. To this end, in September 2017 we launched DIGITAL1ST: Advancing our Digital Future, a new strategy to harness digital technology to better meet the needs and aspirations of Queensland citizens and business. We continued to invest in emerging technologies to deliver better and more cost-effective services—where, when and how citizens want to access public services. Our programs continued to transform and digitise Queensland Government service delivery.
I would like to take this opportunity to thank the department’s employees for their enduring commitment to deliver for the people and businesses of Queensland—your professionalism, enthusiasm and dedication have been inspirational. Our shared sense of purpose, embrace of innovation and collaborative approach to our work were reflected in the largest increases in agency engagement across the Queensland Public Service during the period 2015–17. I have every confidence that the exceptional staff of DSITI will continue to provide excellent services to the Queensland community as part of their new departments.
Jamie Merrick Former Director-General
From the Director-General

6 DSITI FINAL REPORT
1. About the departmentWho we areA diverse organisation that brought together science, information technology and innovation to deliver the Queensland Government’s community objectives. Our purpose was to drive innovation-led growth and jobs, provide Queenslanders with fast and easy access to government services, and deliver trusted corporate, digital and scientific services to public sector agencies, industry and the community.
Under section 56 of the Public Records Act 2002 (the Act), Queensland State Archives (QSA) produces a separate annual report on the administration of the Act. Financial statements for QSA are consolidated into the DSITI financial statements and are included in this report.
Under the Financial Accountability Act 2009, the State Library of Queensland (SLQ) produces a separate annual report and financial statements on the administration of the Libraries Act 1988.
Machinery-of-government changesIn December 2017, the department was abolished following a machinery-of-government change—refer to the Administrative Arrangements Order (No.3) 2017 and Administrative Arrangements Order (No.4) 2017.
The functions of the department were transferred to the following agencies:
` Department of Environment and Science — Responsibility for science excluding the Office of the Queensland Chief Scientist — Office of the Queensland Chief Scientist — Responsibility for the provision of corporate and executive services to science including the
Office of the Queensland Chief Scientist — Responsibility for the provision of support to the State Library of Queensland established
under the Libraries Act 1988.
` Department of Housing and Public Works (DHPW) — Smart Service Queensland — Queensland State Archives — Responsibility for Strategic ICT including CITEC — Responsibility for open data — Responsibility for digital economy policy and collaboration — Queensland Shared Services — Responsibility for the provision of corporate and executive services to Smart Service
Queensland, Queensland State Archives, Strategic ICT including CITEC, open data, digital economy policy and collaboration and Queensland Shared Services.
` Department of Innovation, Tourism Industry Development and the Commonwealth Games — Responsibility for innovation — Responsibility for the provision of corporate and executive services to innovation — Contract and Investment Management Unit of Science Development — Responsibility for the provision of corporate and executive services to the Contract and
Investment Management Unit of Science Development.

71 JULY – 12 DECEMBER 2017
Minister for Innovation, Science and the Digital Economy and
Minister for Small Business
State Library of Queensland Chief Executive Officer and
State Librarian
Office of the Queensland Chief Scientist Queensland Chief Scientist
Director-GeneralOffice of the Director-General
Senior Director
Queensland Government Chief Information Office
Queensland Government Chief Information Officer
Strategic Policy and Innovation
Deputy Director-General
Science Assistant
Director-General
Digital Productivity and Services
Assistant Director-General
Corporate Deputy
Director-General
Queensland Shared Services Assistant
Director-General
Strategic ICT Assistant
Director-General
Digital Enterprise Office
Chief Information Officer
Communications Executive Director
Strategic Governance, Performance and
Reporting Director
Human Resources Chief Human
Resources Officer
Finance, Procurement and Business
Services Chief Finance Officer
Internal Audit Director
Executive Services Director
Service Delivery Executive Director
Systems Executive Director
Strategy and Engagement
Executive Director
CITEC ICT Services General Manager
CITEC Information Brokerage
Executive Director
ICT Strategic Sourcing
Executive Director
Strategic ICT Projects
Executive Director
Business Planning and Strategic
Initiatives Director
Smart Service Queensland
General Manager
One-Stop Shop Strategy and
Implementation Office General Manager
Digital Economy and Productivity
Director
Queensland State Archives
Executive Director and State Archivist
Science Delivery Executive Director
Science Development
Executive Director
Innovation Policy and Governance
Executive Director
Innovation Programs Executive Director
Innovative Government and
Partnerships Executive Director
` Department of the Premier and Cabinet (DPC)* — One-Stop Shop Strategy and Implementation Office — Digital Economy and Productivity excluding responsibility for open data and digital
economy policy and collaboration — Queensland Government Chief Information Office — Responsibility for the provision of corporate and executive services to One-Stop Shop
Strategy and Implementation Office, Digital Economy and Productivity (excluding responsibility for open data and digital economy policy and collaboration) and Queensland Government Chief Information Office.
* Functions managed by DPC for the period 12 December 2017 to 8 February 2018. From 9 February 2018 these functions transferred to DHPW.
Our structure as at 12 December 2017

8 DSITI FINAL REPORT
Our visionA better Queensland through science, innovation and technology.
Our purposeTo drive innovation-led growth and jobs, provide Queenslanders with fast and easy access to government services, and deliver trusted corporate, digital and scientific services to government agencies, industry and the community.
Our strategic objectivesOur strategic objectives from the DSITI Strategic Plan 2017–2021:
` Advancing Queensland through innovation: — increase entrepreneurship and encourage more people into science, technology,
engineering and mathematics (STEM) — support existing and emerging industries to be globally competitive — enable more Queensland businesses to attract investment and scale in global markets — turn Queensland’s scientific excellence into commercial opportunities and ground-breaking
solutions.
` Improving services for Queenslanders: — make it easier and quicker for citizens and businesses to engage with government — strengthen digital inclusion and develop services that are digital by default and designed
around the needs of the user — provide citizens and businesses with the skills and knowledge needed to flourish in the
digital age — expand our open data offering to support innovation and growth.
` Improving services for government: — maintain trust in government by supporting the protection of government digital assets and
information and building cyber resilience — help government run more efficiently through high quality advice, assurance and innovative
government-to-government services.
` Improving our organisation: — constantly deliver greater value for our customers and be a great place to work and grow.
We contributed to the Queensland Government's objectives for the community by:
` driving innovation-led growth to help foster job creation and a diverse economy
` providing scientific services to help protect the environment
` enabling frontline services by working with agencies to put people at the centre of service design
` harnessing digital platforms to contribute to building safe, caring and connected communities.
1. About the department

91 JULY – 12 DECEMBER 2017
Our success indicators ` A flourishing innovation ecosystem in Queensland with:
— a higher rate of startup formation — increased business and jobs growth through innovation — increased collaboration between business, industry and the science base — greater translation of research into benefits to Queensland.
` Greater impact and value for money from our programs, systems and services.
` Improved customer engagement and satisfaction.
` Improved employee engagement and satisfaction.
` Service quality and outcomes that meet or exceed relevant industry benchmarks.
Our valuesA workforce of engaged, connected and capable individuals who are motivated to deliver better outcomes for Queenslanders was critical to our success. We supported a positive organisational culture through our values:
Unleash potential• Expect greatness
• Lead and set clear expectations
• Seek, provide and act on feedback
• Know your customer
• Deliver what matters
• Make decisions with empathy
Ideas into action• Challenge the norm and
suggest solutions
• Encourage and embrace new ideas
• Work across boundaries
Be courageous• Own your actions,
successes and mistakes
• Take calculated risks
• Act with transparency
Empower people• Lead, empower and
trust
• Play to everyone’s strengths
• Develop yourself and those around you
Our roleDevelopments in technology and the growth of digitally-connected societies and economies drove our progress.
Through the Advance Queensland agenda, we backed ideas that created jobs now and for the future, supported local businesses to start and grow, and made the lives of Queenslanders better.
Innovation and digital transformation are at the heart of delivering improved public services and increasing collaboration between government, business and customers. We captured existing and emerging technologies to deliver better and more cost-effective services—where, when and how citizens wanted to access them.

10 DSITI FINAL REPORT
We:
` nurtured and attracted scientific and entrepreneurial talent
` invested in the translation of scientific research to deliver economic, social and environmental outcomes for Queensland
` increased collaboration between business, industry and the research base, and with international partners
` increased the rate of startup formation and addressed barriers to growth for innovative businesses
` provided investment and increased co-investment to build Queensland's capacity to conduct innovative research and development, and to attract and retain the best and brightest
` encouraged greater innovation in government and the benefits of government as a lead customer for emerging technologies
` developed and delivered innovative, digitally-enabled and integrated government services that were simpler and faster for the community to access online or through phone and counter channels
` assisted Queensland public authorities to manage and preserve public records in a usable form, and improved community access to such records
` provided trusted scientific services and technical advice to the public sector, government agencies, industry and the community to underpin environmental and natural resource management, planning, decision-making and policy-setting
` led complex, multi-agency ICT programs and projects, managed ICT strategic sourcing and procurement arrangements, and facilitated related engagement between the ICT industry and government
` provided an extensive range of ICT and corporate services to government through the agencies of CITEC and Queensland Shared Services (QSS).
We delivered our core business through three key service areas. These are detailed in Section 2: Our services.
Our operating environmentWe delivered our policy initiatives and programs within a complex operating environment that was influenced by factors including:
` globalisation, digital transformation, new technologies and business strategies that are rapidly diversifying and reshaping markets, industries and communities
` innovation as the primary driver of productivity growth, job creation and long-term prosperity and living standards
` citizen demand for access to digitally-driven, personalised and predictive government services
` rapid growth in automation, cloud-based, platform and as-a-service models, and hyper-connectivity through the internet of things—bringing the ability to transform public service models
` the need for enhanced digital skills, connectivity and inclusion if Queensland is to flourish as a global innovation hub, and people and businesses are to reach their full potential.
1. About the department

111 JULY – 12 DECEMBER 2017
Our strategic risksDSITI’s key strategic risks:
` ensuring our resourcing and capability supported effective delivery of government priorities and services
` being agile enough to integrate new technologies and business models quickly and effectively
` predicting or responding rapidly to changing customer needs and expectations
` ensuring government could prevent and respond effectively to emerging cyber risks.
Legislation administered by the departmentAs at 12 December 2017, the department administered the following Acts:
` Biodiscovery Act 2004
` Gene Technology (Queensland) Act 2016
` Libraries Act 1988
` Public Records Act 2002
` Schools of Arts (Winding Up and Transfer) Act 1960
` Schools of Arts (Winding Up and Transfer) Act Amendment Act 1981
` Tweed River Entrance Sand Bypassing Project Agreement Act 1998.

12 DSITI FINAL REPORT
2. Our service performanceAdvancing Queensland through innovation
Objectives
` Drive economic growth and job creation through science and innovation, harnessing Queensland’s research strengths and entrepreneurial spirit.
` Support existing and emerging industries to be globally competitive.
` Enable more Queensland businesses to attract investment and scale in global markets.
` Turn Queensland’s scientific excellence into commercial opportunities and ground-breaking solutions.
Overview
The service area provided support to build a more collaborative and effective innovation ecosystem in Queensland.
Our areas of focus were to:
` nurture and attract scientific and entrepreneurial talent
` invest in the translation of scientific research to deliver economic, social and environmental outcomes for Queensland
` increase collaboration between business, industry and the research base, and with international partners
` increase the rate of startup formation and address barriers to growth for innovative businesses
` provide investment and increase co-investment to build Queensland's capacity to conduct innovative research and development, and to attract and retain the best and brightest
` encourage greater innovation in government and the benefits of government as a lead customer for emerging technologies.
Our key services were:
` Innovation and digital economy
` Science development.
Our performance
We advanced Queensland through innovation and contributed to the department’s strategic objectives as outlined in our Strategic plan 2017–2021 and the whole-of-government direction.
The four strategic objectives that drove our achievements were:
1. Increase entrepreneurship and encourage more people into STEM.
2. Support existing and emerging industries to be globally competitive.
3. Enable more Queensland businesses to attract investment and scale in global markets.
4. Turn Queensland’s scientific excellence into commercial opportunities and ground-breaking solutions.

131 JULY – 12 DECEMBER 2017
During the reporting period, the department administered over 45 innovation programs, assessed more than 600 applications, and approved more than 350 grants or other opportunities bringing the total funds committed over the life of the program to more than $144 million.
We inspired Queenslanders to be entrepreneurial, engage in science and technology and showcase their ideas to the world by:
` appointing well-known investor and tech founder, Steve Baxter as Queensland’s second Chief Entrepreneur
` granting funding to 19 recipients under the Queensland Startup Events and Activities Fund to build capability in Queensland’s startup community
` supporting five Queensland regionally-based female founders to travel to London with the Startup Catalyst Female Founders Mission from 26 November to 2 December 2017
` delivering 19 one-hour sessions of ‘The Drone Experience’—an educational and fun activity—held each weekday during National Science Week, giving 360 year 5 and 6 students from 33 Queensland schools a hands-on introduction to drone technology
` delivering a blogging workshop for 20 Queensland researchers as part of the Office of the Queensland Chief Scientist’s Partner Up Queensland initiative with half of the researchers based at regional universities
` enabling Flying Scientist visits to Charleville, Mt Isa, Weipa and Calen reaching over 700 people. The Flying Scientists presented their research and discussed their career in STEM with schools and the community in the regions
` collating an activity book designed by Queenslanders using STEM in their jobs which was distributed at the Ekka, the launch of National Science Week and throughout schools and community groups in Queensland
` presenting 12 researchers as Queensland Young Tall Poppy Award Winners with Dr Lee Hickey from The University of Queensland awarding Queensland Young Tall Poppy of the Year.
We facilitated discoveries to improve everyday lives through programs to foster current and future talent and enabled researchers and industry to solve global challenges here in Queensland by:
` supporting the STEM.I.AM program—a coordinated program of activities to increase the number of Aboriginal and Torres Strait Islander students pursuing STEM at university. The program is a collaboration between DSITI, Carbon Media Pty Ltd, Department of Education and Training and the State Library of Queensland
` opening the Advance Queensland–TAFE Queensland Pathways Scholarships program. The program will provide up to 35 TAFE/university top-up scholarships to disadvantaged STEM students over two years
` opening the 2018 Round of Queensland Academy of Science, Cooper Hewitt and Smithsonian fellowship programs to enable talented professionals to gain experience in international settings.

14 DSITI FINAL REPORT
We connected Queenslanders to world-leading local and international innovators through programs that encouraged collaboration and build the entrepreneurial ecosystem by:
` continuing to support The Precinct in Brisbane’s Fortitude Valley, bringing together Queensland startups, incubators, investors and mentors
` providing funding to 12 regions through the Advancing Regional Innovation Program and Regional Network Fund, encouraging innovation across Queensland and supporting local economies to create jobs for regional Queenslanders
` attracting a further 28 international and interstate entrepreneurial startups to Queensland through Round 2 of the Hot DesQ program to inject new talent, increase connectivity and skills and improve access to global startup communities and international programs
` co-funding Queensland’s participation in the MIT Regional Entrepreneurship Acceleration Program to support the future development of Queensland’s entrepreneurial ecosystem
` supporting collaboration between five small businesses and universities through the Knowledge Transfer Partnerships program
` delivering 21 workshops across 11 regions through the Innovate Queensland with Impact Innovation Group Pty Ltd, connecting small and medium enterprises (SMEs) with the right people and practical know-how to translate innovative ideas into commercial outcomes and incomes
` funding 11 Queensland Agtech startups to travel to Israel from 5–13 August 2017 in partnership with Austrade and Startup Catalyst
` finalising the immersive visits of the seven Advance Queensland Commercialisation Partnership Program grant recipients in Chinese incubators to investigate market intelligence, undertake competitor analysis, test, validate or reject their approach to develop prototypes and seek investment.
We invested in Queensland innovation through programs to encourage seed funding, venture capital and deal-flow, and foster emerging industries by:
` backing a further 85 startups and Queensland SMEs through the Ignite Ideas Fund to support the rapid commercialisation of their market-ready Queensland innovations
` enabling the potential commercialisation of new bio-products by processing eight biodiscovery approvals, including four biodiscovery plans and four benefit-sharing agreement memoranda
` supporting three organisations to help take their sport science innovations to market.
2. Our service performance

151 JULY – 12 DECEMBER 2017
We grew the competitiveness of our businesses, industries and regions through programs to accelerate growth and unlock new markets and opportunities by:
` awarding nine Queensland research organisations Innovation Partnership grants to collaborate on projects with industry that will increase the speed and scale of translation of our science and research to:
— boost productivity growth — improve the competitiveness of existing industries — accelerate the development of emerging industries and technologies
` launching the Growing Queensland’s Companies program to support up to 200 Queensland firms with high-growth potential to lead their businesses to the next level
` providing 11 SMEs the opportunity to improve the positioning of their products by working collaboratively with the Queensland Government on business challenges through the Testing within Government Program (TWiG). These SMEs received funding to test and refine their product while addressing real business problems
` providing co-funding with University of Queensland to attract HYPE SPIN-Lab sports technology accelerator to be delivered in Queensland for three years.
We created greater innovation in government and drove the benefits of government as a lead customer of innovative procurement by:
` launching round 2 of the Small Business Innovation Research program, providing commercial opportunities for innovators while solving the following four Queensland Government challenges:
— providing an affordable and accessible point of entry to public housing — electronic, automated monitoring of commercial fishing operations in Queensland — real-time, personal monitoring of dust at Queensland underground coal mines — supporting learning for students with disabilities in rural and remote locations.
We collaborated with service providers, government agencies, business and corporate entities to implement a digital adoption program that encouraged Queenslanders to develop essential digital skills by:
` providing the Digital Scorecard—an online assessment tool utilised by more than 380 SMEs and not-for-profit organisations to measure their digital capability and improve their competitiveness in the digital economy
` delivering 12 Digital Business Workshops which assisted 200 businesses to focus on areas where they can improve their level of digital capability, and develop a digital action plan
` commencing the development of the Queensland Digital Infrastructure Plan.

16 DSITI FINAL REPORT
Performance review
The following service standards in the department’s Service Delivery Statements 2017–18 were used by the department and the government to assess the service area’s overall performance.
Service standard Notes2017–18 target/est.
2017–18 actual
Ratio of investment leveraged as a result of Queensland government funding invested
1, 2 1:1.25 N/A
External funds leveraged from grants funds committed 2, 3 1:1.25 N/A
Proportion of stakeholders who are satisfied with innovation and commercialisation consultative and engagement processes
4, 5 >85% 92%
Percentage of potential collaboration opportunities identified by participants of innovation and collaboration programs/events
6 >25% 35%
Proportion of stakeholders who are satisfied with digital economy and productivity services, consultative and engagement processes
7 >85% N/A
Percentage of science funding recipients satisfied with contract management services provided for science-related grant programs (overall satisfaction)
8 >89% N/A
Notes
1. This measure is an indicator of the efficient use of government funding to leverage private/commercial/philanthropic/Australian Government sector investments. The target indicates that $1.25 is leveraged for every $1 of government funds invested. It is a direct output from the facilitation and Queensland government funding administered by this service. Customers include but are not limited to startups, entrepreneurs, business/industry, research centres, universities and government. This measure is intended to be an annualised ratio.
2. Result for this measure is not available for inclusion in the final report for the reporting period between 1 July 2017 and 12 December 2017, as the data is collected annually. The actual result is expected to be published in Service Delivery Statements 2018–19 and/or Annual report 2017–18 of the respective receiving agencies.
3. This efficiency measure demonstrates the amount of investment generated into the science/research sector as a result of investment made under the various funding programs. The target indicates that for every dollar provided via the various grant programs managed, that a greater matching contribution is sought from successful recipients (such as universities, industries and business).
4. Stakeholders include business, industry, startups, entrepreneurs, universities and research organisations and may also include Advance Queensland recipients and the third-party providers of Advance Queensland support programs.
5. The positive result was attributed to high levels of customer satisfaction for the Young Starters Fund, Startup Queensland Events and Activities Fund, and the Innovate Queensland workshops that were delivered between 1 July and 12 December 2017.
6. This activity measure represents the opportunities identified for collaboration as a result of the funding invested in programs for partnering and collaboration. The results highlighted a high level of potential collaboration opportunities through the Young Starters Fund, Queensland Startup Events and Activities Fund, and Innovate Queensland workshops that were conducted between 1 July and 12 December 2017. This increase shows positive outcomes for collaboration opportunities.
7. Stakeholders include business, industry, universities and research organisations. Result for this measure is not available for inclusion in the final report as the annual survey was not undertaken during the reporting period. The actual result is expected to be published in Service Delivery Statements 2018–19 and/or Annual report 2017–18 of the respective receiving agencies.
8. Customers include recipients of Advance Queensland grants. Result for this measure is not available for inclusion in the final report as the annual survey was not undertaken during the reporting period. The actual result is expected to be published in Service Delivery Statements 2018–19 and/or Annual report 2017–18 of the respective receiving agencies.
2. Our service performance

171 JULY – 12 DECEMBER 2017
Services for Queenslanders
Objectives ` Provide customers with simple and easy access to integrated Queensland Government services.
` Ensure Queensland public records are preserved for the benefit of current and future generations.
Overview
The service area provided access to leading-edge services designed around the citizen, increased digital inclusion across Queensland and made it easier for businesses and organisations to engage with government.
Our areas of focus were to:
` develop innovative, digitally-enabled and integrated government services that are simpler and faster for the community to access online or through phone and counter channels
` lead a major program of work to continue the design and delivery of proactive and personalised services
` lead the management and preservation of Queensland’s public records and improve public access to the collection
` partner with government and non-government organisations to develop and implement policies and initiatives that improve Queenslanders’ digital capabilities and adoption of digital technologies.
Our key services were:
` Whole-of-government customer experience
` Government recordkeeping and archival services.
Our performance
We improved services for Queenslanders and contributed to the department’s strategic objectives as outlined in our Strategic plan 2017–2021 and the whole-of-government direction.
The four strategic objectives that drove our achievements were:
1. Make it easier and quicker for citizens and businesses to engage with government.
2. Strengthen digital inclusion and develop services that are digital by default and designed around the needs of the user.
3. Provide citizens and businesses with the skills and knowledge needed to flourish in the digital age.
4. Expand our open data offering to support innovation and growth.

18 DSITI FINAL REPORT
We continued to support access, transformation and digitisation of Queensland Government information and services by:
` managing more than two million interactions through phone (13QGOV) and in-person services between July and December 2017. Online, qld.gov.au, received more than 34 million visits in the same period
` piloting My Account—a personalised and proactive service trialled with Queensland Seniors which provides customers with one central account to access all government services. My Account currently integrates 20 services
` delivering and transitioning the first whole-of-government service from pilot to production—Tell us once change of address, eliminating the need for customers to inform many agencies of their move. The service leverages key digital capabilities such as customer identity management, customer details management, customer enquiry tracking and notifications and services repository
` piloting a new whole-of-government grants and assistance finder which now includes all grants across the Queensland Government and provides the opportunity for users to tailor results based on their needs. Now connecting 299 grant services, this builds on learnings from the initial grants and assistance finder pilot (released in 2016) tailored to the business and research community
` continuing to drive the government’s open data agenda. Queensland mounted five state challenges and one national challenge for GovHack 2017, and hosted the state and international Red Carpet Awards in Brisbane. Queensland teams won nine of the 30 categories as well as collected four runners up awards and 12 honourable mentions.
We promoted and increased access to the archival collection at QSA by:
` launching the ‘Windmill of Your Mind: Stories Inspired by the Spring Hill Windmill’ exhibition on 27 July 2017. To date the exhibition has received 586 visits
` conducting practical workshops in Gympie on salvaging personal records and research tips for archives
` completing a successful trial with Team Robosys—participant from QUT's Bluebox Robotics Accelerator, using Pepper the humanoid robot for storytelling activities for school children
` releasing the Digital Recordkeeping Transformation Program to improve recordkeeping across government
` successfully holding a Sprint with QUT and One-Stop Shop Strategy and Implementation Office to reimagine recordkeeping
` using Flickr to connect with citizens. Between July and December 2017 QSA content received 1,360,354 Flickr views
` participating in the Brisbane Open House Scheme, showcasing its archival facility.
We partnered to increase the digital skills of all Queenslanders by:
` increasing understanding of digital inclusion issues and programs by actively participating and supporting research and collaboration with community groups, industry, academia, and other government agencies
2. Our service performance

191 JULY – 12 DECEMBER 2017
` stimulating interest and excitement in digital technologies and digital literacy in regional communities, where more than 1200 people participated in 41 workshops, four public exhibitions and five consultation forums as part of the Digital Skills for all Queenslanders roadshow
` expanding the Advance Queensland Community Digital Champions program through the selection of 17 new champions during the reporting period. To date, our champions have conducted more than 600 activities and reached more than 130,000 people across the state
` strengthening the digital skills pipeline and encouraging under-represented groups to consider digital pathways through financial and in-kind support for programs such as STEM.I.AM scholarships for Indigenous students, and NodeGirls and Django Girls programming workshops.
Performance review
The following service standards in the department’s Service Delivery Statements 2017–18 were used by the department and the government to assess the service area’s overall performance.
Service standard Notes2017–18 target/est.
2017–18 actual
Percentage of clients satisfied with the One-Stop Shop Program 1, 2 80% N/A
Percentage of customers satisfied with the services provided by Smart Service Queensland on behalf of government agencies
1, 2, 3 >85% N/A
Percentage of clients satisfied with the services provided by Smart Service Queensland on their behalf
1,2 >80% N/A
Cost per customer service interaction (all interaction) 4 $1.38 N/A
Overall customer satisfaction with Queensland State Archives delivery of services to the public
2, 5 >93% N/A
Percentage of clients satisfied with the services provided by Queensland State Archives
1, 2, 6 >98% N/A
Average cost to Queensland State Archives per record accessed 7 $10 N/A
Notes
1. Result for this measure is not available for inclusion in the final report as the annual survey was not undertaken during the reporting period. The actual result is expected to be published in Service Delivery Statements 2018–19 and/or Annual report 2017–18 of the respective receiving agencies.
2. The term ‘client’ is used to identify other government departments or agencies, while the term ‘customer’ identifies members of the public. It is a measure of overall satisfaction.
3. This measure is based on customer satisfaction survey results for the phone (13 QGOV) and counter (Queensland Government Service Centres (QGSC) and Queensland Government Agent Programs (QGAP)) services managed by Smart Service Queensland (SSQ).
4. The measure is calculated based on the operating costs divided by interaction data. Customer service interactions include online sessions (qld.gov.au), in-person (QGAP and QGSC), telephone (13 QGOV), counter, card and concessions. Result for this measure is not available for inclusion in the final report for the reporting period between 1 July and 12 December 2017, as the data is collected annually. The actual result is expected to be published in Service Delivery Statements 2018–19 and/or Annual report 2017–18 of the respective receiving agencies.
5. This is a biennial customer satisfaction survey last conducted for QSA in March 2017. The next survey will be conducted in 2019.
6. This measure introduced in 2017–18 shows client satisfaction of QSA delivery of services to clients. The term ‘client’ refers to public authorities/government agencies. The survey relating to policy advice service has a standard question for overall satisfaction and the key drivers of satisfaction (timeliness, ease of access, staff and quality).
7. This measure was introduced in Service Delivery Statements 2017–18 and shows the average unit cost per record accessed (including online digital access). Result for this measure is not available for inclusion in the final report for the reporting period between 1 July and 12 December 2017, as the data is collected annually. The actual result is expected to be published in Service Delivery Statements 2018–19 and/or Annual report 2017–18 of the respective receiving agencies.

20 DSITI FINAL REPORT
Services for government
Objectives
Provide a range of specialist services, modern corporate services and trusted advice that supports the achievement of government priorities and assists Queensland Government agencies to deliver their services.
Overview
The service area provided high quality government-to-government services and advice, provided ICT direction and assurance, and delivered scientific information that underpins government policy.
Our areas of focus were to:
` provide trusted scientific services and technical advice to government agencies, industry and the community
` lead complex, multi-agency ICT programs and projects, manage ICT strategic sourcing and procurement arrangements, and facilitate engagement between the ICT industry and government
` deliver consolidated ICT infrastructure services for the Queensland Government, covering data centre, network, storage, data protection, and ICT platform and solution integration services
` deliver information brokerage solutions to customers in business and the community Australia-wide on a commercial basis
` provide corporate transactional and advisory services to more than 70,000 public servants across 25 Queensland Government departments and agencies.
Our key services were:
` Science delivery
` Strategic information and communication technology
` CITEC information and communication technology
` CITEC information brokerage
` Human resource (HR) services
` Finance services.
This service area was supported by the Queensland Government Chief Information Office (QGCIO) in providing independent, qualified advice to the Minister for Innovation, Science and the Digital Economy, and directors-general and agencies on ICT management and investment issues from a whole-of-government perspective.
2. Our service performance

211 JULY – 12 DECEMBER 2017
QGCIO supported government ICT investment by:
` delivering strategies, policies, standards and guidelines within the Queensland Government Enterprise Architecture (QGEA) governance framework to assist agencies to deliver quality frontline services
` providing formal advice on the governance and delivery approach of all significant ICT-enabled government initiatives to Cabinet, Cabinet Budget Review Committee, the Minister for ICT and delegates
` driving digital and ICT-enabled business transformation by developing targeted strategies, blueprints, business cases, evaluations, pilots and initial implementation
` improving whole-of-government cyber security capability
` ICT profiling that provides a cross-government view of ICT assets to support collaboration and provide evidence for future initiatives
` providing advice, analysis and intervention as appropriate on emerging day-to-day issues.
Our performance We improved services for government and contributed to the department’s strategic objectives and the whole-of-government direction.
The three strategic objectives that drove our achievements were:
1. Deliver the DIGITAL1ST strategy that set direction for the future of digital government in Queensland.
2. Maintain trust in government by supporting the protection of government digital assets and information and building cyber resilience.
3. Help government run more efficiently through high-quality advice, assurance and innovative government-to-government services.
We provided effective ICT services to other government agencies and corporate entities by:
` maintaining an availability rate of 99.95 per cent on over 22,569 network devices, 1,918 servers, 2,800kW of data centre power and 23 terabytes of secured internet data every day
` achieving ISO9001 Quality Management and ISO27001 Information Security Management Systems (Data Centres) recertification in October 2017, which are globally recognised best practice accreditations in information security services
` enabling more than 72 per cent of Queensland Magistrates Court claims documents to be filed electronically (eFiling)
` releasing the Queensland Information Technology Contracting (QITC) framework as the basis for all Queensland Government contracts to procure ICT products and services
` supporting 87 participants from across 10 agencies in the IT Graduate Program. From the 2017 ICT graduate intake, 31 graduates were recruited with 53 participants graduating from the 2016 intake.

22 DSITI FINAL REPORT
` publishing QGEA policy and frameworks on: — federated identity — collaboration workforce — information sharing authorising environment.
` facilitating and coordinating government events including: — CEO Challenge—sponsoring domestic and family violence — two Talk-it-Up industry sessions on Building Information Modelling (Department of Local
Government, Infrastructure and Planning) and Community Services Industry Alliance (Department of Communities, Child Safety and Disability Services).
We delivered cyber security services, capability and operations across government by:
` addressing emerging cyber security risks with the acquisition and implementation of a new application—aware firewall product—improving cyber resilience and protecting government data by alerting and blocking attacks in real time
` undertaking a service line review of Storage Services. This new and improved, utility-based service provides a superior level of performance and security and is expected to deliver significant value to Queensland Government clients
` successfully mitigating 20 high severity Denial of Service cyber-attacks and 19 medium severity attacks, preventing them from impacting Queensland Government services
` providing cyber security intelligence to Queensland Government by collecting and analysing an average of 400 million events per day from over 130 sources
` delivering a suite of whole-of-government cyber security protections and programs to increase capability and maturity across government.
We continued to deliver high-quality corporate services to other government departments by:
` collaborating with our customers to deliver a system upgrade to our shared modern, vendor-supported finance solution that is now operating on a rapidly scalable and secure infrastructure platform to more readily respond to customer demand
` completing the migration of an agency finance system to the shared modern finance solution, providing greater functionality including self-service capabilities
` implementing the legislative changes to allow Queensland public servants across our customer agencies the ability to choose an alternative superannuation fund provider
` explored the use of robotic process automation technology to support continued improvement in the quality and efficiency of business processes.
We continued to deliver high-quality scientific services to our customers by:
` establishing a new air-quality monitoring station at North Ward Townsville that will also be used for National Environment Protection Measure Performance monitoring
` initiating 12 projects under the Queensland Water Modelling Network that will improve the efficiency, productivity and visualisation of the water models used for the state’s water resource planning and delivery of the Reef Report Card
2. Our service performance

231 JULY – 12 DECEMBER 2017
` finalising and releasing land use mapping for the Mackay–Whitsunday NRM Region and progressing land use and land use change mapping for other Great Barrier Reef catchments
` delivering data that shows the spatial extent of bio-stock for Queensland crops and forest projects to support the national database of biomass resources in Queensland
` hosting two community forums at Eton State School following the delivery of an independent assessment by the Queensland Chief Scientist regarding flooding in the Sandy Creek Catchment.
We provided assurance and advice to significant Queensland Government initiatives by:
` managing oversight of all government ICT investment projects through a gated review assurance process
` providing expert advice on ICT investments worth more than $232 million to the Directors-General ICT Council
` overseeing the successful development and delivery of a commercialised mobile coverage application (SigMap) by FlowBiz, under the Advance Queensland Testing Within Government (TWiG) Program
` monitoring a pipeline of 242 initiatives as at December 2017, to assess requirement for independent investment review.
We developed, led and delivered significant Queensland Government initiatives. We:
` completed the second round of the TWiG program, working in collaboration with 11 SMEs to improve the positioning of their ICT products whilst addressing real business problems for Queensland Government
` continued implementation of the HRIS Program for the Public Safety agencies with the introduction of a modern and mobile recruitment, on-boarding and learning management solution for the 45,000 paid and volunteer workforce members of Queensland Fire and Emergency Services
` successfully piloted the new Smart Writ for eFiling documents in the County Court of Victoria
` developed a Queensland Government Data Sharing Implementation Framework by working closely with Data61 to determine the current capability of Queensland Government departments and agencies in Data Sharing and Analytics. A pilot of the Data Sharing and Analytics Platform was implemented and is being used for several Data Sharing and Analytics initiatives
` continued to co-invest in the Mobile Black Spot Program (MBSP) to deliver 144 new and improved mobile base stations and 78 small cells to communities across 54 local government areas. As at December 2017, 64 base stations and 40 small cells have been completed
` progressed the second trial of the shared connectivity initiative in Maroochydore. The initiative in Roma has been operational since July 2017. The initiative aims to reduce telecommunications costs, improve connectivity and increase collaboration for partner agencies.

24 DSITI FINAL REPORT
Performance reviewThe following service standards in the department’s Service Delivery Statements 2017–18 were used by the department and the government to assess the service area’s overall performance.
Service standard Notes2017–18 target/est.
2017–18 actual
Percentage of customers from other government agencies satisfied with the natural resource and environmental science services and information provided (overall satisfaction)
1, 2 >87% N/A
Percentage of laboratory tests completed and made available within agreed timeframes and quality specifications to support the Reef 2050 Water Quality Improvement Plan and other government priorities
3 >87% 92%
Co-investment as a percentage of the Science Delivery budget 4 >25% N/A
Percentage of whole-of-government spend awarded to small to medium-sized enterprises (transactions over $10,000)
5 >16% 20%
Operating cost per $1,000 of managed spend on ICT goods and services 6 <$20 $17
CITEC ICT customer satisfaction 2, 7 >70% N/A
CITEC ICT earnings before interest and tax less depreciation and amortisation (EBITDA) 8 ($2.373m) $1.429m
CITEC IB customer satisfaction 2, 9 >80% N/A
CITEC IB earnings before interest and tax less depreciation and amortisation (EBITDA) 10 ($3.707m) $0m
Percentage of payroll services delivered within service agreement standards 11 >97% 100%
Client satisfaction with HR services 2, 12, 13
80% N/A
Number of pays processed per full-time equivalent per fortnight 14 >350 302
Percentage of finance services delivered within service agreement standards 11, 15 >95% 71%
Client satisfaction with finance services 2, 16, 17
80% N/A
Number of accounts payable transactions processed per FTE per annum 18 >7500 9459
Notes
1. This measure is an indicator of the success of delivering Science Delivery services to meet the key priorities of other government departments for environmental and natural resource policy and decision-making.
2. Result for this measure is not available for inclusion in the final report as the annual survey was not undertaken during the reporting period. The actual result is expected to be published in Service Delivery Statements 2018–19 and/or Annual report 2017–18 of the respective receiving agencies.
3. Measure description has been updated to reflect changes to policy documents. Methodology to calculate the result remains unchanged. The timeframes involved are negotiated per sample submission and quality is measured by maintenance of accreditation with the National Association Testing Authorities (NATA) Australia and performance in national and international laboratory proficiency trials. To maintain accreditation, the DSITI Chemistry Laboratory is required to constantly review processes and procedures. This process ensures that clients receive best practice service delivery. The actual result is reported as at 19 December 2017.
4. The measure is an indicator of efficiency in delivering services for government and external customers by maximising financial resources through leveraging and partnering. Appropriated funding is leveraged by performing fee-for-service activities for other state government agencies and by partnering with external organisations including universities and other scientific organisations. Result for this measure is not available for inclusion in the final report for the reporting period between 1 July and 12 December 2017, as the data is collected annually. The actual result is expected to be published in Service Delivery Statements 2018–19 and/or Annual report 2017–18 of the respective receiving agencies.
2. Our service performance

251 JULY – 12 DECEMBER 2017
5. This measure assesses the ongoing effectiveness of the ICT SMEs participation scheme policy by measuring the percentage of whole-of-government spend on transactions over $10,000 awarded to SMEs for ICT products and services. The ICT SME participation scheme policy ensures effective engagement with the ICT industry and specifically with SMEs by ensuring departments adopt a consistent procurement process. The actual result is reported as at 12 December 2017.
6. This cost efficiency measure was introduced in Service Delivery Statements 2017–18. The positive result is due to lower than anticipated expenditure for professional services by the Government Wireless Network Contract Directorate and lower than anticipated employee expenses within ICT Strategic Sourcing. The actual result is reported as at 12 December 2017.
7. This measure shows the percentage of customers satisfied with CITEC ICT’s service and is calculated using an overall customer satisfaction question.
8. This measure shows the net income with interest, taxes, depreciation and amortisation added back to the operating position, effectively eliminating the effects of financing and accounting decisions for CITEC ICT. CITEC ICT’s 2017–18 EBITDA position is better than target/estimate and is mainly due to efficiency measures that have lowered anticipated expenditure. The actual result is reported as at 12 December 2017 .
9. This measure shows the percentage of customers satisfied with CITEC Information Brokerage’s service and is calculated using an overall customer satisfaction question. The customer satisfaction survey is conducted yearly; the 2017–18 survey will be conducted March–April 2018.
10. This measure shows the net income with interest, taxes, depreciation and amortisation added back to the operating profit, effectively eliminating the effects of financing and accounting decisions for CITEC Information Brokerage. CITEC Information Brokerage’s 2017–18 actual result is reported as at 12 December 2017 and is better than the target/estimate primarily due to higher revenues due to successful retention of key customers.
11. QSS service agreements contain performance standards on which QSS delivers agreed services to customer agencies. The actual result is reported as at 31 December 2017.
12. HR services comprises payroll and non-payroll services such as recruitment, establishment management, case management and workforce consultancy services.
13. This measure is derived from the results of an external customer survey completed by a third party organisation. No external survey was undertaken in the reporting period. Internal pulse surveys were sent to customers who use HR services each month and QSS achieved 74.15% with 1416 surveys being completed.
14. This measure is an indicator of productivity. The actual result is below target. A number of HR/payroll projects were delivered during the reporting period. The parallel delivery of key projects and fortnightly services has required resourcing to be maintained at original levels, e.g. to allow for training of staff and to undertake user acceptance testing, resulting in less pays processed per FTE. The actual result is reported as at 31 December 2017.
15. The actual result is below target although the majority of finance services were delivered within service agreement standards. Services relating to vendor and customer master data were delivered outside of target. Additional controls were added for vendor master data changes. QSS is collaborating with agencies to review workload distribution and use of shared resources. The actual result is reported as at 31 December 2017.
16. Finance services include accounts payable, accounts receivable, operational procurement, corporate card administration, and general ledger reconciliation and taxation services.
17. This measure is derived from the results of an external customer survey completed by a third party organisation. No external survey was undertaken in the reporting period. Internal pulse surveys were sent to customers who use finance services each month and QSS achieved 80.5% with 610 surveys being completed.
18. The result indicates that performance improved incrementally over the past two years due to increasing uptake of eforms. The actual result is reported as at 31 December 2017.

26 DSITI FINAL REPORT
2. Our service performanceOther whole-of-government plans and specific initiativesDSITI was responsible for the following whole-of-government programs, plans and initiatives.
Strategies and plans ` Advance Queensland
` Advance Queensland Engaging Queenslanders in Science Strategy
` DIGITAL1ST: Advancing our Digital Future
` ICT Industry Engagement Action Plan
` One-Stop Shop Plan 2013–18
` 1 William Street ICT Blueprint, adapted into a Collaborative Workspace Strategy and Principles artefact to support the whole-of-government move to greater workforce mobility.
Programs ` Small Business Innovation Research program rollout: identifying innovative solutions for complex
challenges from across the Queensland Government and enabling innovation in government services
` Digital Archiving program
` 1 William Street ICT program: delivered new ICT infrastructure to the building
` Human Resources Information System (HRIS) program: took over management of the cross-agency initiative
` Testing Within Government (TWiG) program: managed and delivered the program and expanded it across government
` Accelerating Science Innovation (ASDI): a five-year program to transform delivery of scientific insight and data to underpin government policy and delivery
` Queensland Water Modelling Network: established a network to improve the efficiency, productivity and visualisation of government water models.
Initiatives ` Queensland Government’s First World War centenary commemorations: supported by working
with the ANZAC Centenary Committee and State Library of Queensland
` Queensland Information Technology Contracting (QITC) framework: engaged with industry to design ways to make it easier for government and industry to do business.
DSITI also supported the following whole-of-government plans and initiatives:
` Reef 2050 Water Quality Improvement Plan
` Great Barrier Reef 2050 Long-Term Sustainability Plan
` State Disaster Management Plan
` Queensland Biofutures 10–Year Roadmap and Action Plan
` Queensland Biofuels Mandate
` State of the Environment Report

271 JULY – 12 DECEMBER 2017
` Climate Transition Strategy
` Queensland Climate Adaptation Strategy
` National Research Infrastructure Roadmap
` Biomedical and Life Sciences Roadmap
` Electric Vehicle Strategy
` Innovation and Science Australia 2030 Strategic Plan
` Red Tape Reduction Advisory Council Report—Queensland Government Response and Action Plan
` Queensland: an age-friendly community action plan
` State Infrastructure Plan
` Queensland Housing Strategy 2017–20
` Logan Together initiative.

28 DSITI FINAL REPORT
Our leaders
Jamie Merrick Director–General
Appointed as Director-General in March 2016
Under the Financial Accountability Act 2009, the Director-General was accountable to the Minister for Innovation, Science and the Digital Economy and Minister for Small Business for the efficient, effective and financially responsible performance of the Department of Science, Information Technology and Innovation.
As Director-General, Jamie was responsible for ensuring the department:
` implemented the Queensland Government’s Advance Queensland initiative
` drove cross-government digital economy and ICT initiatives
` delivered customer-focused citizen services
` provided ICT investment and policy advice
` delivered scientific, ICT infrastructure, finance and human resource services to government departments.
Andrew Mills Queensland Government Chief Information Officer
Commenced as Queensland Government Chief Information Officer in January 2014
Andrew provided strategic advice to the Minister for Innovation, Science and the Digital Economy and Minister for Small Business—and agencies—on the best way for the government to use information and technology to deliver improved services to Queenslanders and drive efficiencies through new business models.
Andrew supported the Minister, Director-General and Directors-General ICT Council to:
` provide assurance and increased transparency over ICT investment
` progress investigations that assess government and market readiness of new initiatives
` explore the adoption of emerging technologies to improve the business of government
` improve government information security.
3. Our governance

291 JULY – 12 DECEMBER 2017
Dr Mark Jacobs Acting Assistant Director–General Science
Commenced as Acting Assistant Director–General in July 2017
Dr Jacobs led the Science division, which provided scientific and technical advice and services to government agencies to underpin their decision-making and legislative responsibilities.
The division, in close collaboration with the Queensland Chief Scientist, informed the Queensland Government’s science policy and provided strategic leadership for the government’s investment in science.
Dallas Stower Assistant Director–General Strategic ICT
Commenced as Assistant Director-General in May 2014
Dallas led the development and implementation of initiatives that strengthened Queensland’s ICT service delivery, including the Government Wireless Network and ICT shared services for the 1 William Street building.
He was responsible for ICT Strategic Sourcing, CITEC, Strategic ICT Projects and liaison with the ICT industry in relation to government procurement.
Dallas implemented complex ICT projects with a focus on transitioning whole-of-government services, and drove partnerships and collaboration with government and industry to achieve quality ICT outcomes across the public sector.
Andrew Spina Assistant Director–General Digital Productivity and Services
Commenced as Assistant Director-General in April 2012
Andrew was responsible for the areas of Digital Economy and Productivity, One-Stop Shop, Smart Service Queensland and the Queensland State Archives.
Andrew focused on using digital services to support improved customer service delivery, government efficiency and industry productivity.
Irene Violet Assistant Director–General Queensland Shared Services
Commenced as Assistant Director-General in July 2016
Irene was responsible for overseeing the payroll, HR and finance processes and systems for Queensland Shared Services customers.
Irene was focused on optimising the government’s core finance and payroll systems to deliver more contemporary, intuitive, self-service and automated capabilities to client departments and agencies.

30 DSITI FINAL REPORT
Paul Martyn Deputy Director–General Strategy and Innovation
Commenced as Deputy Director-General in December 2015
Paul’s responsibilities spanned innovation policy and insights, innovation programs and partnerships, and strategy and governance.
Paul was responsible for:
` further developing and delivering the Advance Queensland initiative
` influencing national and state policies, programs and regulations to ensure they best contribute to a thriving innovation system in Queensland
` strengthening the unique role that DSITI can play in whole-of-government policy design and implementation
` promoting innovation across government
` departmental strategic and business planning.
Evan Hill Deputy Director–General Corporate
Commenced as Deputy Director-General in February 2014
Evan was responsible for the strategic leadership of the department’s corporate services—including finance, human resources, the Digital Enterprise Office, procurement, communications and engagement, legal, privacy, integrity services, corporate reporting, change management and risk management.
Dr Christine Williams Acting Queensland Chief Scientist
Commenced as Acting Queensland Chief Scientist in July 2017
Dr Williams provided leadership in science policy development and implementation and provided high-level, strategic advice to the Queensland Government on the role of science, research and innovation in meeting Queensland’s economic, social and environmental challenges.
The Queensland Chief Scientist is a whole-of-government position that also provides advice on maximising opportunities from the government’s investment in research and development.
Governance framework The Board of Management (BoM) was the department’s principal policy-setting and decision-making authority. It supported the Director-General as the department’s accountable officer to ensure the department implements and operates within an appropriate governance framework.
Corporate governance arrangements were based on the principles of best practice outlined in the Public Sector Governance: Better Practice Guide, the Australian Public Service Commission’s Building Better Governance Guide and by the Australian Audit Office.
3. Our governance

311 JULY – 12 DECEMBER 2017
The leadership and accountability model was part of the department’s corporate governance framework and illustrated the accountability mechanisms in place to effectively control business activities.
BoM worked collectively to:
` set agency strategy, objectives and priorities
` develop our agency and workforce capabilities
` increase and harness the diversity of our workforce
` drive innovation across the agency and through our partnerships
` oversee the implementation of programs and policies
` monitor performance and reporting requirements
` scrutinise risk mitigation strategies
` review recommendations implemented from management and audit reports to improve business processes and work practices.
BoM, one governance committee and three sub-committees supported the Director-General in the effective discharge of legislative accountabilities. They also provided opportunities for developing leaders to promote a performance culture and facilitated relationship-building and communication.
Our leadership and accountability model
Minister for Innovation Science and the Digital Economy and Minister for Small Business
Director-General
Information Steering
Sub-Committee
Finance and Procurement
Sub-Committee
Central agencies PSC/DPC/Treasury
Cabinet objectives/w-o-g policy/service charters
Executive Council Administrative arrangements
Parliament of Queensland Legislative and regulatory requirements
Audit and Risk Management
Committee
Internal Audit reports directly to Deputy Director-
General, Corporate
CEO accountabilities
Governance committees
People Sub-Committee
Board of Management
Direct report
Informs

32 DSITI FINAL REPORT
3. Our governanceOur committees
Board of Management (BoM)
` Director-General (Chair) ` Deputy Director-General, Corporate ` Deputy Director-General, Strategy and Innovation ` Queensland Government Chief Information Officer ` Assistant Director-General, Science ` Assistant Director-General, Digital Productivity and Services ` Assistant Director-General, Strategic ICT ` Assistant Director-General, Queensland Shared Services ` Chief Finance Officer ` Chief Information Officer ` Chief Human Resources Officer ` Executive Director, Communications and Engagement ` Senior Director, Office of the Director-General.
BoM met weekly and was the primary governance body for DSITI.
As well as decision-making responsibilities, BoM was informed about sub-committee outcomes to facilitate effective corporate governance.
An organisational governance and performance reporting meeting was held each quarter, with additional attendees:
` Director, Internal Audit ` Director, Strategic Governance, Performance and Reporting
Audit and Risk Management Committee (independent of BoM)
` Director-General ` Deputy Director-General, Corporate ` Assistant Director-General, Queensland Shared Services
External members: ` Partner, Risk Advisory Services, BDO (Qld) Pty Ltd (Chair)—paid as per agreed rates ` Deputy Director-General, Corporate Services, Department of Communities,
Child Safety and Disability Services.
For the period 1 July to 12 December 2017, the committee met on two occasions, once for a general meeting and once for a special meeting to discuss financial statements. Total remuneration paid for this period was $7,500 (ex-GST) to one external member.
The Audit and Risk Management Committee was an independent advisory body directly responsible to, and supporting, the Director-General. It assisted the Director-General to effectively discharge his legislative accountabilities under the Financial Accountability Act 2009 and the Financial and Performance Management Standard 2009 (FPMS).
The committee observed the terms of its approved charter and had due regard to Queensland Treasury’s Audit Committee Guidelines.

331 JULY – 12 DECEMBER 2017
The committee provided independent assurance and assistance to the Director-General on:
` risk management, internal control and compliance frameworks ` financial statements ` internal audit and external audit matters ` performance management ` client agency assurance reporting.
The committee did not replace nor replicate established management responsibilities and delegations, the responsibilities of other executive management groups within DSITI, or the reporting lines and responsibilities of either internal audit or external audit functions.
Information Steering Sub-committee (ISC)
` Deputy Director-General, Strategy and Innovation (Chair) ` Deputy Director-General, Corporate ` Assistant Director-General, Strategic ICT ` Assistant Director-General, Science ` Assistant Director-General, Digital Productivity and Services ` Assistant Director-General, Queensland Shared Services ` Queensland Government Chief Information Officer ` Chief Information Officer ` Chief Finance Officer ` Chief Human Resources Officer
External member: ` Group CIO, Youi Insurance.
The sub-committee met every eight weeks as a sub-committee of BoM.
The primary functions of the ISC included: ` providing strategic oversight and direction to the department’s portfolio of ICT
investments ` ensuring appropriate controls and governance exist for the various ICT
programs and projects managed within the department ` approving the department’s ICT strategy and objectives in support of the ICT
Strategic Plan ` assessing and determining investment priorities for programs, projects and
corporate ICT service activities, based on their alignment with strategic objectives ` reviewing performance of the portfolio of ICT programs and projects to ensure
progress is appropriate, all risks and issues are identified and addressed, and benefits are identified and monitored
` endorsing and monitoring ICT and information management-related departmental policies, standards and guidelines
` assuring that service performance standards of ICT operation are efficient, effective and economical, and meet the department’s business requirements.

34 DSITI FINAL REPORT
Finance and Procurement Sub-comittee
` Assistant Director-General, Strategic ICT (Chair) ` Deputy Director-General, Corporate ` Deputy Director-General, Strategy and Innovation ` Assistant Director-General, Queensland Shared Services ` General Manager, Smart Service Queensland ` Executive Director, Science Delivery ` Principal Architecture Consultant, Queensland Government Chief Information
Office ` Chief Finance Officer ` Chief Procurement Officer.
The sub-committee met each month to provide assurance about the effective financial and procurement management of the department, which included:
` consideration of financial performance ` procurement priorities and commitments ` financial and procurement policies and procedures ` budget submissions ` procurement plans and implications ` resourcing issues.
People Sub-committee
` Assistant Director-General, Queensland Shared Services (Chair) ` Deputy Director-General, Corporate ` Chief Human Resources Officer ` Executive Director and State Archivist, Queensland State Archives ` Executive Director, Innovation, Policy and Governance ` Executive Director, Science Development ` General Manager, CITEC ICT ` Executive Director, Queensland Government Chief Information Office.
The sub-committee met every six weeks to ensure a strategic whole-of-department focus in relation to human resource management and workplace health and safety.
3. Our governance

351 JULY – 12 DECEMBER 2017
Audit arrangementsInternal Audit was a key component of DSITI’s corporate governance, providing independent assurance and advisory services to the Director-General and the Audit and Risk Management Committee (ARMC). These services used a systematic, disciplined approach to evaluate and improve the effectiveness of risk management, internal controls and governance activities within the department.
Internal Audit operated under the powers pursuant to section 61 of the Financial Accountability Act 2009 and its approved charter that incorporates the internal audit professional standards. Due regard was also given to Queensland Treasury’s Audit Committee Guidelines (June 2012) and the Institute of Internal Auditors’ Internal Professional Practices Framework (IPPF).
The ARMC monitored the internal audit function to ensure it operated ethically and professionally.
The Internal Audit unit, together with its co-source internal audit partner (KPMG), focused on delivering a high-quality, professional internal audit function and on completing the annual internal audit program of work.
During the period 1 July to 12 December 2017, Internal Audit:
` developed a comprehensive, risk-based strategic internal audit plan and annual internal audit plan, approved by the Director-General
` executed the annual internal audit plan that covered key financial controls, major systems, project management and operations
` reported on the results of assurance and advisory reviews to the ARMC and Director-General
` monitored and reported on the implementation status of internal audit recommendations.
Risk managementThe DSITI Risk management policy and framework, based on the international risk management standard AS/NZS ISO 31000:2009 and Queensland Treasury’s A guide to risk management, ensured risks were managed consistently across the department and minimised through a robust system of internal controls. The framework encompasses threats and opportunities, reflecting the potential for either of these to impact positively or negatively on the department’s objectives, strategic priorities and innovation.
Internal Audit’s Risk management report was approved on 13 October 2017. Work commenced to address the recommendations, which included a review to deliver better value to DSITI through a reformed internal audit, assurance and risk management function.
The ICT Risk, Business Continuity Planning and Disaster Recovery Working Group, established as part of the federated operating model, continued to develop its ICT risk reporting approach to enhance decision-making around DSITI’s strategic and systemic ICT risks.
BoM was appraised of the department’s business continuity and disaster preparedness for the 2017–18 storm season on 17 November 2017.

36 DSITI FINAL REPORT
External assuranceIn the period 1 July to 12 December 2017:
` no reports that mentioned the department were tabled in Parliament by the Queensland Audit Office
` no external scrutiny was undertaken.
Information systems and knowledge managementDSITI’s Digital Enterprise Office developed recordkeeping policy and provided several services to DSITI business units. These included advice and guidance on appropriate recordkeeping practices. A communication, awareness and training program was developed to keep educating staff about records and records management.
To enable a collaborative and consistent approach to recordkeeping across the department, an Information Management and Records Working Group was established under the department’s new Federated ICT operating model. The working group included representatives from all business units. This enabled broader support for records management initiatives and for increased records management expertise and knowledge to be shared across the department.
With the move to 1 William Street and many staff relocating to Terrica Place, paper-reduction initiatives and practices continued to be a focus in day-to-day work practices. The Digital Enterprise Office continued to drive the department towards a digital workplace by investigating requirements for digitising paper and manual processes, including whole-of-department cloud-based technology to support digital records management. DSITI also leveraged productivity tools to enable greater access to information anywhere and anytime, and for staff collaboration across the department.
3. Our governance

371 JULY – 12 DECEMBER 2017
4. Our peopleIn DSITI, our People Compass helped navigate our people-first journey.The compass guided us in being an organisation that innovates, solves problems and values diversity of thought—helping us to be agile and able to change tack, based on where we are, where we need to go and the challenges ahead.
As an integrated program of work, the People Compass leveraged the talents, potential and performance of our 2584.52 employees. Together, we delivered a better Queensland through science, innovation and technology.
There were five compass points that represented who we are and what we do.
1. Deliver better leadership
2. Strengthen performance and connection
3. Invest in and value our diverse workforce
4. Transition to the workforce of tomorrow
5. Innovation leadership.
1. Deliver better leadership‘Deliver better leadership’ was about building a sustainable pipeline of diverse, inspiring and innovative change leaders through prioritised initiatives that create leaders at all levels.
Leadership program
Following on from our targeted leadership program launch in 2016–17, 13 high performing, high-potential AO8s and SOs participated in the program which included 360-degree capability assessments, face-to-face group workshops, individual and peer coaching.
Building foundational management skills
Our pipeline of job-ready future leaders helped build leadership capability for the sector. During the reporting period, the department commenced exploring progressive development options for its emerging supervisors and managers.
2. Strengthen performance and connectionStrengthening performance and connection was about ensuring everyone shared a passion and knew what actions would help achieve our goals.
Employer brand
DSITI continued to attract job seekers’ interest through advertising roles on our LinkedIn company profile. Between January and December 2017, the department achieved 182,067 job impressions, 7342 job views and 987 job application clicks. LinkedIn was used to support recruitment strategies for executive roles as well as critical and difficult to fill positions.

38 DSITI FINAL REPORT
Working for Queensland results
Each year, the department participated in the sector-wide Working for Queensland employee opinion survey to measure people’s perceptions of their work, manager, team and organisation. The 2017 survey ran in August, with results available in September 2017. Eighty per cent of our people—2189 in total—shared their thoughts and opinions on their employee experience within the department.
Top 2017 results compared to 2016
The following summary details the key result areas and improvement in performance compared to 2016:
` +6% positive change in agency engagement which measured the positive regard that people hold for the agency
` +6% positive change in organisational leadership which measured people engagement with the leaders of the organisation and the work they do
` +3% positive change in innovation which measured the extent to which people feel the organisation is willing to continuously improve.
The six per cent increases in both agency engagement and organisational leadership were amongst the largest increases across the Queensland public sector.
In addition to these core measures, we maintained a strong awareness of our domestic and family violence policies and support approaches (91 per cent). This aligned with the work the department focused on to become a White Ribbon Accredited Workplace.
Performance management
Performance underpins our services to government and to Queenslanders—it is central to all we do.
We developed new tools and support mechanisms, including an easy-to-use conversation guide, helping employees and managers to have productive and regular performance conversations as part of their day-to-day work.
We prototyped a new approach to performance conversations, including play-testing a gamification tool supporting more frequent and value-added discussions between managers and employees about their performance and development. Feedback and refinements from the prototype will be shared with other public sector agencies who are interested in innovative solutions for improving performance and development.
Industrial and employee relations framework
We had a robust industrial and employee relations framework underpinned by the Industrial Relations Act 2016 and associated instruments:
` Queensland Public Service Employees and Other Employees Award—State 2015 ` Civil Construction, Operations and Maintenance General Award—State 2016 ` State Government Entities Certified Agreement 2015 ` CITEC Certified Agreement 2016.
We continued our joint departmental–union consultative committee for the department, as well as divisional committees in Queensland Shared Services, Smart Service Queensland and CITEC. These committees are the primary ways to engage with unions on industrial relations matters, including workplace change.
4. Our people

391 JULY – 12 DECEMBER 2017
3. Invest in and value our diverse workforceWe continued our work in fostering a workplace culture that supported learning, diversity of thought and helped us to manage our health and wellbeing.
Diversity of thought, experience and opinion set our department apart. This year we developed the Diversity and Inclusion Strategy 2017–19, which outlined a two-year program of work, focused on six core workforce groups:
` gender equity ` Aboriginal and Torres Strait Islander employees ` employees with a disability ` employees from a non-English speaking background ` employees who identify as LGBTIQ+ ` multi-generational workforce.
The focus was on building gender equity across the department, with a focus on women in leadership; and improve and sustain Aboriginal and Torres Strait Islander workforce participation.
Supporting gender equity
Women in leadership positions of Senior Officer and above grew four per cent in the reporting period.
Diversity statistics for the reporting period 1 July to 8 December 2017:Aboriginal and Torres Strait Islander peoples . . . . . . . . . . . . . . . . . . . . 1.35%People with a disability . . . . . . . . . . . . . . . . . . . . . . . . . . . . . . . . . . . . . . 3.30%Non-English speaking background . . . . . . . . . . . . . . . . . . . . . . . . . . . . 15.21%Women in the workforce . . . . . . . . . . . . . . . . . . . . . . . . . . . . . . . . . . . . 57.42%Women in senior leadership roles (CEO, SES, SO) . . . . . . . . . . . . . . . . 40.79%Women in leadership roles (AO8, AO7, AO6, PO6, PO5 and equivalent) 44.96%EEO survey completion . . . . . . . . . . . . . . . . . . . . . . . . . . . . . . . . . . . . . 76.0%
Women in Leadership mentoring program
During the reporting period, the department launched a new gender equity in leadership initiative—a Women in Leadership mentoring program. This program matched 20 mentoring pairs together, with both men and women leaders mentoring emerging and future women leaders. This program had mentors from all levels of leadership in the department, from our BoM members to middle managers. All were focused on building confidence, capability and capacity in emerging leaders.
Improving our cultural capability and workforce participation of Aboriginal and Torres Strait Islander peoples
Building our cultural capability as a department continued to be an area of focus, with an increased effort on improving workforce participation.
We actively worked with the Wujal Wujal community leaders to support their roles within a changing and emerging community.

40 DSITI FINAL REPORT
Throughout the year, we continued to deepen our connection to the Aboriginal and Torres Strait Islander communities, through our participation in events such as NAIDOC Week. These events strengthened our position as an emerging employer of choice for Aboriginal and Torres Strait Islander peoples.
We launched our second Aboriginal and Torres Strait Islander internship program. This was a 12-week paid internship program that provided university students with real work experience in our department. Thirteen interns participated, working in areas including the sciences, information technology, digital services, project management, strategic sourcing and human resources. The program represented an internship program increase of 53%, which assisted the department in building a sustainable pipeline of future leaders.
Ethics and Code of Conduct—supporting our employees to do the right things, right
We recognise that employment in the public service is a position of trust, and as such we hold ourselves and our colleagues to a high standard. The Code of Conduct for the Queensland Public Service was a key tool in setting the standards we upheld.
To ensure our people were aware of these standards, information about the Code of Conduct was provided to new employees as part of their induction. Our Code of Conduct e-learning module continued to be mandatory, with staff required to undertake an annual refresher.
Our policies and procedures were in line with the Code of Conduct and our ethics, principles and values. These supported our people to undertake their roles in an impartial and apolitical manner.
Our e-learning suite of programs helped equip our people with the knowledge and skills to do the right things, right.
These mandatory online training modules were delivered via our new learning management system, MyCareer. With annual completion required, the modules covered topics such as information security, information privacy, domestic and family violence, cultural capability, and fraud and corruption.
Health, safety and wellbeing
During the reporting period, there was an increased focus on health, safety and wellbeing with our action group of leaders from across the department continuing to support the implementation of our Health, Safety and Wellbeing Plan.
Key initiatives included:
` support for volunteering through promotion of employees who volunteer
` promotion of Red25 to support the Red Cross Blood Bank drives
` implementation of FinFit seminars in partnership with QSuper to support better financial fitness for our employees
` streamlining our WorkCover policies, from four policies to one
` embedding our refined medical case management processes, ensuring our employees are supported to remain at work or return to work as soon as possible after an injury or illness
` offering support services including counselling and support to all employees and their families, and a specialised professional case management service to support people affected by domestic and family violence
4. Our people

411 JULY – 12 DECEMBER 2017
` maturing our approach to identifying and managing health and safety risks across the department
` developing and launching a new mandatory e-learning module to support our people to better understand their obligations.
We collaborated, procured and developed a new full-service workplace health and safety system to enable better capturing, analytics and interventions.
Flexible working arrangements
We reaffirmed our commitment to providing working arrangements that supported our people to balance their professional and personal lives. During the reporting period we continued to promote flexible working arrangements. Information about flexible working options was promoted in job advertisements, at induction and throughout the employment lifecycle.
Our 2017 Working for Queensland survey results reflected this with an 18 per cent increase in employees accessing flexible working arrangements.
Taking a stand against domestic and family violence
Not now, not ever. We’re putting an end to domestic violence.
We were one of 15 Queensland Government agencies who achieved White Ribbon Workplace Accreditation, which focused on preventing violence against women.
In addition, the department was strongly focused on preventing violence of any kind. From our Working for Queensland results in 2017, we know 91 per cent of our people were aware of policies to support employees affected by domestic and family violence in the workplace and community.
As part of our commitment to promoting awareness of the White Ribbon cause, we raised $2,832.85 through various White Ribbon Day activities.
We continued to educate our leaders to support their people through any elements of domestic and family violence.
Hot Tasks—mobilising our people to where we need them
Hot Tasks helped our employees to build their skills and share their knowledge through short-term, on-the-job opportunities.
Developing our employees through a range of learning methods was important as we transition to the workforce of tomorrow. During the reporting period, we continued to mature our approach to internal talent mobility through our Hot Tasks initiative, for short-term, bite-sized work packages. Work opportunities of up to four weeks full-time or 150 hours were advertised on our corporate social network, Yammer, with interested employees opting to fill the task either from their primary work location, or to co-locate with the team needing help.
Hot Tasks helped our people build their skills through on-the-job learning, strengthened performance and connection across the department, and made sure we were moving resources, where and when they were needed.
Hot Tasks continued to help us deliver our priority projects while providing valuable on-the-job learning experiences.

42 DSITI FINAL REPORT
Recognising our people’s above and beyond efforts
Our ability to deliver was dependent upon our efforts. Our formal recognition programs included: ` Recognition of Excellence awards ` Public Service Medal ` Honours List ` Prime Minister’s Awards of Excellence ` divisional awards.
Appreciating and recognising the efforts of our people also occurred through informal channels and was an important part of our workplace culture.
4. Transition to the workforce of tomorrow Service evolution and digital disruption meant our leaders supported new ways and new opportunities to transition to the workforce of tomorrow.
Separations
During the period, one employee received a redundancy package at a cost of $73,453. This voluntary redundancy was employee-initiated. Employees who did not accept an offer of a redundancy were offered case management for a set period of time, where reasonable attempts were made to find alternative employment placements.
The permanent separation rate for the department for the reporting period was 2.80 per cent.
5. Innovation leadershipGrowing our own innovation ecosystem builds a workplace that ignites ideas and unleashes potential. The department worked collaboratively to remove red tape for its customers and for its people to build valued services.
Innovation arena
During the reporting period we again partnered with the Department of Natural Resources and Mines to run a collaborative innovative event—Innovation Arena.
Innovation Arena enabled employees to pitch clever solutions to complex business problems to the Directors-General. Shortlisted ideas proceeded through a 90-day sprint, resulting in working prototypes and proofs of concept.
Innovation Arena resulted in: ` participants testing proposals directly with Directors-General ` quick decisions being made about proceeding with ideas ` innovative project concepts being fast-tracked ` improved inter-departmental collaboration.
Eleven shortlisted projects benefited from departmental advice on subjects including in-house project management, sprint training and marketing.
4. Our people

431 JULY – 12 DECEMBER 2017
5. Our locationsFormer DSITI’s head office was located at 1 William Street, Brisbane. Other offices and service areas were located in the Brisbane CBD and greater Brisbane area, and in major regional centres across Queensland including Cairns, Townsville, Rockhampton, Maroochydore, Robina and Toowoomba. CITEC had one interstate location (Melbourne).
Our services to Queenslanders were complemented by the existing Queensland Government Agency Program (QGAP), which supports multi-agency service delivery in regional and rural areas across the state.
Division Address
Brisbane
Corporate Brisbane, 140 Creek Street
CITEC Brisbane, 317 Edward Street Railway 1D
Ipswich, Springfield DATA Centre I (Polaris)
Brisbane, 140 Creek Street
Digital Productivity and Services Brisbane, 140 Creek Street
Office of the Director-General Brisbane, 1 William Street
Office of the Queensland Chief Entrepreneur Fortitude Valley, The Precinct, 315 Brunswick Street
Office of the Queensland Chief Scientist Brisbane, 111 George Street
One-Stop Shop Strategy and Implementation Office Brisbane, 140 Creek Street
Queensland Government Chief Information Office Brisbane, 111 George Street
Queensland Government Service Centre Brisbane, 33 Charlotte Street
Queensland Shared Services Brisbane, 140 Creek Street
Woolloongabba, 411 Vulture Street
Woolloongabba, 897 Main Street
Queensland State Archives Runcorn, 435 Compton Road
Science Dutton Park, Ecosciences Precinct, 41 Boggo Road
Toowong, Queensland Herbarium, Mount Coot-tha Road
Deagon, Coastal Impacts Unit, Queensland Government Hydraulics Laboratory, 27 Quinlan Street
Smart Service Queensland Brisbane, 127 Creek Street
Smart Service Queensland (contact centres) Mt Gravatt, Garden Square Block B, Kessels Road
Zillmere, Pineapple Street
Strategic ICT Brisbane, 140 Creek Street
Strategic Policy and Innovation Brisbane, 140 Creek Street

44 DSITI FINAL REPORT
Division Address
Regions
Digital Economy and Productivity Rockhampton, 209 Bolsover Street
Toowoomba, 100 Bridge Street
Townsville, 455 Flinders Street
Queensland Government Service Centre Cairns, 5B Sheridan Street
Maroochydore, 12 First Avenue
Queensland Shared Services Cairns, 5B Sheridan Street
Gympie, corner Louisa Street and Cartwright Road
Maroochydore, 12 First Avenue
Robina, corner Christine Avenue and Scottsdale Street
Rockhampton, 80-82 Denham Street
Toowoomba, 532 Ruthven Street
Townsville, 187 Stanley Street
Science Smithfield, Australian Tropical Herbarium, JCU Cairns Campus, McGregor Road
Interstate
CITEC Melbourne, 256 Queen Street
5. Our locations

451 JULY – 12 DECEMBER 2017
Queensland Government Agent Program (QGAP) officesSmart Service QGAP offices are in regional centres:
Agnes Water
Aramac
Augathella
Ayr
Babinda
Barcaldine
Beaudesert (QGCC)
Bedourie
Biloela
Birdsville
Blackall
Blackbutt
Boonah (QGCC)
Boulia
Camooweal
Cannonvale
Childers
Clermont
Collinsville
Cooktown
Crows Nest
Croydon
Cunnamulla
Dirranbandi
Eidsvold
Gatton (QGCC)
Gayndah
Georgetown
Goombungee
Herberton
Hughenden
Ingham
Inglewood
Injune
Isisford
Jandowae
Julia Creek
Jundah
Kilkivan
Laidley
Lowood
Malanda
Maleny
Mary Valley
Middlemount
Miles
Mirani
Mitchell
Monto
Moranbah
Mossman
Mount Garnet
Mount Morgan
Moura
Mundubbera
Murgon
Nanango
Normanton
North Stradbroke Island
Pittsworth
Quilpie
Ravenshoe
Richmond
Sarina
Springsure
St George
Stanthorpe
Surat
Tara
Taroom
Texas
Thargomindah
Toogoolawah
Tully
Wandoan
Weipa
Windorah
Winton
Yarrabah
Yeppoon
QGCC: Queensland Government Customer Centre

46 DSITI FINAL REPORT
6. Our financial performanceSummary of financial performanceThis financial summary provides an overview of the department’s financial performance for 2017–18 financial year to 12 December 2017. A comprehensive view of the department’s financial performance is provided in the Financial Statements included in Part B of this annual report.
Financial performanceTable 1: Summary of financial results of the department’s operations
Category 2017 Actual $M 2018 Actual $M
Total income $636.4M $291.0M
Total expenses $632.5M $290.6M
Operating result $3.9M $0.4M
Operating result
The operating surplus of $0.4 million before income tax for the period ended 12 December 2017 is due to Queensland Shared Services’ (QSS) operating surplus of $1.3 million offset by CITEC’s operating deficit of $0.9 million.
Income
Income for the department totalled $291.0 million for 2017–18 and is lower than the prior year due to the abolishment of the department on 12 December 2017.
Other revenue, interest and gains $2.6M (1%)
Grants and other contributions $8.3M (2%)
2018 Income ($291.0 million)
User charges and fees $135.2M (46%)
Appropriation revenue $144.8M (50%)

471 JULY – 12 DECEMBER 2017
Total appropriated services revenue for the period was $144.8 million, and the department operated within its appropriated budget during this period. Total user charges and fees received for the period was $135.2 million, which was primarily derived through Information and Communication Technology services by CITEC, services by Smart Service Queensland, and corporate services (including Finance and Payroll support) by the department’s shared service provider, QSS.
User charges and fees are the other main sources of income for the department at 46 per cent of the total. They are generated from a variety of activities, with the main clients being other Queensland Government departments.
Expenses
2018 Expenditure ($290.6 million)
Supplies and services $127.4M (44%)
Employee expenses $117.6M (40%)
Other expenses $2.3M (1%)
Finance and borrowing costs $2M (1%)
Depreciation and amortisation $12.9M (4%)
Grants and subsidies $28.3M (10%)
Impairment losses $0M (0%)
Expenses for the department totalled $290.6 million for 2017–18 and is lower than the prior year due to the abolishment of the department on 12 December 2017.
Supplies and services are the department’s major expense component at 44 per cent closely followed by employee expenses at 40 per cent. Supplies and services include service delivery expenses relating to ICT (including the Government Wireless Network) and shared service providers.
The department’s expenditure by service area (excluding eliminations) is shown below with Services for Government being the major category. Services for Government includes ICT services (including the Government Wireless Network, the Human Resources Information System and CITEC), Science Delivery and QSS.

48 DSITI FINAL REPORT
6. Our financial performanceExpenditure by Service Area
Corporate $19.1M (6%)
Services for Queenslanders$46.2M (15%)
Advancing Queensland through innovation $33.8M (11%)
Services for Government $216.1M (68%)
Financial position
The net assets position reported in the financial statements shows the net worth of the department. As at 12 December 2017, this was $137.1 million. Table 2 summarises the department’s financial position for 2017–18 and 2016–17.
Table 2: Summary of financial position – assets and liabilities
Category 2018 Actual $M 2017 Actual $M
Total assets $322.5M $328.5M
Total liabilities $185.4M $189.8M
Total equity $137.1M $138.7M
Assets
As at 12 December 2017, the department’s total assets was $322.5 million and the department held $217.2 million in property, plant and equipment, and intangible assets. $118.3 million of the department’s assets are leased finance assets that relate mostly to the Government Wireless Network.
Liabilities
As at 12 December 2017, the department held liabilities totalling $185.4 million a decrease of $4.4 million compared to the prior financial year.
All liabilities recognised by the department are funded and no significant contingent liabilities exist as at 12 December 2017 in respect of the department’s activities.

491 JULY – 12 DECEMBER 2017
6. Our financial performanceAdministered
The department’s administered activities had an operating surplus of $1.4 million due to a contribution received in relation to the ICT arrangements for 1 William Street. The management of administered assets was consistent with departmental objectives. For more information, refer to the Schedule of Administered Items in Note 30 of Part B of this annual report.
Administered funds for 2017—18
Other $3.5M (9%)
Queensland Shared Services $2.4M (6%)
CITEC $3.6M (9%)
State Library of Queensland $29.4M (76%)
STATEMENT BY THE CHIEF FINANCE OFFICERIn accordance with the requirements of the Financial Accountability Act 2009, the Chief Finance Officer has provided the Director-General with a statement confirming that the financial internal controls of the department are operating efficiently, effectively and economically in conformance with Section 57 of the Financial and Performance Management Standard 2009.
The Chief Finance Officer has fulfilled the minimum responsibilities as required by the Financial Accountability Act 2009.

50 DSITI FINAL REPORT
7. Glossary of termsActs legislation that has been promulgated or enacted by the Queensland
Legislative Assembly and is therefore now law
Advance Queensland a comprehensive suite of programs, based on international evidence of 'what works', designed to create the knowledge-based jobs of the future. The program is managed by the Advance Queensland Implementation Unit
As-a-service a model where customers can purchase ICT solutions from a supplier without having to own or lease any of the associated equipment/software
Aurion payroll system
Cyber security protection of computer (both hardware and software) and information systems from theft, damage or disruption
Community Digital Champions
advocates of digital technologies within their local communities, appointed under Advance Queensland
Denial of service computer and information systems become unavailable for their intended use, either temporarily or indefinitely, due to a cyber attack
Digital adoption digital adoption is the use of digital solutions to enhance business or personal activities, through awareness of the technology, purchase and implementation, and integration of the solution
Digital capability an organisation’s capacity to use and respond positively to change in digital technology and services
Digital disruption the change that occurs when digital technologies and business models affect existing goods and services
Digital economy the global network of economic and social activities enabled by information and communications technologies such as the internet, mobile and sensor networks
Digital literacy the skills and ability to participate safely and securely, confidently and lawfully online to take full advantage of the opportunities available in the digital age
Digitally-driven digitally-driven organisations recognise the power, value and potential of their digital data and the need to create new forms of digital data
Digital technologies includes the internet, hardware and software applications, devices such as smart phones and tablets, wireless and satellite, electronics and sensors, transaction and trading platforms, and digital media and content. Other digital technologies include artificial intelligence and virtual reality, computer/machine vision, drones, geospatial, machine learning, additive and distributed manufacturing, natural language processing, next-generation robotics and speech recognition
e-learning electronic learning
Flickr image and video hosting website
Globalisation the process of international integration arising from the interchange of world views, products, ideas and other aspects of culture

511 JULY – 12 DECEMBER 2017
Hyper-connectivity a state of unified communications (UC) in which the traffic-handling capacity and bandwidth of a network always exceed the demand
One-Stop Shop a single point where customers can access a range of government services to ensure a better, more consistent customer experience for Queenslanders
Startup an entrepreneurial venture, which is typically a newly emerged, fast-growing business that aims to meet a marketplace need by developing or offering an innovative product, process or service
Startup Catalyst an initiative that takes groups of youths, startups, investors, corporates and innovation leaders to international startup hotspots to assist in the cultural transformation of the Australian economy to one that is fast paced, startup aware and ‘global first’
The Precinct Queensland Government-backed startup and innovation hub in Fortitude Valley
Acronyms13QGOV Queensland Government immediate
response phone number
AO Administration officer
ARMC Audit and Risk Management Committee
AS/NZS Australian/New Zealand standard
BoM Board of Management
CBD Central business district
CC Creative commons
CEO Chief Executive Officer
CIO Chief Information Officer
CITEC Centre for Information Technology and Communication
DSITI Department of Science, Information Technology and Innovation
FTE Full-time equivalent
GST Goods and services tax
HR Human resources
HRIS HR information system
ICT Information and communication technology
ISC Information Steering Sub-committee
ISO International Standard Organisation
JCU James Cook University
QAO Queensland Audit Office
QGCC Queensland Government Customer Centre
QGAP Queensland Government Agent Program
QGCIO Queensland Government Chief Information Office
QGEA Queensland Government Enterprise Architecture
QITC Queensland Information Technology Contracting framework
QSA Queensland State Archives
QSS Queensland Shared Services
SES Senior Executive Services
SLQ State Library Queensland
SME Small to medium enterprise
SO Senior Officer
SPI Strategic Policy and Innovation
SSQ Smart Service Queensland
TAFE Technical and Further Education
TWiG Testing within Government

52 DSITI FINAL REPORT
8. Compliance checklistSummary of requirement Basis for requirement Annual report reference
Letter of compliance A letter of compliance from the accountable officer or statutory body to the relevant Minister/s
ARRs–section 7 Letter to Minister Enoch
Accessibility Table of contents
Glossary
ARRs–section 9.1 Table of contents
Glossary of terms
Public availability ARRs–section 9.2 About our annual report
Copyright notice Copyright Act 1968
ARRs–section 9.4
p ii
Information licensing QGEA–Information licensing
ARRs–section 9.5
p ii
General information Introductory information ARRs–section 10.1 From the Director-General
Section 1–About the department
–Who we are
Agency role and main functions
ARRs–section 10.2 Section 1–About the department
Legislation administered by the department
Section 5–Our locations
Operating environment ARRs–section 10.3 Section 1–Our operating environment
Non-financial performance Government’s objectives for the community
ARRs–section 11.1 Our strategic objectives
Other whole-of-government plans/specific initiatives
ARRs–section 11.2 Section 2–Other whole-of-government plans/specific initiatives
Agency objectives and performance indicators
ARRs–section 11.3 Section 1
–Our strategic objectives
–our success indicators
Section 2–performance review
Agency service areas and service standards
ARRs–section 11.4 Section 2–Our service performance
Financial performance Summary of financial performance
ARRs–section 12.1 Section 6–Our financial performance

531 JULY – 12 DECEMBER 2017
Summary of requirement Basis for requirement Annual report reference
Governance–management and structure
Organisational structure ARRs–section 13.1 Section 1–Our structure
Executive management ARRs–section 13.2 Section 3–Our governance
Government bodies (statutory bodies and other entities)
ARRs–section 13.3 Information available at http://www.qld.gov.au/dsiti/annual-report
Public Sector Ethics Act 1994 Public Sector Ethics Act 1994
ARRs–section 13.4
Section 4–Ethics and code of conduct
Queensland public service values
ARRs–section 13.5 Section 1–Our values
Governance–risk management and accountability
Risk management ARRs–section 14.1 Section 3–Risk Management and Audit and Risk Management Committee
Audit committee ARRs–section 14.2 Section 3–Audit and Risk Management Sub-committee
Internal audit ARRs–section 14.3 Section 3–Audit arrangements
External scrutiny ARRs–section 14.4 Section 3–External assurance
Information systems and recordkeeping
ARRs–section 14.5 Section 3–Information systems and knowledge management
Governance–human resources
Workforce planning and performance
ARRs–section 15.1 Section 4–Our people
Early retirement, redundancy and retrenchment
Directive No. 16/16 Early Retirement, Redundancy and Retrenchment
ARRs–section 15.2
Section 4–Separations
Open data Statement advising publication of information
ARRs–section 16 About our annual report
Consultancies ARRs–section 33.1 Open data data.qld.gov.au
Overseas travel ARRs–section 33.2 Open data data.qld.gov.au
Queensland Language Services Policy
ARRs–section 33.3 Open data data.qld.gov.au
Financial statements Certification of financial statements
FAA–section 62
FPMS–sections 42, 43 and 50
ARRs–section 17.1
Financial statements
Part B
Independent Auditor’s Report
FAA–section 62
FPMS–section 50
ARRs–section 17.2
Financial statements
Part B
FAA–Financial Accountability Act 2009 FPMS–Financial and Performance Management Standard 2009
ARRs–Annual report requirements for Queensland Government agencies

54 DSITI FINAL REPORT
FINALREPORT1 JULY – 12 DECEMBER 2017
PART A
THIS PAGE IS INTENTIONALLY LEFT BLANK
551 JULY – 12 DECEMBER 2017
FINALREPORT1 JULY – 12 DECEMBER 2017
PART APART B Financial Statements

PART B Department of Science, Information Technology and Innovation
2 Annual Report 2017–18 | Department of Science, Information Technology and Innovation
The Department of Science, Information Technology and Innovation
Final Financial Statements
Understanding our financial statements
These final financial statements enable readers to assess the Department of Science, Information Technology and
Innovation (the department) including its commercialised business unit (CBU) and shared service provider (SSP) financial
results and cash flows for the period 1 July 2017 to 12 December 2017, and its position as at 12 December 2017.
The department is a Queensland Government department established under the Public Service Act 2008 and controlled
by the State of Queensland, which is the ultimate parent. The department has been abolished as a result of the Public
Service Departmental Arrangements Notice (No3) 2017, effective 12 December 2017 and these financial statements are
the final financial statements.
Page No
Statement of Comprehensive Income 3
This statement shows income and expenses and the results of operations for the reporting period, as well as other
comprehensive income including asset revaluation adjustments.
Statement of Comprehensive Income by Major Departmental Services, CBUs and SSPs 4
This statement provides information on income and expenses by each departmental service, CBU and SSP.
Statement of Financial Position 6
This statement provides information concerning assets, liabilities and the department’s equity at the end of the reporting
period. Assets shown as current are reasonably expected to be converted to cash, sold or consumed in the operations of
the department subsequent to the reporting period. Similarly, current liabilities are expected to consume cash subsequent
to the reporting period.
Statement of Assets and Liabilities by Major Departmental Services, CBUs and SSPs 7
This statement provides information on assets and liabilities by each departmental service, CBU and SSP.
Statement of Changes in Equity 9
This statement provides information on the movement of equity during the reporting period.
Statement of Cash Flows 10
This statement provides information concerning sources and uses of cash during the reporting period and
available cash at the end of the reporting period.
Notes to the final financial statements 11
Management Certificate 49
Independent Auditor’s Report 50
General information
The head office and principal place of business of the department was:
Level 33
1 William Street
BRISBANE QLD 4000
A description of the nature of the department's operations and its principal activities is included in the notes to the final
financial statements.
For information in relation to the department's final financial statements, please call 13 QGOV (13 74 68), email
[email protected] or visit the departmental website www.qld.gov.au/dsiti.

PART B Department of Science, Information Technology and Innovation
Annual Report 2017–18 | Department of Science, Information Technology and Innovation 3
Statement of Comprehensive Income for the period 1 July 2017 to 12 December 2017
Note
2018
Actual
$'000
2018
Original
Budget
$’000
Budget
Variance*
$’000
2017
Actual
$'000
OPERATING RESULT
Income from continuing operations
Appropriation revenue 5 144,842
354,553 (209,711) 305,455
User charges and fees 6 135,235 294,055 (158,820) 302,914
Grants and other contributions 7 8,318 14,421 (6,103) 22,347
Interest 13 53 156 (103) 115
Other revenue 8 2,514 1,666 848 5,541
Total revenue 290,962 664,851 (373,889) 636,372 2 Gains on disposal of assets 4 - 4 5
Total income from continuing operations 290,966 664,851 (373,885) 636,377
Expenses from continuing operations
Employee expenses 9 117,644 271,018 (153,374) 261,212
Supplies and services 10 127,421 308,540 (181,119) 281,912
Grants and subsidies 11 28,312 62,837 (34,525) 51,267
Depreciation and amortisation 16/17 12,940 28,247 (15,307) 28,616
Impairment losses 27 8 - 8 2,314
Finance/borrowing costs 19 1,955 4,020 (2,065) 4,343
Other expenses 12 2,329 2,844 (515) 2,789
Total expenses from continuing operations 290,609 677,506 (386,897) 632,453
Operating result from continuing operations before income tax
357 (12,655) 13,012 3,924
Income tax revenue 28 306 - 306 620
Operating result from continuing operations after income tax
663 (12,655) 13,318 4,544
Other comprehensive income
Items that will not be reclassified to operating result
Increase in asset revaluation surplus 17 424 - 424 -
Total other comprehensive income 424 - 424 -
Total comprehensive income 1,087 (12,655) 13,742 4,544
* An explanation of major variances is included at note 29.
The accompanying notes form part of these statements.

PART B Department of Science, Information Technology and Innovation
4 Annual Report 2017–18 | Department of Science, Information Technology and Innovation
Statement of Comprehensive Income by Major Departmental Services, CBUs and SSPs
for the period 1 July 2017 to 12 December 2017
Se
rvic
es f
or
Qu
ee
ns
lan
de
rs
2017
$'0
00
74
,26
4
29,9
24 - -
285
10
4,4
73 -
10
4,4
73
49
,33
0
47
,05
2
1,5
60
3,5
00
1 -
2,9
23
10
4,3
66 .
107 -
107 - -
107
The a
ccom
pan
yin
g n
ote
s form
pa
rt o
f th
ese s
tate
ments
.
2018
$'0
00
35,5
74
11
,24
6 - -
16
46
,83
6 -
46
,83
6
22
,80
6
21
,75
8
756
866
1 -
39
46
,22
6
610 -
610 - -
610
Se
rvic
es f
or
Go
ve
rnm
en
t
2017
$'0
00
14
8,1
01
4,1
04
14
,80
8 -
5,7
50
17
2,7
63 5
17
2,7
68
49
,26
9
94
,72
9
3,4
48
15
,13
0 -
4,3
23
5,1
76
17
2,0
75
693 -
693 - -
693
2018
$'0
00
68
,73
1
509
4,6
93 -
1,8
68
75
,80
1 -
75
,80
1
23
,29
4
40
,30
6
4,4
33
7,1
75
1
1,9
49
80
77
,23
8
(1,4
37
) -
(1,4
37
)
424
424
(1,0
13)
Qu
ee
ns
lan
d S
ha
red
Se
rvic
es (
SS
P)
2017
$'0
00
-
13
9,8
71
3,2
51 -
315
14
3,4
37 -
14
3,4
37
81
,88
6
50
,64
8 -
4,2
21
2,2
86 -
1,3
49
14
0,3
90
3,0
47 -
3,0
47 - -
3,0
47
2018
$'0
00
-
62
,77
3
2,5
44 - 5
65,3
22 -
65
,32
2
36
,64
0
24
,85
5 -
2,1
64 - -
392
64
,05
1
1,2
71 -
1,2
71 - -
1,2
71
CIT
EC
(C
BU
)
2017
$'0
00
-
15
3,7
41
711
115
151
15
4,7
18 -
15
4,7
18
40
,10
8
11
0,7
72 -
5,4
41
27
13
564
15
6,9
25
(2,2
07
)
620
(1,5
87
)
- -
(1,5
87
)
2018
$'0
00
-
73
,74
9 -
53
26
73,8
28 4
73
,83
2
17
,61
9
54
,49
1 -
2,3
99
6 -
234
74
,74
9
(91
7)
306
(61
1)
- -
(61
1)
Inc
om
e f
rom
co
nti
nu
ing
op
era
tio
ns
Appro
priation r
evenue
Use
r ch
arg
es a
nd fe
es
Gra
nts
an
d o
ther
co
ntr
ibutio
ns
Inte
rest
Oth
er
reve
nu
e
To
tal re
ve
nu
e
Ga
ins o
n d
isp
osa
l o
f asse
ts
To
tal in
co
me
fro
m c
on
tin
uin
g o
pe
rati
on
s
Ex
pe
ns
es
fro
m c
on
tin
uin
g o
pe
rati
on
s
Em
plo
ye
e e
xp
enses
Supplie
s a
nd s
erv
ices
Gra
nts
an
d s
ubsid
ies
De
pre
cia
tio
n a
nd a
mo
rtis
atio
n
Imp
airm
ent
losse
s
Fin
an
ce/b
orr
ow
ing c
osts
Oth
er
exp
ense
s
To
tal
ex
pe
ns
es f
rom
co
nti
nu
ing
op
era
tio
ns
Op
era
tin
g r
es
ult
fro
m c
on
tin
uin
g o
pe
rati
on
s b
efo
re i
nc
om
e t
ax
Inco
me ta
x r
eve
nue
Op
era
tin
g r
es
ult
fro
m c
on
tin
uin
g o
pe
rati
on
s a
fter
inc
om
e t
ax
Oth
er
co
mp
reh
en
siv
e i
nc
om
e
Ite
ms t
ha
t w
ill
no
t b
e r
ecla
ssif
ied
to
op
era
tin
g r
es
ult
Incre
ase
in a
sset re
va
luatio
n s
urp
lus
To
tal
oth
er
co
mp
reh
en
siv
e in
co
me
To
tal
co
mp
reh
en
siv
e in
co
me

PART B Department of Science, Information Technology and Innovation
Annual Report 2017–18 | Department of Science, Information Technology and Innovation 5
Statement of Comprehensive Income by Major Departmental Services, CBUs and SSPs for the period 1 July 2017 to 12 December 2017
Statement of Financial Position
De
pa
rtm
en
t to
tal
2017
$'0
00
30
5,4
55
302,9
14
22
,34
7
115
5,5
41
63
6,3
72 5
6
36,3
77
26
1,2
12
28
1,9
12
51
,26
7
28,6
16
2,3
14
4,3
43
2,7
89
63
2,4
53
3,9
24
620
4,5
44 - -
4,5
44
The a
ccom
pan
yin
g n
ote
s form
pa
rt o
f th
ese s
tate
ments
.
2018
$'0
00
14
4,8
42
13
5,2
35
8,3
18
53
2,5
14
29
0,9
62 4
29
0,9
66
11
7,6
44
12
7,4
21
28
,31
2
12,9
40
8
1,9
55
2,3
29
29
0,6
09
357
306
663
424
424
1,0
87
Inte
r-d
ep
art
me
nta
l
elim
ina
tio
ns
2017
$'0
00
(12
,81
2)
(24
,72
6) - -
(25
,97
3)
(63
,51
1) -
(63
,51
1)
(20
4)
(50
,44
8) - - - -
(12
,85
9)
(63
,51
1) - - -
- - -
2018
$'0
00
1,2
06
(13
,04
2) - -
(12
,69
5)
(24
,53
1) -
(24
,53
1)
(1,2
03)
(24
,53
3) - - - -
1,2
05
(24
,53
1) - - -
- - -
Ge
ne
ral – n
ot
att
rib
uta
ble
2017
$'0
00
26
,51
9 -
1,7
00 -
24
,65
6
52
,87
5 -
52
,87
5
26
,90
5
20
,65
7
3
204
(1) 7
3,6
05
51
,38
0
1,4
95 -
1,4
95 - -
1,4
95
2018
$'0
00
6,4
13 - - -
12
,65
3
19
,06
6 -
19
,06
6
11
,88
2
6,7
67
40
125 - 6
246
19
,06
6 - - -
- - -
Ad
va
nc
e
Qu
ee
ns
lan
d t
hro
ug
h
inn
ov
ati
on
2017
$'0
00
69
,38
3 -
1,8
77 -
357
71
,61
7 -
71
,61
7
13
,91
8
8,5
02
46
,25
6
120
1 -
2,0
31
70
,82
8
789 -
789 - -
789
2018
$'0
00
32
,91
8 -
1,0
81 -
641
34
,64
0 -
34
,64
0
6,6
06
3,7
77
23,0
83
211 - -
133
33
,81
0
830 -
830 - -
830
Inc
om
e f
rom
co
nti
nu
ing
op
era
tio
ns
Appro
priation r
evenue
Use
r ch
arg
es a
nd fe
es
Gra
nts
an
d o
ther
co
ntr
ibutio
ns
Inte
rest
Oth
er
reve
nu
e
To
tal re
ve
nu
e
Ga
ins o
n d
isp
osa
l o
f asse
ts
To
tal in
co
me
fro
m c
on
tin
uin
g o
pe
rati
on
s
Ex
pe
ns
es
fro
m c
on
tin
uin
g o
pe
rati
on
s
Em
plo
ye
e e
xp
enses
Supplie
s a
nd s
erv
ices
Gra
nts
an
d s
ubsid
ies
De
pre
cia
tio
n a
nd a
mo
rtis
atio
n
Imp
airm
ent
losse
s
Fin
an
ce/b
orr
ow
ing c
osts
Oth
er
exp
ense
s
To
tal
ex
pe
ns
es f
rom
co
nti
nu
ing
op
era
tio
ns
Op
era
tin
g r
es
ult
fro
m c
on
tin
uin
g o
pe
rati
on
s b
efo
re
inc
om
e t
ax
Inco
me ta
x r
eve
nue
Op
era
tin
g r
es
ult
fro
m c
on
tin
uin
g o
pe
rati
on
s a
fter
inc
om
e t
ax
Oth
er
co
mp
reh
en
siv
e i
nc
om
e
Ite
ms t
ha
t w
ill
no
t b
e r
ecla
ssif
ied
to
op
era
tin
g r
es
ult
Incre
ase
in a
sset re
va
luatio
n s
urp
lus
To
tal
oth
er
co
mp
reh
en
siv
e in
co
me
To
tal
co
mp
reh
en
siv
e in
co
me

PART B Department of Science, Information Technology and Innovation
6 Annual Report 2017–18 | Department of Science, Information Technology and Innovation
as at 12 December 2017
Note
2018
Actual
$'000
2018
Original
Budget
$’000
Budget
Variance*
$’000
2017
Actual
$'000
Current assets
Cash and cash equivalents 13 24,364 24,058 306 41,857
Receivables 14 62,875 40,345 22,530 47,910
Other current assets 15 16,294 15,111 1,183 18,836
Total current assets 103,533 79,514 24,019 108,603
Non-current assets
Intangible assets 16 36,469 32,797 3,672 35,614
Property, plant and equipment 17 180,779 165,740 15,039 183,082
Other non-current assets 15 1,672 10,617 (8,945) 1,195
Total non-current assets 218,920 209,154 9,766 219,891
Total assets 322,453 288,668 33,785 328,494
Current liabilities
Payables 18 47,838 39,309 8,529 47,649
Interest-bearing liabilities 19 10,157 9,267 890 9,106
Accrued employee benefits 20 5,920 11,842 (5,922) 11,146
Other current liabilities 21 5,241 4,310 931 4,795
Total current liabilities 69,156 64,728 4,428 72,696
Non-current liabilities
Interest-bearing liabilities 19 112,997 102,725 10,272 112,967
Deferred tax liabilities 28 599 1,525 (926) 905
Other non-current liabilities 21 2,620 10,468 (7,848) 3,242
Total non-current liabilities 116,216
114,718 1,498 117,114
Total liabilities 185,372 179,446 5,926 189,810
Net assets 137,081 109,222 27,859 138,684
Equity
Contributed equity 147,814 150,504
Accumulated deficit (58,850) (59,513)
Asset revaluation surplus 17 48,117 47,693
Total equity 137,081 109,222 27,859 138,684
* An explanation of major variances is included at note 29. The accompanying notes form part of these statements. Statement of Assets and Liabilities by Major Departmental Services, CBUs and SSPs

PART B Department of Science, Information Technology and Innovation
Annual Report 2017–18 | Department of Science, Information Technology and Innovation 7
as at 12 December 2017
Se
rvic
es f
or
Qu
ee
ns
lan
de
rs
2017
$'0
00
3,3
66
10
,10
3
1,8
53
15
,32
2
6,7
70
4,2
09 -
10
,97
9
26
,30
1
11
,062 -
2,1
65 -
13
,22
7 - - - -
13
,22
7
13
,07
4
The a
ccom
pan
yin
g n
ote
s form
pa
rt o
f th
ese s
tate
ments
.
2018
$'0
00
2,7
76
8,1
57
2,0
41
12
,97
4
7,4
27
3,6
54 -
11
,08
1
24
,05
5
7,9
94 -
1,3
67
78
9,4
39 - - - -
9,4
39
14
,61
6
Se
rvic
es f
or
Go
ve
rnm
en
t
2017
$'0
00
-
16
,788
10
,79
7
27
,58
5
1,4
01
16
5,1
81 -
16
6,5
82
19
4,1
67
33
,35
7
8,9
95
2,1
61
222
44
,73
5
11
2,5
70 - -
11
2,5
70
15
7,3
05
36
,86
2
2018
$'0
00
-
10
,58
7
4,2
74
14
,86
1
1,6
60
16
4,6
83 -
16
6,3
43
18
1,2
04
27
,21
9
10
,04
4
1,1
45
130
38
,53
8
11
2,6
57 - -
11
2,6
57
15
1,1
95
30
,00
9
Qu
ee
ns
lan
d S
ha
red
Se
rvic
es (
SS
P)
2017
$'0
00
22
,43
0
14
,05
6
1,1
83
37
,66
9
24
,55
4
808 -
25
,36
2
63
,03
1
5,3
22 -
3,5
77
2,3
97
11
,29
6 - - - -
11
,29
6
51
,73
5
2018
$'0
00
8,3
80
30
,90
4
3,2
24
42
,50
8
24
,99
8
586 -
25
,58
4
68
,09
2
9,7
62 -
1,7
48
3,5
76
15
,08
6 - - - -
15
,08
6
53
,00
6
CIT
EC
(C
BU
)
2017
$'0
00
16
,93
5
16
,21
5
4,0
69
37
,21
9
2,8
89
8,6
22
162
11
,67
3
48
,89
2
7,8
53 -
1,7
64
1,6
47
11
,26
4 -
905
98
1,0
03
12
,26
7
36
,62
5
2018
$'0
00
14
,66
3
22
,04
4
5,8
65
42
,57
2
2,3
84
7,8
95
655
10
,93
4
53
,50
6
14
,95
2 -
948
960
16
,86
0 -
599
33
632
17
,492
36
,014
Cu
rre
nt
as
se
ts
Cash
and
cash
eq
uiv
ale
nts
Rece
iva
ble
s
Oth
er
cu
rre
nt
asse
ts
To
tal
cu
rre
nt
as
sets
No
n-c
urr
en
t a
ss
ets
Inta
ng
ible
assets
Pro
pe
rty,
pla
nt a
nd e
qu
ipm
en
t
Oth
er
no
n-c
urr
en
t assets
To
tal
no
n-c
urr
en
t a
ss
ets
To
tal
as
sets
Cu
rre
nt
lia
bilit
ies
Pa
ya
ble
s
Inte
rest-
be
arin
g lia
bili
ties
Accru
ed e
mp
loye
e b
en
efits
Oth
er
cu
rre
nt
liab
ilitie
s
To
tal
cu
rre
nt
lia
bilit
ies
No
n-c
urr
en
t li
ab
ilit
ies
Inte
rest-
be
arin
g lia
bili
ties
De
ferr
ed t
ax lia
bili
tie
s
Oth
er
no
n-c
urr
en
t lia
bili
ties
To
tal
no
n-c
urr
en
t li
ab
ilit
ies
To
tal li
ab
ilit
ies
Ne
t a
ss
ets
Statement of Assets and Liabilities by Major Departmental Services, CBUs and SSPs as at 12 December 2017

PART B Department of Science, Information Technology and Innovation
8 Annual Report 2017–18 | Department of Science, Information Technology and Innovation
De
pa
rtm
en
t to
tal
2017
$'0
00
41
,85
7
47
,91
0
18
,83
6
10
8,6
03
35
,61
4
18
3,0
82
1,1
95
21
9,8
91
32
8,4
94
47
,64
9
9,1
06
11
,14
6
4,7
95
72
,69
6
11
2,9
67
905
3,2
42
11
7,1
14
18
9,8
10
13
8,6
84
The a
ccom
pan
yin
g n
ote
s form
pa
rt o
f th
ese s
tate
ments
.
2018
$'0
00
24
,36
4
62
,87
5
16
,29
4
10
3,5
33
36
,46
9
18
0,7
79
1,6
72
21
8,9
20
32
2,4
53
47
,83
8
10
,15
7
5,9
20
5,2
41
69
,15
6
11
2,9
97
599
2,6
20
11
6,2
16
18
5,3
72
137
,08
1
Inte
r-d
ep
art
me
nta
l
elim
ina
tio
ns
2017
$'0
00
-
(20
,70
2) -
(20
,70
2)
- - - -
(20
,70
2)
(20
,70
2) - - -
(20
,70
2)
- - - -
(20
,70
2) -
2018
$'0
00
-
(15
,91
6) -
(15
,91
6)
- - - -
(15
,91
6)
(15
,91
6) - - -
(15
,91
6)
- - - -
(15
,91
6) -
Ge
ne
ral – n
ot
att
rib
uta
ble
2017
$'0
00
(87
4)
7,2
90
895
7,3
11 -
1,2
76 -
1,2
76
8,5
87
7,8
50
111
1,1
79 -
9,1
40
397 - -
397
9,5
37
(95
0)
2018
$'0
00
(1,4
55
)
6,2
25
807
5,5
77 -
1,1
85 -
1,1
85
6,7
62
301
113
563 -
977
340 - -
340
1,3
17
5,4
45
Ad
va
nc
e
Qu
ee
ns
lan
d
thro
ug
h i
nn
ov
ati
on
2017
$'0
00
-
4,1
60
39
4,1
99 -
2,9
86
1,0
33
4,0
19
8,2
18
2,9
07 -
300
529
3,7
36 - -
3,1
44
3,1
44
6,8
80
1,3
38
2018
$'0
00
-
874
83
957
-
2,7
76
1,0
17
3,7
93
4,7
50
3,5
26 -
149
49
7
4,1
72 - -
2,5
87
2,5
87
6,7
59
(2,0
09)
Cu
rre
nt
as
se
ts
Cash
and
cash
eq
uiv
ale
nts
Rece
iva
ble
s
Oth
er
cu
rre
nt
asse
ts
To
tal
cu
rre
nt
as
sets
No
n-c
urr
en
t a
ss
ets
Inta
ng
ible
assets
Pro
pe
rty,
pla
nt a
nd e
qu
ipm
en
t
Oth
er
no
n-c
urr
en
t assets
To
tal
no
n-c
urr
en
t a
ss
ets
To
tal
as
sets
Cu
rre
nt
lia
bilit
ies
Pa
ya
ble
s
Inte
rest-
be
arin
g lia
bili
ties
Accru
ed e
mp
loye
e b
en
efits
Oth
er
cu
rre
nt
liab
ilitie
s
To
tal
cu
rre
nt
lia
bilit
ies
No
n-c
urr
en
t li
ab
ilit
ies
Inte
rest-
be
arin
g lia
bili
ties
De
ferr
ed t
ax lia
bili
tie
s
Oth
er
no
n-c
urr
en
t lia
bili
ties
To
tal
no
n-c
urr
en
t li
ab
ilit
ies
To
tal li
ab
ilit
ies
Ne
t a
ss
ets
Statement of Changes in Equity for the period 1 July 2017 to 12 December 2017

PART B Department of Science, Information Technology and Innovation
Annual Report 2017–18 | Department of Science, Information Technology and Innovation 9
Note
2018
$'000
2017
$'000
Contributed equity
Balance at 1 July 150,504 155,917
Transactions with owners as owners
Appropriated equity injections 5 4,712 16,420
Appropriated equity withdrawals 5 (7,402) (18,045)
Non-appropriated equity injections - 191
Non-appropriated equity withdrawals - (3,979)
Balance at reporting date 147,814 150,504
Accumulated deficit
Balance at 1 July (59,513) (64,057)
Operating result
Operating result from continuing operations after income tax 663 4,544
Balance at reporting date (58,850) (59,513)
Asset revaluation surplus
Balance at 1 July 47,693 47,693
Other comprehensive income
Increase in asset revaluation surplus 17 424 -
Balance at reporting date 48,117 47,693
Total equity at reporting date 137,081 138,684
The accompanying notes form part of these statements.
Statement of Cash Flows for the period 1 July 2017 to 12 December 2017

PART B Department of Science, Information Technology and Innovation
10 Annual Report 2017–18 | Department of Science, Information Technology and Innovation
Note
2018
Actual
$'000
2018
Original
Budget
$’000
Budget
Variance*
$’000
2017
Actual
$'000
Cash flows from operating activities
Inflows:
Service appropriation receipts ce appropriation receipts
5 146,239 354,553 (208,314) 291,854
User charges and fees 119,489 293,541 (174,052) 309,488
Grants and other contributions 8,189 14,421 (6,232) 20,940
GST collected from customers 13,820 28,285 (14,465) 28,588
GST input tax credits from ATO 16,413 13,885 2,528 35,226
Interest receipts 58 156 (98) 123
Other 4,384 1,666 2,718 6,060
Outflows:
Employee expenses (126,543) (270,919) 144,376 (260,563)
Supplies and services (125,083) (307,023) 181,940 (273,577)
Grants and subsidies (28,254) (62,837) 34,583 (51,122)
Finance/borrowing costs (2,174) (4,020) 1,846 (4,345)
GST paid to suppliers (15,007) (12,164) (2,843) (31,844)
GST remitted to ATO (14,646) (29,309) 14,663 (32,800)
Other (1,232) (5,162) 3,930 (3,121)
Net cash provided by/(used in) operating activities 24 (4,347) 15,073 (19,420) 34,907
Cash flows from investing activities
Inflows:
Sales of property, plant and equipment 39 16 23 121
Outflows:
Payments for property, plant and equipment (2,581) (10,871) 8,290 (5,453)
Payments for intangibles (3,602) (5,532) 1,930 (12,217)
Net cash used in investing activities
(6,144) (16,387) 10,243 (17,549)
Cash flows from financing activities
Inflows:
Equity injections 1,838 11,029 (9,191) 13,217
Outflows:
Borrowing redemptions - - - (580)
Finance lease payments (4,575) (8,678) 4,103 (8,552)
Equity withdrawals (4,265) (13,209) 8,944 (21,276)
Net cash used in financing activities (7,002) (10,858) 3,856 (17,191)
Net increase/(decrease) in cash and cash equivalents
(17,493) (12,172) (5,321) 167
Cash and cash equivalents at beginning of financial year
41,857 36,230 5,627 41,690
Cash and cash equivalents at end of the reporting period
13 24,364 24,058 306 41,857
* An explanation of major variances is included at note 29.
The accompanying notes form part of these statements.

PART B Department of Science, Information Technology and Innovation
Notes to the final financial statements for the period 1 July 2017 to 12 December 2017
Annual Report 2017–18 | Department of Science, Information Technology and Innovation 11
Preparation information – basis of financial statement preparation
Note 1: Statement of compliance
Note 2: Final financial statements of the department as a result of machinery-of-government changes
How we operate – our departmental objectives and activities
Note 3: The reporting entity
Note 4: Objectives and principal activities of the department
Performance for the year
Note 5: Appropriation receipts
Note 6: User charges and fees
Note 7: Grants and other contributions
Note 8: Other revenue
Note 9: Employee expenses
Note 10: Supplies and services
Note 11: Grants and subsidies
Note 12: Other expenses
Operating assets and liabilities
Note 13: Cash and cash equivalents
Note 14: Receivables
Note 15: Other current and non-current assets
Note 16: Intangible assets
Note 17: Property, plant and equipment
Note 18: Payables
Note 19: Interest-bearing liabilities
Note 20: Accrued employee benefits
Note 21: Other current and non-current liabilities
Other key information
Note 22: Key management personnel and remuneration expenses
Note 23 Related party transactions
Note 24: Reconciliation of cash flows
Note 25: Operating lease and capital commitments
Note 26: Contingencies
Note 27: Financial instruments
Note 28: Taxation equivalents
Note 29: Budgetary reporting disclosures
Note 30: Schedule of administered items
Note 31: Administered appropriation receipts
Note 32: Administered budget to actual comparison and variance analysis
Note 33: Agency transactions and balances
Note 34: Machinery-of-government transfers
Note 35: Summary of other accounting policies
Note 36: Events subsequent to abolition of the department

PART B Department of Science, Information Technology and Innovation
Notes to the final financial statements for the period 1 July 2017 to 12 December 2017
12 Annual Report 2017–18 | Department of Science, Information Technology and Innovation
1. Statement of compliance
The department has prepared these financial statements in compliance with section 47 of the Financial and
Performance Management Standard 2009. These financial statements comply with Queensland Treasury’s
Minimum Reporting Requirements for reporting periods beginning on or after 1 July 2017.
The department is a not-for-profit entity and these general purpose financial statements are prepared on an
accrual basis (except for the Statement of Cash Flows which is prepared on a cash basis) in accordance with
Australian Accounting Standards and Interpretations applicable to not-for-profit entities.
The historical cost convention is used as the measurement basis except for land, buildings, infrastructure and
heritage and cultural assets which are measured at their fair value, refer note 35(o).
Under historical cost, assets are recorded at the amount of cash or cash equivalents paid or the fair value of
consideration given to acquire assets at the time of their acquisition. Liabilities are recorded at the amount of
proceeds received in exchange for the obligation or at the amounts of cash or cash equivalents expected to be
paid to satisfy the liability in the normal course of business.
New accounting standards early adopted and/or applied for the first time in these financial statements are outlined
in note 35(s,t).
2. Final financial statements of the department as a result of machinery-of-government changes
The department was abolished as a result of the Public Service Departmental Arrangements Notice (No3) 2017.
Under this notice, ongoing responsibility for functions of the department were transferred to the Department of
Environment and Science, the Department of Housing and Public Works, the Department of Innovation, Tourism
Industry Development and the Commonwealth Games and the Department of the Premier and Cabinet. The
effect of this transfer was from 13 December 2017.
As a result of the machinery-of-government changes the department is no longer considered a going concern.
While it is not a going concern, these final financial statements have been prepared consistent with the going
concern basis, as the transferred functions and services are expected to continue to operate as normal into the
foreseeable future. The value of assets and liabilities reported in these final financial statements represent their
carrying amounts immediately prior to machinery-of-government changes taking effect. These represent the
values of the assets and liabilities transferred to and recognised by the recipient departments. Further details of
these transfers are included in note 34.
Similarly, the values of commitments and contingencies disclosed in notes 19,25 and 26 represent their assessed
values prior to the transfer of these commitments and contingencies to their recipient departments.
These final financial statements cover the reporting period 1 July 2017 to 12 December 2017, up until the
effective date of abolishment of the department. Comparative information covers the period 1 July 2016 to 30
June 2017.
3. The reporting entity
The financial statements include all income, expenses, assets, liabilities and equity of the department and the
entities that it controls, where these entities are material. The department had no controlled entities at 12
December 2017. All transactions and balances internal to the department have been eliminated in full.
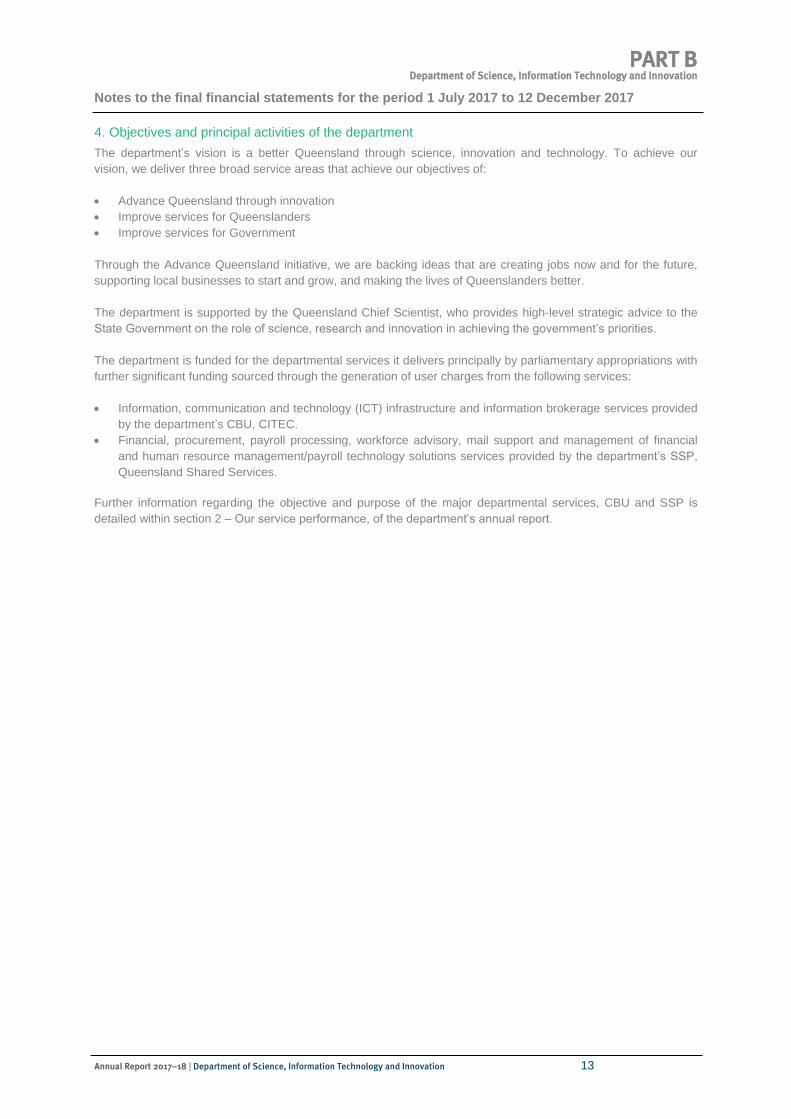
PART B Department of Science, Information Technology and Innovation
Notes to the final financial statements for the period 1 July 2017 to 12 December 2017
Annual Report 2017–18 | Department of Science, Information Technology and Innovation 13
4. Objectives and principal activities of the department
The department’s vision is a better Queensland through science, innovation and technology. To achieve our
vision, we deliver three broad service areas that achieve our objectives of:
• Advance Queensland through innovation
• Improve services for Queenslanders
• Improve services for Government
Through the Advance Queensland initiative, we are backing ideas that are creating jobs now and for the future,
supporting local businesses to start and grow, and making the lives of Queenslanders better.
The department is supported by the Queensland Chief Scientist, who provides high-level strategic advice to the
State Government on the role of science, research and innovation in achieving the government’s priorities.
The department is funded for the departmental services it delivers principally by parliamentary appropriations with
further significant funding sourced through the generation of user charges from the following services:
• Information, communication and technology (ICT) infrastructure and information brokerage services provided
by the department’s CBU, CITEC.
• Financial, procurement, payroll processing, workforce advisory, mail support and management of financial
and human resource management/payroll technology solutions services provided by the department’s SSP,
Queensland Shared Services.
Further information regarding the objective and purpose of the major departmental services, CBU and SSP is
detailed within section 2 – Our service performance, of the department’s annual report.

PART B Department of Science, Information Technology and Innovation
Notes to the final financial statements for the period 1 July 2017 to 12 December 2017
14 Annual Report 2017–18 | Department of Science, Information Technology and Innovation
5. Appropriation receipts
Reconciliation of payments from consolidated fund to appropriation revenue recognised in operating result*
2018 $'000
2017 $'000
Budgeted appropriation revenue 354,553 294,567
Treasurer’s transfers – transfers to equity adjustments - (173)
Lapsed appropriation revenue - (2,540)
Transfers to other departments (s79 machinery-of-government transfers)
Department of Environment and Science (45,275) -
Department of Housing and Public Works (101,199) -
Department of Innovation, Tourism, Industry Development and the Commonwealth Games (34,918) -
Department of the Premier and Cabinet (26,922) -
Total appropriation receipts (cash) 146,239 291,854
Less: Opening balance of appropriation revenue receivable (1,397) (5,203)
Plus: Opening balance of deferred appropriation payable to consolidated fund - 17,407
Plus: Closing balance of appropriation revenue receivable - 1,397
Less: Closing balance of deferred appropriation payable to consolidated fund (1,206) -
Net appropriation revenue 143,636 305,455
Deferred appropriation payable to consolidated fund (expense) 1,206 -
Appropriation revenue recognised in Statement of Comprehensive Income
144,842 305,455
Reconciliation of payments from consolidated fund to equity adjustment *
Budgeted equity adjustment appropriation (2,180) (4,444)
Treasurer’s transfers – transfers from appropriation revenue - 173
Transfers to other departments (s79 machinery-of-government transfers)
Department of Environment and Science (1,169) -
Department of Housing and Public Works (1,601) -
Department of the Premier and Cabinet 2,523 -
Equity adjustment receipts (cash) (2,427) (4,271)
Less: Opening balance of equity adjustment receivable (2,056) (1,813)
Plus: Opening balance of equity adjustment payable - 2,403
Plus: Closing balance of equity adjustment receivable 1,793 2,056
Equity adjustment recognised in contributed equity (2,690) (1,625)
* The individual balances reported above have been re-stated from a previous version of the financial statements
prepared and certified by management, refer Note 35(u) which describes the basis of the revision of the financial
report.
Accounting policy Appropriations provided under the Appropriation Act 2017 are recognised as revenue or equity when received or when a service rendered is recognised after approval from Queensland Treasury. Amounts appropriated to the department for transfer to other entities in accordance with legislative or other requirements are reported as ‘administered’ item appropriations. Refer to note 30.

PART B Department of Science, Information Technology and Innovation
Notes to the final financial statements for the period 1 July 2017 to 12 December 2017
Annual Report 2017–18 | Department of Science, Information Technology and Innovation 15
6. User charges and fees 2018
$'000 2017 $'000
Information, communication and technology services 75,181 164,739
Services rendered by shared service provider 59,496 133,965
Other 558 4,210
Total 135,235 302,914
Accounting policy User charges and fees are recognised as revenues when the revenue has been earned and can be measured reliably with a sufficient degree of certainty. This occurs upon delivery of the goods to the customer or completion of the requested services at which time the invoice is raised. Accrued revenue is recognised if the revenue has been earned but not yet invoiced.
7. Grants and other contributions Queensland Government grants and contributions* 5,999 14,328 Commonwealth grants and contributions* 360 815
Industry grants and contributions* 1,830 6,038
Asset received at below fair value 117 696
Services received at below fair value 12 470
Total 8,318 22,347
* Included in grants and other contributions are non-reciprocal grants funded by the Commonwealth, Queensland Government and other external bodies for a range of grant purposes. As at 12 December 2017, $8.406 million (30 June 2017: $8.522 million) of all grants and contribution funding received by the department in the current reporting period and prior financial years remained unspent, although the Queensland Government expects to fully comply with the conditions of the grant or contribution agreement, and so does not expect to recognise a payable in the future. Accounting policy Grants and contributions are non-reciprocal in nature so do not require any goods or services to be provided in return. Corresponding revenue is recognised in the year in which the department obtains control over the grant/contribution (control is generally obtained at the time of receipt). Contributed physical assets are recognised at their fair value. Contributions of services are recognised only if the services would have been purchased if they had not been donated and their fair value can be measured reliably. Where this is the case, an equal amount is recognised as revenue and expense.
8. Other revenue
Insurance compensation – loss of property 73 40
Reversal of impairment loss 28 41
Recovery of ICT related project costs 1,604 4,944
Rent 559 277
Miscellaneous revenue 250 239
Total 2,514 5,541
Accounting policy Rental revenue from leasing arrangements is recognised as income on a periodic straight-line basis over the lease term.

PART B Department of Science, Information Technology and Innovation
Notes to the final financial statements for the period 1 July 2017 to 12 December 2017
16 Annual Report 2017–18 | Department of Science, Information Technology and Innovation
9. Employee expenses 2018 $'000
2017 $'000
Employee benefits
Wages and salaries 92,034 203,971
Annual leave levy 9,604 20,763
Employer superannuation contributions 12,164 27,143
Long service leave levy 1,862 4,145
Termination benefits 205 850
Total employee benefits 115,869 256,872
Employee-related expenses
Workers’ compensation premium 296 624
Payroll tax 815 1,854
Other employee-related expenses 664 1,862
Total employee-related expenses 1,775 4,340
Total 117,644 261,212
The number of employees as at 12 December 2017, including both full-time employees and part-time employees, measured on a full-time equivalent basis is 2,629 (30 June 2017: 2,574). Key management personnel and remuneration disclosures are detailed in note 22.
Accounting policy Wages, salaries and sick leave Wages and salaries due but unpaid at reporting date are recognised in the Statement of Financial Position at the current salary rates. As the department expects such liabilities to be wholly settled within 12 months of reporting date, the liabilities are recognised at undiscounted amounts. Prior history indicates that on average, sick leave taken each reporting period is less than the entitlement accrued. This is expected to continue in future periods. Accordingly, it is unlikely that existing accumulated entitlements will be used by employees and no liability for unused sick leave entitlements is recognised. As sick leave is non-vesting, an expense is recognised for this leave as it is taken. Annual leave and long service leave The Queensland Government's Annual Leave Central Scheme became operational on 30 June 2008 for departments, commercialised business units and shared service providers. Under this scheme, a levy is made on the department to cover the cost of employees' annual leave (including leave loading and on-costs). The levies are expensed in the period in which they are payable. Amounts paid to employees for annual leave are claimed from the scheme quarterly in arrears. Under the Queensland Government’s Long Service Leave Central Scheme, a levy is made on the department to cover the cost of employees' long service leave. The levies are expensed in the period in which they are payable. Amounts paid to employees for long service leave are claimed from the scheme quarterly in arrears. Superannuation Post-employment benefits for superannuation are provided through defined contribution (accumulation) plans or the Queensland Government’s QSuper defined benefit plan as determined by the employee’s conditions of employment. Defined contribution plans – Contributions are made to eligible complying superannuation funds based on the rates specified in the relevant enterprise bargaining agreement or other conditions of employment. Contributions are expensed when they are paid or become payable following completion of the employee’s service each pay period. Defined benefit plan – The liability for defined benefits is held on a whole-of-Government basis and reported in those financial statements pursuant to AASB 1049 Whole of Government and General Government Sector Financial Reporting. The amount of contributions for defined benefit plan obligations is based upon the rates determined on the advice of the State Actuary. Contributions are paid by the department at the specified rate following completion of the employee’s service each pay period. The department’s obligations are limited to those contributions paid. Payroll tax and workers' compensation insurance are a consequence of employing employees, but are not counted in an employee's total remuneration package. They are not employee benefits and are recognised separately as employee-related expenses.

PART B Department of Science, Information Technology and Innovation
Notes to the final financial statements for the period 1 July 2017 to 12 December 2017
Annual Report 2017–18 | Department of Science, Information Technology and Innovation 17
10. Supplies and services 2018 $'000
2017 $'000
Accommodation and property-related expenses 24,730 51,793
Contractors and consultants 20,371 44,845
Information, communication and technology expenses 79,234 169,245
Travel 786 1,158
Bank fees and charges 200 484
Other 2,100 14,387
Total 127,421 281,912
Accounting policy For a transaction to be classified as supplies and services, the value of goods and services received by the department must be of approximately equal value to the value of the consideration exchanged for those goods or services. Where this is not the substance of the arrangement, the transaction is classified as a grant, refer to note 11.
11. Grants and subsidies
Science and innovation 22,969 46,047
Information, communication and technology 5,247 5,096
Other grants and subsidies 38 -
Donations/gifts 58 124
Total 28,312 51,267
12. Other expenses
Insurance premiums – Queensland Government Insurance Fund (QGIF) 166 377
Insurance premiums – other 145 304
Losses from disposal of non-current assets* 68 22
Queensland Audit Office – external audit fees** 508 1,588
Special payments – other ex-gratia payments - 16
Deferred appropriation payable to consolidated fund 1,206 -
Sponsorships 225 414
Other 11 68
Total 2,329 2,789
* Certain losses of public property are insured with the Queensland Government Insurance Fund (QGIF). The claims made in respect of these losses have yet to be assessed by QGIF and the amount recoverable cannot be estimated reliably at reporting date. Upon notification by QGIF of the acceptance of the claims, revenue will be recognised for the agreed settlement amount and disclosed as 'Other Revenue - Insurance compensation from loss of property’. ** Total audit fees quoted by the Queensland Audit Office relating to the final financial statements are $245,000 (2017: $440,000). Other audit services relate to the audit of the report on service provider controls.
Accounting policy Special payments include ex-gratia expenditure and other expenditure that the department is not contractually or legally obligated to make to other parties. In compliance with the Financial and Performance Management Standard 2009, the department maintains a register setting out the details of all special payments greater than $5,000. The total of all special payments (including those of $5,000 or less) is disclosed separately within other expenses. However, descriptions of the nature of special payments are only provided for special payments greater than $5,000.

PART B Department of Science, Information Technology and Innovation
Notes to the final financial statements for the period 1 July 2017 to 12 December 2017
18 Annual Report 2017–18 | Department of Science, Information Technology and Innovation
13. Cash and cash equivalents 2018
$'000 2017 $'000
Imprest accounts 8 8
Cash at bank 24,356 41,849
Total 24,364 41,857
The department, through the CITEC CBU, earned interest of $0.053 million (30 June 2017: $0.115 million) on deposits with the Commonwealth Bank. Interest earned on cash held with the Commonwealth Bank earned 0.71% from 1 July 2017 to 12 December 2017 (0.73% to 0.96% during 2016–17).
All other departmental bank accounts are grouped within the whole-of-Government set-off arrangement with the Queensland Treasury Corporation (QTC) and do not earn interest on surplus funds. Interest earned on the aggregate set-off arrangement balance accrues to the consolidated fund. Accounting policy For the purposes of the Statement of Financial Position and the Statement of Cash Flows, cash assets include all cash and cheques receipted but not banked at reporting date as well as deposits at call with financial institutions.
14. Receivables
Trade debtors 48,429 28,521
Less: Allowance for impairment loss* (21) (45)
Net trade debtors 48,408 28,476
GST input tax credits receivable 5,497 4,707
GST payable (4,476) (3,062)
Net GST 1,021 1,645
Advances 47 48
Less: Allowance for impairment loss* (4) (6)
Net advances 43 42
Annual leave reimbursements 6,610 4,085
Long service leave reimbursements 1,033 1,056
Appropriation revenue receivable - 1,397
Departmental equity injection receivable 1,793 2,056
Accrued revenue 3,030 8,277
Interest receivable 25 30
Other 912 846
Total 62,875 47,910
* Refer to note 27(c) Financial instruments (Credit risk exposure) for an analysis of movements in the allowance for impairment loss. Accounting policy Receivables are measured at amortised cost which approximates their fair value at reporting date. Trade debtors are recognised at the amounts due at the time of sale or service delivery i.e. the agreed purchase/contract price. Settlement of these amounts is generally required within 30 days from invoice date. The collectability of receivables is assessed periodically with provision being made where receivables are impaired. All known bad debts were written off as at reporting date. Note 27(c) details the accounting policies for impairment of receivables, including the loss events giving rise to impairment and the movements in the allowance for impairment loss. All receivables within terms and expected to be fully collectible are considered of good credit quality based upon recent collection history. Credit risk management strategies are also detailed in note 27(c). Other debtors generally arise from transactions outside the usual operating activities of the department and are recognised at their assessed values. Settlement of these amounts is generally required within 30 days from invoice date. No interest is charged and no security is obtained.
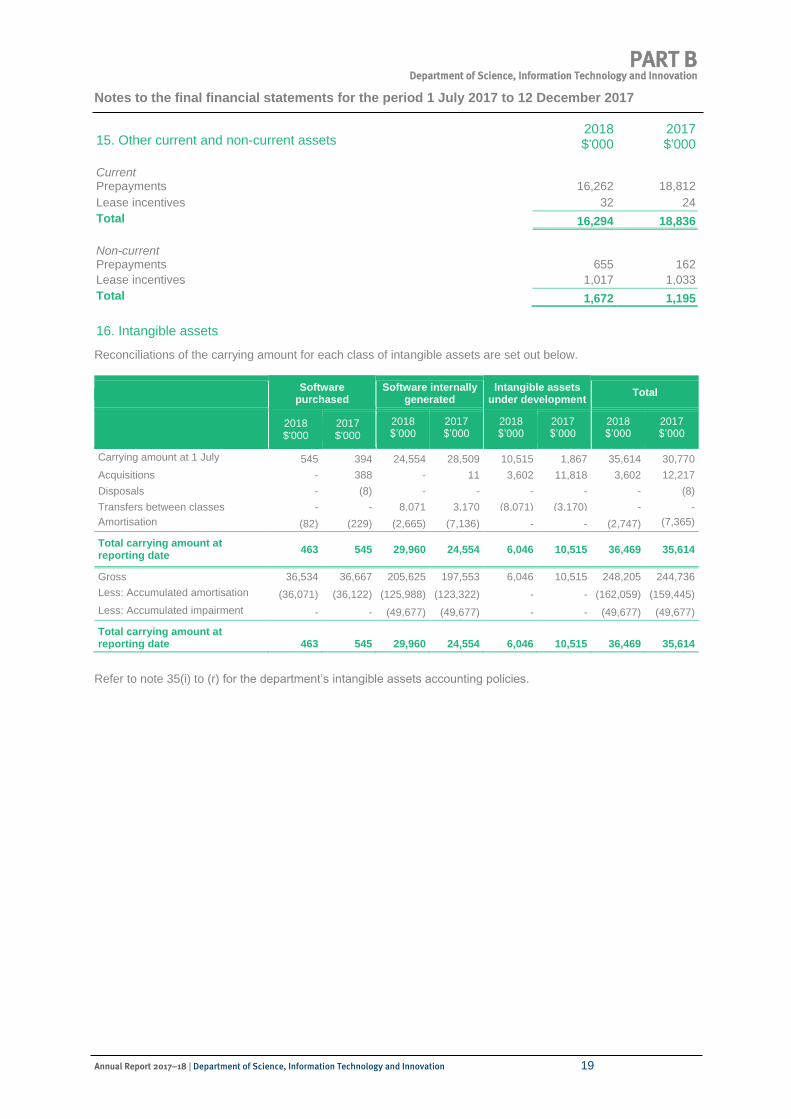
PART B Department of Science, Information Technology and Innovation
Notes to the final financial statements for the period 1 July 2017 to 12 December 2017
Annual Report 2017–18 | Department of Science, Information Technology and Innovation 19
15. Other current and non-current assets 2018 $'000
2017 $'000
Current
Prepayments 16,262 18,812
Lease incentives 32 24
Total 16,294 18,836
Non-current
Prepayments 655 162
Lease incentives 1,017 1,033
Total 1,672 1,195
16. Intangible assets
Reconciliations of the carrying amount for each class of intangible assets are set out below.
Refer to note 35(i) to (r) for the department’s intangible assets accounting policies.
Software
purchased Software internally
generated Intangible assets
under development Total
2018 $'000
2017 $'000
2018 $’000
2017 $’000
2018 $’000
2017 $’000
2018 $’000
2017 $’000
Carrying amount at 1 July 545 394 24,554 28,509 10,515 1,867 35,614 30,770
Acquisitions - 388
- 11 3,602 11,818 3,602 12,217 Disposals - (8) - - - - - (8)
Transfers between classes - - 8,071 3,170 (8,071) (3,170) - -
Amortisation (82) (229) (2,665) (7,136) - - (2,747) (7,365)
Total carrying amount at reporting date
463 545 29,960 24,554 6,046 10,515 36,469 35,614
Gross 36,534 36,667 205,625 197,553 6,046 10,515 -
--
248,205 244,736
Less: Accumulated amortisation (36,071) (36,122) (125,988) (123,322) - - (162,059) (159,445)
Less: Accumulated impairment losses
- - (49,677) (49,677) - - (49,677) (49,677)
Total carrying amount at reporting date 463 545 29,960 24,554 6,046 10,515 36,469 35,614

PART B Department of Science, Information Technology and Innovation
Notes to the final financial statements for the period 1 July 2017 to 12 December 2017
20 Annual Report 2017–18 | Department of Science, Information Technology and Innovation
17. Property, plant and equipment
Reconciliations of the carrying amount for each class of property, plant and equipment are set out below.
Land Building Leased assets Heritage and
cultural assets
2018 $'000
2017 $'000
2018 $’000
2017 $’000
2018 $’000
2017 $’000
2018 $’000
2017 $’000
Carrying amount at 1 July 2,307 2,320
6,751 7,122 117,930 122,165 37 37 737 Acquisitions - - - - 5,312 6,026 - -
Disposals - (13) - - - - - -
Revaluation increments in asset revaluation reserve
- - 424 - - - - -
Transfers between classes - - - 217 - - - -
Depreciation - - (264) (588) (4,948) (10,261) - -
Total carrying amount at reporting date
2,307 2,307 6,911 6,751 118,294 117,930 37 37
Gross 2,307 2,307 20,141 18,902 145,746 140,435 37 37
Less: Accumulated depreciation - - (13,230) (12,151) (27,452) (22,505) - -
Less: Accumulated impairment losses - - - - - - - -
Total carrying amount at reporting date
2,307 2,307 6,911 6,751 118,294 117,930 37 37
Opening balance of asset revaluation surplus by class
39,043 39,043 6,815 6,815 - - 64 64
Revaluation increment - - 424 - - - - -
Closing balance of asset revaluation surplus by class 39,043 39,043 7,239 6,815 - -
64
64
Refer to note 34(i) to (r) for the department’s property, plant and equipment accounting policies.
Infrastructure Plant and equipment Capital works in progress
Total
2018 $'000
2017 $'000
2018 $’000
2017 $’000
2018 $’000
2017 $’000
2018 $’000
2017 $’000
Carrying value at 1 July 9,806 10,148 45,715 47,068 536 217 183,082 189,078
Acquisitions - - 2,019 8,590 202 770
7,533 15,386
Disposals - - (67) (118) - - (67) (131) (131) Revaluation increments in asset
revaluation reserve - - - - - - 424 -
Transfers between classes - - - 234 - (451) - -
Depreciation (154) (342) (4,827) (10,059) - - (10,193) (21,251)
Total carrying amount at reporting date
9,652 9,806 42,840 45,715 738 536 180,779 183,082
Gross 15,987 15,987 135,165 138,304 738 536 320,121 316,508
Less: Accumulated depreciation (6,335) (6,181) (92,311) (92,575) - - (139,328) (139,328)
(133,412)
Less: Accumulated impairment losses - - (14) (14) - - (14) (14)
Total carrying amount at reporting date
9,652 9,806 42,840 45,715 738 536 180,779 183,082
Opening balance of asset revaluation surplus by class
1,771 1,771 - - - - 47,693 47,693
Revaluation increment - - - - - - 424 -
Closing balance of asset revaluation surplus by class
1,771 1,771 - - - - 48,117 47,693

PART B Department of Science, Information Technology and Innovation
Notes to the final financial statements for the period 1 July 2017 to 12 December 2017
Annual Report 2017–18 | Department of Science, Information Technology and Innovation 21
17. Property, plant and equipment (continued)
Basis of fair values
Categorisation of fair values Level 2
$'000
Level 3
$'000
Total carrying amount
$'000
2018 $’000
2017 $’000
2018 $’000
2017 $’000
2018 $’000
2017 $’000
Land 2,307 2,307 - - 2,307 2,307
Buildings - - 6,911 6,751 6,911 6,751
Heritage and cultural assets - - 37 37 37 37
Infrastructure - - 9,652 9,806 9,652 9,806
There were no movements between levels from 1 July 2017 to 12 December 2017. Refer note 35(o).
Land
Science controls land at Deagon and at Deception Bay with a total fair value as at 12 December 2017 of $2.3
million. This land was subject to an independent desktop valuation by State Valuation Services (SVS) as at the
effective date of 1 December 2017. The fair value of the land was based on publicly available data on sales of
similar land in nearby localities. In determining the values, adjustment was made to the sales data to take into
account the location of the land, its size, street/road frontage and access, the nature of the buildings on the land,
development potential and any significant restrictions.
As at the reporting date there was a component of land pending transfer (i.e. 2,434 square metres) to the
Brisbane City Council for the Gateway Upgrade North project valued at $0.036 million.
The appraised fair value of the land as per the SVS valuation was not considered materially different from the
carrying value of the land as at 12 December 2017. Therefore no subsequent change in value was recognised
during the period ended 12 December 2017. The fair value of the land at Deception Bay, which is considerably
smaller in size, remained unchanged.
Buildings
Science controls buildings situated at Deagon and at the Brisbane Herbarium, Mt Coot-tha Road, Toowong. The
effective date of the last specific appraisal of these assets was 30 June 2014, by SVS. The fair value was
determined using a current replacement cost approach (due to no active market for such facilities).
The inputs (key estimates) to the valuations were internal records of the original cost of the specialised fit out,
adjusted for more contemporary design/construction approaches, and published construction rates for various
standard components of the buildings. Significant judgement is also used to assess the remaining service
potential of the facility, given local climatic and environmental conditions and records of the current condition of
the facility.
Subsequent to 30 June 2014, the department has assessed the need to revalue these assets each year using
relevant market-based indices provided by SVS and derived from the data consistent with the last specific
appraisal.
During the period ended 12 December 2017, the fair values of the building assets were updated using the
indexation provided by SVS for the cumulative material change in the indices between 30 June 2016 (when
indexation was last applied) and 12 December 2017, an increase of 6.6 percent in the assessed Building Price
Index (BPI).
The BPI is a market based index, compiled and reviewed to reflect current construction trends. Sourced through
analysis of recent tender results, the BPI enables moderation of estimates to account for market trends. The BPI
takes into consideration publically available industry data from sources such as the Reserve Bank of Australia,
Australian Bureau of Statistics and other notable financial and building publications.

PART B Department of Science, Information Technology and Innovation
Notes to the final financial statements for the period 1 July 2017 to 12 December 2017
22 Annual Report 2017–18 | Department of Science, Information Technology and Innovation
17. Property, plant and equipment (continued)
The department assessed that the cumulative increase of 6.6 percent in the assessed BPI from 30 June 2016 to
12 December 2017 was more than the 5 percent Queensland Treasury Non-Current Asset Policy (NCAP)
guideline for materiality. Accordingly, an indexation of 6.6 percent was applied to the carrying value of the assets
in the building asset class as at reporting date.
Infrastructure
Infrastructure assets in this asset class are controlled by Science and largely comprise the State of Queensland's
proportionate share (25%) of the Tweed River Entrance Sand Bypassing Project (TRESBP) infrastructure assets.
The TRESBP infrastructure assets comprise approximately 98 percent of the infrastructure asset class by
carrying value as at the reporting date.
In June 2017, Gray Robinson & Cottrell Quantity Surveyors (GRC) were engaged by the State of New South
Wales to undertake a comprehensive revaluation of the TRESBP infrastructure asset as at 30 June 2017. GRC
applied a cost approach method (i.e. current replacement cost) in determining the fair value of the asset (due to
no active market for such facilities). As at 30 June 2017, the variance between the assessed fair value and
carrying value of the infrastructure asset was less than 1 percent.
The indexation report provided by SVS, indicated a 2.1 percent increase in the BPI from 30 June 2017 (since the
last comprehensive valuation) to 12 December 2017. The increase on the carrying value as at reporting date was
not considered material as it was under the 5 percent NCAP guideline for materiality for indexation. Hence no
subsequent change in value has been recognised during the period ended 12 December 2017.
The inputs (key estimates) to the valuations were internal records of the original cost of the infrastructure,
adjusted for contemporary technology and construction approaches. Significant judgement is also used to assess
the remaining service potential of the facility, given local climatic and environmental conditions and records of the
current condition of the facility.
Heritage and cultural assets
Heritage and cultural assets include works of art controlled by Science.
The effective date of the last specific appraisal of the heritage and cultural assets was 30 June 2015 by MacAulay
Partners. There was no significant change to the valuation of the heritage and cultural assets.
The valuation was based on sales prices achieved for artworks of similar quality by the artist, or where there are
no recent sales for a particular artist, by an artist of equivalent stature.
Subsequent to 30 June 2015, the heritage and cultural assets have not been subject to an official revaluation or
indexation, as the asset values are considered to be immaterial.
Leased assets
The State of Queensland (through the department) entered into a service agreement with a telecommunication
service provider in September 2013 to have provisioned, operated and maintained a digital radio network known
as the Government Wireless Network (GWN). Under the agreement, the State gained progressive control over
infrastructure and equipment during various roll-out stages of the GWN that were undertaken between June 2014
and finalised in December 2015. As each roll-out stage was commercially accepted, the State gained control over
the GWN equipment acquired, through the State’s exclusive ‘right to use’ over the equipment provisioned under
the GWN agreement.

PART B Department of Science, Information Technology and Innovation
Notes to the final financial statements for the period 1 July 2017 to 12 December 2017
Annual Report 2017–18 | Department of Science, Information Technology and Innovation 23
17. Property, plant and equipment (continued)
The State gained control over an additional $4.472 million in exclusive ‘right to use’ assets from 1 July 2017 to 12
December 2017 representing additional infrastructure and equipment acquired to support the GWN facility. The
gross carrying value of the leased assets was determined using valuation techniques, specifically the present
value of future payments under the service agreement attributable to these assets. A comparison was made to
the fair value of the assets in reference to representations made by the telecommunication service provider in
January 2018 (refer to note 19).
In relation to additional ‘right to use’ assets acquired from 1 July 2017 to 12 December 2017, the department
gained a ‘right to receive’ replacement equipment over the life of the agreement.
This ‘right to receive’ replacement of exclusive assets has been recognised as a leased asset. The value of the
assets acquired from 1 July 2017 to 12 December 2017 of $0.840 million was determined using a valuation
technique, specifically the present value of all future payments under the service agreement attributable to the
‘right to receive’ replacement assets.
Change in useful lives
The approximate decrease in depreciation and amortisation expense as a result of the re-assessment of the useful lives of depreciable assets during the reporting period was:
2018 $'000
2017 $'000
Intangible assets - 403
Property, plant and equipment - 469
18. Payables
Trade creditors and accruals 46,556 47,462
Deferred appropriation payable to consolidated fund 1,206 -
Payroll tax 59 164
Other 17 23
Total 47,838 47,649
Accounting policy Trade creditors are recognised upon receipt of the goods or services ordered and are measured at the nominal amount i.e. agreed purchase/contract price, gross of applicable trade and other discounts. Amounts owing are unsecured and are generally settled on 30 days’ terms or as otherwise agreed with the vendor.
2018
2017

PART B Department of Science, Information Technology and Innovation
Notes to the final financial statements for the period 1 July 2017 to 12 December 2017
24 Annual Report 2017–18 | Department of Science, Information Technology and Innovation
Commitments under finance leases at reporting date are inclusive of anticipated GST and are payable as follows:
Not later than one year 15,931 14,542
Later than one year and not later than five years 75,490 72,493
Later than five years 71,347 75,637
Minimum payments 162,768 162,672 Less: Anticipated input tax credits (14,796) (14,788)
Less: Future finance charges (24,818) (25,811)
Total present value of minimum lease payments 123,154 122,073
Finance Lease The department has entered into a finance lease with a telecommunication service provider as a means of funding the acquisition and replacement of information and communications equipment, in support of the establishment of the GWN. Lease payments are fixed. The department has options to purchase this equipment at the expiry of the lease period, at an agreed cost determined in reference to a reasonable written down value of the equipment at termination date. Capitalised leased assets are depreciated over the estimated useful life of the asset which equates to the original lease terms between 11 and 14 years. The department has used valuation techniques, based on data provided by the telecommunication service provider, to disaggregate total payments made to the telecommunication service provider between those payments attributable to repayment of the finance lease and those payments relating to operational services which are expensed. Interest on the finance lease is recognised as an expense as it accrues on the outstanding lease liability using an implicit interest rate of between 2.980% and 3.343% (2017: 3.006% and 3.343%). Lease liabilities are effectively secured as the rights to the leased assets revert to the lessor in the event of default. The finance lease does not have escalation clauses other than in the event of payment default. No lease arrangements create restrictions on other financing transactions. Borrowings
CITEC has an overdraft facility with QTC with an approved credit limit of $5 million. The facility remains undrawn at 12 December 2017 and is available for use in the next reporting period. The current overdraft interest rate is 1.80% (30 June 2017: 1.80%). Finance/borrowing costs incurred in respect to the interest-bearing liabilities are as follows: Interest on borrowings - 13
Finance lease charges 1,955 4,330
Total 1,955 4,343
Accounting policy Finance costs are recognised as an expense in the period in which they are incurred. Finance costs include interest on bank overdrafts and short-term and long-term borrowings; finance lease charges and ancillary administration charges. No borrowing costs are capitalised into qualifying assets.
19. Interest-bearing liabilities $'000 $'000
Current
Finance lease liability 10,157 9,106
Total 10,157 9,106
Non-Current
Finance lease liability 112,997 112,967
Total 112,997 112,967

PART B Department of Science, Information Technology and Innovation
Notes to the final financial statements for the period 1 July 2017 to 12 December 2017
Annual Report 2017–18 | Department of Science, Information Technology and Innovation 25
20. Accrued employee benefits
2018 $'000
2017 $'000
Annual leave levy payable 4,690 5,599
Long service leave levy payable 970 1,165
Salaries, wages and other related expenses outstanding 260 4,382
Total 5,920 11,146
Accounting policy No provision for annual leave or long service leave is recognised in the department’s financial statements as the liability is held on a whole-of-Government basis and reported in those financial statements pursuant to AASB 1049 Whole-of-Government and General Government Sector Financial Reporting.
21. Other current and non-current liabilities
Current
Unearned revenue 4,515 3,637
Lease incentives 499 529
Prepaid deposits 227 629
Total 5,241 4,795
Non-Current
Unearned revenue 33 98
Lease incentives 2,587 3,144
Total 2,620 3,242

PART B Department of Science, Information Technology and Innovation
Notes to the final financial statements for the period 1 July 2017 to 12 December 2017
26 Annual Report 2017–18 | Department of Science, Information Technology and Innovation
22. Key management personnel and remuneration expenses
a) Key management personnel (KMP)
As from 2016–17, the department’s responsible Minister is identified as part of the department’s KMP, consistent with additional guidance included in the revised version of AASB 124 Related Party Disclosures. That Minister is the Minister for Innovation, Science and the Digital Economy and Minister for Small Business. The following details for non-Ministerial KMP reflect those departmental positions that had authority and responsibility for planning, directing and controlling the activities of the department during current and comparative reporting period. Further information about these positions can be found in the body of the Annual Report under the section relating to Executive Management.
Position Position responsibilities
Director-General Overall efficient, effective and economic administration of the department.
Queensland Government Chief
Information Officer
Provides unbiased, independent quality advice to the Director-General and Minister for Innovation,
Science and the Digital Economy and Minister for Small Business on ICT issues from a whole-of-
Government perspective.
Queensland Chief Scientist Provides strategic advice to government on harnessing science and innovation to support the
government’s objectives and activities.
Assistant Director-General, Digital
Productivity and Services
Leads the Digital Productivity and Services Division to revitalise Queensland Government services,
increase Queensland’s digital capability, preserve and improve access to Queensland’s record-related
information, and enhance the customer experience with the Queensland Government. The division
contributes to the Queensland Government’s objectives for the community, and supports Advance
Queensland to deliver quality frontline services, job creation and a diverse economy.
Assistant Director-General,
Queensland Shared Services
Ensuring high quality, integrated service delivery for a range of corporate transactional and advisory
services across 24 Queensland Government departments and agencies. The role is also responsible for
managing the key financial and human resource management/payroll technology solutions that support
agencies and underpins its service delivery.
Assistant Director-General, Science Leads the Science Division in providing scientific and technical advice and services to government
agencies across the natural resources and environmental spectrum that underpin their decision-making
and legislative responsibilities. The division, in close collaboration with the Queensland Chief Scientist,
also provides strategic leadership for the government’s investment in science and research, and
develops Queensland Government science policy.
Deputy Director-General, Strategy and
Innovation
Leading the innovation agenda for the department and at a whole-of-Government level, with a primary
focus on driving economic growth and job creation in Queensland through innovation. The role leads the
implementation of the Queensland Government’s Advance Queensland agenda.
Assistant Director-General, Strategic
ICT
Leads the Strategic ICT Division to support, deliver, guide and advise on whole-of-Government ICT
initiatives that enable modern, responsive and integrated frontline services for Queenslanders.
Deputy Director-General, Corporate* Strategic leadership of the department’s corporate services including finance, procurement, information
management and technology, communications and engagement, strategic planning, human resources,
and legal and integrity services.
Chief Finance Officer Provides overall stewardship of the department’s finances and assuring tight financial integration and
accountability to enable the department to meet corporate governance and statutory compliance
requirements.
* The Chief Change and Operations Officer role was renamed to Deputy Director-General, Corporate effective 7 June 2017.
b) Remuneration policies

PART B Department of Science, Information Technology and Innovation
Notes to the final financial statements for the period 1 July 2017 to 12 December 2017
Annual Report 2017–18 | Department of Science, Information Technology and Innovation 27
Ministerial remuneration entitlements are outlined in the Legislative Assembly of Queensland’s Members’
Remuneration Handbook. The department does not bear any costs of remuneration of Ministers. The majority of
Ministerial entitlements are paid by the Legislative Assembly, with the remaining entitlements being provided by
Ministerial Services Branch within the Department of the Premier and Cabinet. As all Ministers are reported as
KMP of the Queensland Government, aggregate remuneration expenses for all Ministers is disclosed in the
Queensland General Government and whole-of-Government Consolidated Financial Statements, which are
published as part of the Queensland Treasury’s Report on State Finances.
Remuneration policy for the department's other KMP is set by the Queensland Public Service Commission as
provided for under the Public Service Act 2008. Individual remuneration and other terms of employment (including
motor vehicle allowances) are specified in employment contracts.
Remuneration expenses for those KMP comprise the following components:
Short-term employee expenses which include:
• salaries, allowances and leave entitlements earned and expensed for the entire year, or for that part of
the year during which the employee occupied a KMP position; and
• nonmonetary benefits – consisting of provision of car parking benefits together with fringe benefits tax
applicable to the benefit.
Long-term employee expenses include amounts expensed in respect of long service leave entitlements earned.
Post-employment expenses include amounts expensed in respect of employer superannuation obligations.
Termination benefits include payments in lieu of notice on termination and other lump sum separation entitlements (excluding annual and long service leave entitlements) payable on termination of employment or acceptance of an offer of termination of employment.
c) Remuneration expenses
The following disclosures focus on the expenses incurred by the department attributable to non-Ministerial KMP
during the respective reporting periods. The amounts disclosed are determined on the same basis as expenses
recognised in the Statement of Comprehensive Income.
1 July 2017 to 12 December 2017 Short-term employee expenses
Long-term employee expenses
Post-employment
expenses
Total expenses
Position Monetary expenses
$'000
Non monetary benefits $'000
$'000
$'000
$'000
Director-General 173 4 4 21 202
Queensland Government Chief Information Officer 161 3 3 18 185
Queensland Chief Scientist* 131 - 3 14 148
Acting Queensland Chief Scientist (from 25 July
2017) 90 3 2 9 104
Assistant Director-General, Digital Productivity
and Services 96 3 2 13 114
* The Queensland Chief Scientist was placed on special leave from 25 July 2017, remuneration expenses includes leave payments paid up to 12
December 2017. The position of the Queensland Chief Scientist was undertaken by another officer under an acting arrangement from this date.
c) Remuneration expenses (continued)

PART B Department of Science, Information Technology and Innovation
Notes to the final financial statements for the period 1 July 2017 to 12 December 2017
28 Annual Report 2017–18 | Department of Science, Information Technology and Innovation
1 July 2017 to 12 December 2017 Short-term employee Expenses
Long-term employee expenses
Post-employment
expenses
Total expenses
Position Monetary expenses
$'000
Non monetary benefits $'000
$'000
$'000
$'000
Assistant Director-General, Queensland Shared
Services 108 4 2 12 126
Assistant Director-General, Science (to 24 July 2017) 18 - - 2 20
Acting Assistant Director-General, Science (from 25
July 2017) 70 3 1 6 80
Deputy Director-General, Strategic and Innovation 106 4 2 13 125
Chief Finance Officer 88 3 2 9 102
Acting Chief Finance Officer (31 July to 8 September
2017) 21 1 - 1 23
Assistant Director-General, Strategic ICT 109 3 2 12 126
Deputy Director-General, Corporate 96 3 2 12 113
Total remuneration 1,267 34 25 142 1,468
1 July 2016 to 30 June 2017 Short-term employee expenses
Long-term employee expenses
Post-employment
expenses
Total expenses
Position Monetary expenses
$'000
Non monetary benefits $'000
$'000
$'000
$'000
Director-General 357 8 7 46 418
Queensland Government Chief Information Officer 331 7 7 37 382
Queensland Chief Scientist (to 16 December 2016) 162 - 3 17 182
Queensland Chief Scientist (from 12 December
2016) 152 2 3 16 173
Assistant Director-General, Digital Productivity and
Services 252 7 5 27 291
Assistant Director-General, Queensland Shared
Services 243 11 5 25 284
Assistant Director-General, Science 186 8 3 24 221
Deputy Director-General, Strategic and Innovation 238 8 5 27 278
c) Remuneration expenses (continued)

PART B Department of Science, Information Technology and Innovation
Notes to the final financial statements for the period 1 July 2017 to 12 December 2017
Annual Report 2017–18 | Department of Science, Information Technology and Innovation 29
1 July 2016 to 30 June 2017 Short-term employee expenses
Long-term employee expenses
Post-employment
expenses
Total expenses
Position Monetary expenses
$'000
Non monetary benefits $'000
$'000
$'000
$'000
Chief Finance Officer 180 8 3 19 210
Assistant Director-General, Strategic ICT 236 7 5 25 273
Chief Change and Operations Officer, Change and
Operations 224 7 4 26 261
Total remuneration 2,561 73 50 289 2,973
d) Performance payments
No KMP remuneration packages provide for performance or bonus payments. Accounting policy KMP and remuneration disclosures are made in accordance with section 3 of the Financial Reporting Requirements for Queensland Government agencies issued by Queensland Treasury.
23. Related party transactions
(a) Transactions with people/entities related to KMP
There were no transactions identified between the department and related parties of the department’s KMP.
(b) Transactions with other Queensland Government-controlled entities
The department’s primary ongoing sources of funding from Queensland Government for its services are appropriation revenue and equity injections, both of which are provided in cash via Queensland Treasury, refer note 5. The majority of user charges earned by the department’s CBU and SSP are generated from the sale of services to Queensland Government departments, refer note 6. Note 34 outlines the transfer of assets and liabilities from the department to other Queensland Government departments arising from machinery-of-Government changes as a result of the Public Service Departmental Arrangements Notice (No3) 2017.

PART B Department of Science, Information Technology and Innovation
Notes to the final financial statements for the period 1 July 2017 to 12 December 2017
30 Annual Report 2017–18 | Department of Science, Information Technology and Innovation
24. Reconciliation of cash flows
(a) Reconciliation of operating result to net cash provided by/(used in)
operating activities
2018 $'000
2017 $'000
Operating result from continuing operations after income tax 663 4,544
Non-cash items included in operating result:
Depreciation and amortisation expense 12,940 28,616
Donated assets and services expensed 12 (696)
Donated assets and services received (129) -
Doubtful debts written off or provided for - (47)
Amortisation of lease incentive liability (579) (154)
Loss on sale or disposal of non-current assets 67 22
Gains on sale or disposal of non-current assets (4) (4)
Impairment loss reversal (28) (41)
Change in assets and liabilities:
(Increase)/decrease in net receivables (17,429) 8,575
(Increase)/decrease in interest receivable 5 7
(Increase)/decrease in prepayments 2,057 (4,729)
Increase/(decrease) in unearned revenue 813 2,124
Increase/(decrease) in accrued employee benefits (5,226) 911
Increase/(decrease) in payables 903 (2,693)
Increase/(decrease) in other liabilities (8) (19)
Increase/(decrease) in deferred tax liabilities (306) (620)
(Increase)/decrease in GST input tax credits receivable 2,611 (1,344)
Increase/(decrease) in GST payable (709) 455
Net cash provided by/(used in) operating activities (4,347) 34,907
(b) Changes in liabilities arising from financing activities
Liability
Closing balance 2017*
$’000
New leases acquired (non-cash)
$’000
Movement in payables (non-cash)
$’000
Cash repayments
$’000
Closing balance 2018*
$’000
Finance leases 122,073 5,312 344 (4,575) 123,154
* Refer also note 19.
25. Operating lease and capital commitments
a) Non-cancellable operating lease commitments
Commitments under operating leases at reporting date (inclusive of non-recoverable GST input tax credits) are payable as follows:
Not later than one year 56,338 51,866
Later than one year and not later than five years 70,658 51,510
Later than five years 49,183 20,024
Total 176,179 123,400
Operating leases are entered into primarily as a means of acquiring access to office accommodation and storage facilities and extend over terms between five and ten years. Most leases contain renewal clauses, but no purchase options exist in relation to operating leases and no leases contain restrictions on financing, or other leasing activities. Where such renewal options exist, they are all exercisable at market prices. No leases have escalation clauses other than in the event of payment default. Operating lease rental expenses comprise the minimum lease payments payable under operating lease contracts. Lease payments are generally fixed, but with annual inflation escalation clauses upon which future year rentals are determined.

PART B Department of Science, Information Technology and Innovation
Notes to the final financial statements for the period 1 July 2017 to 12 December 2017
Annual Report 2017–18 | Department of Science, Information Technology and Innovation 31
b) Non-cancellable operating lease commitments as sub-lessor 2018 $'000
2017 $'000
Commitments under operating leases at reporting date (inclusive of non-recoverable GST input tax credits) are receivable as follows:
Not later than one year 991 922
Later than one year and not later than five years 4,213 4,308
Later than five years 804 1,474
Total 6,008 6,704
The department leases property from a private landlord and sub-lets this property to various tenants. The leases have terms ranging from one to seven years.
c) Capital expenditure commitments
Material classes of capital expenditure commitments at reporting date (inclusive of non-recoverable GST input tax credits) are payable as follows: Plant and equipment
Payable:
Not later than one year 162 459
Total 162 459
26. Contingencies
a) Financial guarantees
CITEC has arranged bank guarantees in relation to business opportunities pursued as follows: Australian Securities and Investment Commission 550 550 State of Victoria 600 600 State of New South Wales 330 330 State of Western Australia 300 300 Insolvency and Trustee Service Australia 127 127
Total 1,907 1,907
The State of Queensland, acting through the department, has provided a guarantee to Translational Research Institute Pty Ltd with respect to the performance of the tenant, Patheon Biologics (formerly DSM Biologics (Australia) Pty Ltd), under the sublease of the Translational Research Institute Research Facility (formerly known as the Biopharmaceutical Australia Research Facility). The maximum liability under this guarantee is $9.991 million over the remaining 10.5 year term of the sublease. The liability is mitigated by the guarantee that the parent company of Patheon Biologics, DPx Holdings B.V (formerly Koninklijke N.V.), has provided to the State of Queensland, guaranteeing the performance of Patheon Biologics as tenant of the facility. No defaults have occurred and the department does not expect that the guarantee will be called upon. The guarantee is not recognised on the Statement of Financial Position, as the probability of default is remote. As financial guarantee contracts are measured in accordance with AASB 137 Provisions, Contingent Liabilities and Contingent Assets, the department has disclosed the details of the guarantee in this note, in addition to note 27(c) for full transparency purposes.

PART B Department of Science, Information Technology and Innovation
Notes to the final financial statements for the period 1 July 2017 to 12 December 2017
32 Annual Report 2017–18 | Department of Science, Information Technology and Innovation
b) Litigation in progress
As at 12 December 2017 no claims against the department have been filed in the courts. Effective 1 July 2012, the department joined the Queensland Government Insurance Fund (QGIF). Under the QGIF, the department would be able to claim back, less a $10,000 deductible, the amount paid to successful litigants. This includes any cases that existed as at 1 July 2012 and cases that have arisen since that date. CITEC has separate insurance arrangements. Under these arrangements, the department would be able to claim back, less a $5,000 deductible, the amount paid to successful litigants up to $50 million.
c) Contingent assets
A Deed of Funding commenced in 2014 whereby $6 million was held in trust with an information, communication and technology service provider for the Queensland Government (through the department) to purchase telecommunication products up until 31 August 2018. As at 12 December 2017, the Queensland Government has claimed $4.859 million against this facility. As the remaining funds of $1.141 million are held in trust by the provider, the department has no control over the assets, and as such, the assets have not been recognised in the financial statements as the assets do not meet the asset recognition criteria.
27. Financial instruments
a) Categorisation of financial instruments
The department has the following categories of financial assets and financial liabilities: Note
2018 $’000
2017 $’000
Financial assets Cash and cash equivalents 13 24,364 41,857
Receivables at amortised cost 14 62,875 47,910
Total 87,239 89,767
Financial liabilities
Financial liabilities measured at amortised cost:
Payables 18 47,838 47,649
Interest bearing liabilities - finance lease liability 19 123,154 122,073
Total 170,992 169,722
No financial assets and financial liabilities have been offset and presented as net in the Statement of Financial
Position. Financial assets and liabilities are recognised in the Statement of Financial Position when the
department becomes party to the contractual provisions of the financial instrument.
b) Financial risk management
The department’s activities expose it to a variety of financial risks - credit risk, liquidity risk and market risk.
Financial risk management is implemented pursuant to government and departmental policy. These policies focus
on the unpredictability of financial markets and seek to minimise potential adverse effects on the financial
performance of the department. Financial risk is managed by the Finance, Procurement and Business Services
unit and the Risk and Resilience unit of the department under policies approved by the department. The
department provides written principles for overall risk management, as well as policies covering specific areas.
The department measures risk exposure using a variety of methods as follows:
Risk exposure Measurement method
Credit risk Ageing analysis
Liquidity risk Sensitivity analysis
Market risk Interest rate sensitivity analysis

PART B Department of Science, Information Technology and Innovation
Notes to the final financial statements for the period 1 July 2017 to 12 December 2017
Annual Report 2017–18 | Department of Science, Information Technology and Innovation 33
c) Credit risk exposure
Credit risk exposure refers to the situation where the department may incur financial loss as a result of another
party to a financial instrument failing to discharge their obligation.
The maximum exposure to credit risk at balance date is the gross carrying amount of receivables, inclusive of any
allowance for impairment loss. The maximum exposure to credit risk in relation to guarantees is disclosed in note
26(a).
No collateral is held as security and no credit enhancements relate to receivables held by the department. The
department manages credit risk through the use of a credit management strategy. This strategy aims to reduce
the exposure to credit default by ensuring that the department invests in secure assets and monitors all funds
owed on a timely basis. Exposure to credit risk is monitored on an ongoing basis by assessing the collectability of
receivables within terms and past due.
The allowance for impairment reflects the occurrence of loss events. The most readily identifiable loss event is
where a debtor is overdue in paying a debt to the department, according to the due date (normally terms of 30
days). Economic changes impacting the department’s debtors, and relevant industry data, also form part of the
department’s documented risk analysis.
If no loss events have arisen in respect of a particular debtor or group of debtors, no allowance for impairment is
made in respect of that debtor/group of debtors. If the department determines that an amount owing by such a
debtor does become uncollectible (after an appropriate range of debt recovery actions), that amount is recognised
as a bad debt expense and written-off directly against receivables. In other cases where a debt becomes
uncollectible but the uncollectible amount exceeds the amount already allowed for impairment of that debt, the
excess is recognised directly as a bad debt expense and written-off directly against receivables. No receivables
have had their terms re-negotiated so as to prevent them from being past due, or impaired, and are stated at the
carrying amounts as indicated.
Impairment loss
Ageing of past due but not impaired, as well as impaired financial assets, are disclosed in the following tables:
Ageing of past due but not impaired receivables
2018 $’000
2017 $’000
Overdue
Less than 30 days 10,690 6,598
30–60 days 10,755 1,938
61–90 days 2,122 2
More than 90 days 1,808 3
Total 25,375 8,541

PART B Department of Science, Information Technology and Innovation
Notes to the final financial statements for the period 1 July 2017 to 12 December 2017
34 Annual Report 2017–18 | Department of Science, Information Technology and Innovation
Financial liabilities
The guarantees given by the department, referred to in note 26, meet the definition of a financial guarantee
contract under AASB 139 Financial Instruments: Recognition and Measurement. The maximum credit risk
exposure to the department, in relation to these guarantees, is $11.898 million (30 June 2017: $12.392 million).
The department assesses, on an annual basis, the fair value of the financial guarantees at reporting date. It has
been determined that the fair value is nil at 12 December 2017, due to the probability of default being remote with
respect to the financial guarantees held by the department. Accordingly, the fair value of the guarantees has not
been recognised on the Statement of Financial Position.
d) Liquidity risk
Liquidity risk refers to the situation where the department may encounter difficulty in meeting obligations
associated with financial liabilities that are settled by delivering cash, or another financial asset. The department is
exposed to liquidity risk in respect of its payables and borrowings from QTC, in relation to departmental service
delivery. The borrowings are based on the Queensland Government’s gazetted floating rate.
The department manages liquidity risk through the use of a liquidity management strategy. This strategy aims to
reduce the exposure to liquidity risk by ensuring that the department has sufficient funds available to meet
employee and supplier obligations as they fall due. This is achieved by ensuring that minimum levels of cash are
held within the various bank accounts, so as to match the expected duration of the various employee and supplier
liabilities.
The following tables set out the liquidity risk of financial liabilities held by the department. It represents the
contractual maturity of financial liabilities, calculated based on undiscounted cash flows relating to the liabilities at
reporting date. The undiscounted cash flows in these tables may differ from the amounts included in the
Statement of Financial Position that are based on discounted cash flows.
c) Credit risk exposure (continued)
2018 $’000
2017 $’000
Individually impaired receivables position (Aged)
Receivables (gross)
Less than 30 days 1 1
Less: Allowance for impairment (1) (1)
Carrying amount - -
30 to 60 days 1 1
Less: Allowance for impairment (1) (1)
Carrying amount - -
60 to 90 days - 15
Less: Allowance for impairment - (15)
Carrying amount - -
More than 90 days 23 33
Less: Allowance for impairment (23) (33)
Carrying amount - -
Total carrying amount - -
Movements in allowance for impairment loss for impaired receivables
Balance at 1 July
(50)
(88)
Amounts written-off during the year in respect of bad debts - 21
Amounts recovered during the year 28 41
(Increase)/decrease in allowance recognised in operating result (3) (24)
Balance at reporting date (25) (50)

PART B Department of Science, Information Technology and Innovation
Notes to the final financial statements for the period 1 July 2017 to 12 December 2017
Annual Report 2017–18 | Department of Science, Information Technology and Innovation 35
d) Liquidity risk (continued)
Financial liabilities
Note 2018 $’000
2017 $’000
Payables 18
Less than 1 year 47,838 47,649
Total 47,838 47,649
Lease liability 19
Less than 1 year 15,931 14,542
1 to 5 years 75,490 72,493
Later than 5 years 71,347 75,637
Total 162,768 162,672
Total financial liabilities
Less than 1 year 63,769 62,191
1 to 5 years 75,490 72,493
Later than 5 years 71,347 75,637
Total 210,606 210,321
e) Market risk
The department is exposed to market risk specifically through interest rate risk, which is the risk that the fair value
or future cash flows of a financial instrument will fluctuate because of changes in market interest rates. The
department is exposed to interest rate risk through cash deposited in interest-bearing accounts. The department
does not undertake any hedging in relation to interest rate risk and manages its risk as per its liquidity
management strategies.
f) Fair value
The carrying amount of financial liabilities are measured at amortised cost, which approximately equals their fair
value at reporting date.
Accounting policy Recognition Financial assets and financial liabilities are recognised in the Statement of Financial Position when the department becomes party to the contractual provisions of the financial instrument. Classification Financial instruments are classified and measured as follows: Cash and cash equivalents – held at fair value through profit or loss Receivables – held at amortised cost Payables – held at amortised cost Borrowings – held at amortised cost Finance leases – held at amortised cost The department does not enter into transactions for speculative purposes, nor for hedging. Apart from cash and cash equivalents, the department holds no financial assets classified at fair value through profit or loss.

PART B Department of Science, Information Technology and Innovation
Notes to the final financial statements for the period 1 July 2017 to 12 December 2017
36 Annual Report 2017–18 | Department of Science, Information Technology and Innovation
28. Taxation equivalents
Information in respect of income tax equivalent expense/(revenue) incurred by those activities of CITEC, subject
to the substantive model of the Tax Equivalents Regime:
Balance sheet approach 2018 $’000
2017 $’000
Major components of income tax equivalent expense/(revenue) for the reporting period ended 12 December 2017.
Income tax expense/(revenue)
Deferred income tax
(Decrease)/increase in deferred tax liability (306) (620)
Income tax equivalent expense/(revenue) reported in the Statement of Comprehensive Income
(306) (620)
Reconciliation of income tax equivalent expense/(revenue) to prima facie tax payable for the reporting period ended 12 December 2017 as follows:
Operating result from continuing operations before income tax of CITEC subject to Tax Equivalents Regime. (917) (2,207)
Indicative tax equivalent expense/(revenue) at 30% (275) (662) Tax effect of amounts which are not deductible/(assessable) in calculating taxable income:
Previously unrecognised temporary differences now recognised (59) (62)
Effect of unused tax losses and deductible temporary differences not recognised 28 104
Income tax equivalent expense/(revenue) reported in the Statement of Comprehensive Income (306) (620)
Deferred tax liabilities
The balance comprises temporary differences attributable to amounts
recognised in the Statement of Comprehensive Income:
Interest receivable 8 9
Assets and other 591 896
Deferred tax liabilities taken to account 599 905
Deferred tax assets not recognised
Income tax losses 19 46
Accrued employee benefits & payables 9 58
Total 28 104
A review of CITEC's budget estimates for the future years indicate that sufficient taxable profit will not be
available, following the reversal of existing taxable temporary differences, for the current period's tax loss and
deductible temporary differences to be utilised in future periods. Accordingly, the current tax loss for the period
and net deductible temporary differences, the tax effect of which totals to $27,705, has not been recognised as
deferred tax assets. The unrecognised income tax losses will be brought to account when it is probable that
further tax profits will arise to enable these tax losses to be utilised.
Accounting policy The department is a State body as defined under the Income Tax Assessment Act 1936 and is exempt from all forms of Commonwealth taxation except Fringe Benefits Tax (FBT) and Goods and Services Tax (GST). FBT and GST are the only taxes accounted for by the department. GST credits receivable from, and GST payable to, the Australian Taxation Office are recognised and accrued (refer to note 14).

PART B Department of Science, Information Technology and Innovation
Notes to the final financial statements for the period 1 July 2017 to 12 December 2017
Annual Report 2017–18 | Department of Science, Information Technology and Innovation 37
28. Taxation equivalents (continued)
Accounting policy Agreements have been reached with Queensland Treasury for CITEC to pay an income tax equivalent, in accordance with the requirements of the Tax Equivalents Regime. The income tax equivalent expense for CITEC is calculated based on the Balance Sheet approach under which temporary differences are identified for each asset and liability. The tax effect of timing differences, which arise from items being brought to account in different periods for income tax and accounting purposes, is recognised in the Statement of Financial Position as a tax asset or a tax liability. Tax assets are not brought to account unless realisation of the asset is probable. Tax assets relating to CITEC’s tax losses are only brought to account to the extent that future profits are probable. Recovery of deferred tax assets is primarily based on projected operational results outlined in the forecasting budgets provided to Queensland Treasury.
29. Budgetary reporting disclosures
Explanations of major variances
Statement of comprehensive income
Following machinery-of-Government changes outlined in note 2 and as required by Queensland Treasury policy
under such circumstances, the budget figures used in these final financial statements reflect the unadjusted,
original budget for the full 2017-18 financial year as published in the latest Service Delivery Statement tabled in
Parliament. The major variances between year-to-date actuals and original budget are largely addressed by those
transasctions budgeted post 12 December 2017 other than identifiable variations not connected to post 12
December 2017 budgeted transasctions as detailed below.
Supplies and services and total comprehensive income
Supplies and services is lower than original budget due to the deferral of $10 million in budgeted operating
expenditure and associated funding for the Human Resource Information System Project to better align with the
projects milestones and funding requirements.
Operating result from continuing operations
The variance in the operating result from continuing operations after income tax is mainly due to an improvement
in the operating result of CITEC by $11 million and Queensland Shared Services by $1 million as a result of an
increase in customer demand for services delivered by these business units and lower service delivery costs
compared to original budget estimates.
Statement of financial position
Receivables
Receivables are higher than budget by $22 million mainly due to timing differences in the recovery of Queensland
Shared Service's and CITEC billings to clients between 12 December 2017 and the end of the month.
Other non-current assets and other non-current liabilities
Other non-current liabilities are below budget by $8 million due to the derecognition of lease incentive liabilities
which had not been reflected within the budget.
Payables
Payables are higher than budget by $8 million mainly due to the timing of payables held between 12 December
2017 and end of month.

PART B Department of Science, Information Technology and Innovation
Notes to the final financial statements for the period 1 July 2017 to 12 December 2017
38 Annual Report 2017–18 | Department of Science, Information Technology and Innovation
29. Budgetary reporting disclosures (continued)
Statement of cash flows
Net cash provided by/(used in) operating activities
Supplies and services is lower than original budget due to the deferral of $10 million in budgeted operating
expenditure and associated funding for the Human Resource Information System Project to better align with the
projects milestones and funding requirements.
Net cash used in investing activities
Payments for non-financial assets are lower than original budget by $8 million mainly due to higher acquisitions
budgeted for the later half of the 2017-18 financial year associated with CITEC’s capital program and the
Accelerated Science Delivery Innovation Program.
Net cash used in financing activities – equity injections
Equity Injections are lower than original budget by $9 million mainly due to timing differences in the drawdown of
funding for Government Wireless Network leased asset.
Net cash used in financing activities – equity withdrawals
Equity Withdrawals are lower than original budget by $9 million mainly due to timing differences in return of funds
to Consolidated Fund for state funded depreciation expenses.

PART B Department of Science, Information Technology and Innovation
Notes to the final financial statements for the period 1 July 2017 to 12 December 2017
Annual Report 2017–18 | Department of Science, Information Technology and Innovation 39
30. Schedule of administered items
2018
Actual
$'000
2018
Original
Budget
$'000
Budget
Variance*
$’000
2017
Actual
$'000
Administered income
Appropriation revenue** 35,383 78,504 (43,121) 69,309
Contributions 3,496 - 3,496 9,181
Total administered income 38,879 78,504 (39,625) 78,490
Administered expenses
Supplies and services 5,645 11,392 (5,747) 6,663
Grants and subsidies 31,789 71,213 (39,424) 65,875
Total administered expenses 37,434 82,605 (45,171) 72,538
Operating result 1,445 (4,101) 5,546 5,952
Administered current assets
Cash and cash equivalents 5,001 1,246 3,755 914
Loans and receivables 2,507 - 2,507 901
Prepayments 4,101 13,670 (9,569) 4,101
Total administered current assets 11,609 14,916 (3,307) 5,916
Administered non-current assets
Prepayments 11,620 - 11,620 13,670
Total administered non-current assets 11,620 - 11,620 13,670
Total administered assets 23,229 14,916 8,313 19,586
Administered current liabilities
Payables 2,765 - 2,765 569
Total administered current liabilities 2,765 - 2,765 569
Net administered assets 20,464 14,916 5,548 19,017
Total administered equity 20,464 19,017
* An explanation of major variances is included at note 32.
** This appropriation revenue is provided in cash via Queensland Treasury and funds activities/expenses that the department
administers on behalf of the government, refer note 31.
Administered grants and subsidies
2018 $'000
2017 $'000
State Library of Queensland 29,374 62,676
Queensland Shared Services 2,415 3,199
Total 31,789 65,875
Accounting Policy The department administers, but does not control, certain activities on behalf of the government. In doing so, it has responsibility for administering those activities (and related transactions and balances) efficiently and effectively, but does not have the discretion to deploy those resources for the achievement of the department’s overall objectives. These transactions and balances are not significant in comparison to the department’s overall financial performance/financial position. Accounting policies applicable to administered items are consistent with the equivalent policies for controlled items, unless stated otherwise.

PART B Department of Science, Information Technology and Innovation
Notes to the final financial statements for the period 1 July 2017 to 12 December 2017
40 Annual Report 2017–18 | Department of Science, Information Technology and Innovation
31. Administered appropriation receipts
Reconciliation of payments from consolidated fund to administered appropriation revenue*
2018 $'000
2017 $'000
Budgeted administered appropriation 78,504 73,945
Lapsed administered appropriation - (6,632)
Transfer to administered equity adjustment 569 -
Transfers to other departments (s79 machinery-of-government transfers)
Department of Environment and Science (34,373) -
Department of Housing and Public Works (11,825) -
Total administered appropriation receipts (cash) 32,875 67,313
Plus: Closing balance of administered appropriation receivable 2,508 -
Plus: Opening balance of deferred administered appropriation payable - 1,996
Administered appropriation revenue recognised in note 30 35,383 69,309
Reconciliation of payments from consolidated fund to administered equity adjustment*
Budgeted administered equity adjustment appropriation - (3,627)
Lapsed administered appropriation - (332)
Transfer from administered equity adjustment (569) -
Total administered appropriation receipts (cash) (569)
(3,959)
Plus: Opening balance of administered equity adjustment payable 569 523
Less: Closing balance of administered equity adjustment payable - (569)
Equity adjustment recognised in administered equity - (4,005)
* The individual balances reported above have been re-stated from a previous version of the financial statements
prepared and certified by management, refer Note 35(u) which describes the basis of the revision of the financial
report.
32. Administered budget to actual comparison and variance analysis
Explanations of major variances
Statement of comprehensive income and statement of cashflows
Following machinery-of-Government changes outlined in note 2 and as required by Queensland Treasury policy
under such circumstances, the budget figures used in these final financial statements reflect the unadjusted,
original budget for the full 2017-2018 financial year as published in the latest Service Delivery Statement tabled in
Parliament. The major variances between year-to-date actuals and original budget relating to the Statement of
Comprehensive Income and Statement Cashflows are largely addressed by those transactions budgeted post 12
December 2017 other than identifiable variations not connected to post 12 December 2017 budgeted transactions
as detailed below.
Grants and other contributions
Grants and other contributions includes contributions from Queensland Treasury Commercial Group for the ICT
arrangements for 1 William Street (1WS) building of $3.5 million which was not included in budget estimates.
Operating result
The variance of $5.5 million is due to the timing difference between the recognition of contribution revenue
received to fund the ICT arrangements for 1WS and recognition of expense associated with service payments
made to an ICT provider over a five-year contract term.

PART B Department of Science, Information Technology and Innovation
Notes to the final financial statements for the period 1 July 2017 to 12 December 2017
Annual Report 2017–18 | Department of Science, Information Technology and Innovation 41
32. Administered budget to actual comparison and variance analysis (continued)
Statement of financial position
Prepayments (current and non-current)
The variance in prepayments of $11.6 million is due to the classification of prepayments associated with 1WS ICT
arrangements recognised as current, and not disaggregated between current and non-current within the budget
estimates.
33. Agency transactions and balances
The department, through the Smart Service Queensland business unit, acts as an agent for collection and payment processing services, and undertakes certain transactions on behalf of Queensland Government agencies and its clients.
2018 $'000
2017 $'000
Agency cash assets
Balance at 1 July 437 471
Collections during the period 33,129 77,504
Distributions according to clients’ instructions during the period (33,323) (77,538)
Balance at reporting date 243 437
Fees received for the provision of these services are included in user charges. All agency transactions and balances are subject to audit by the Queensland Audit Office. Accounting policy The transactions and balances related to these agency arrangements are not included in these financial statements, because the department acts only in a custodial role but are disclosed in these notes for the information of users.

PART B Department of Science, Information Technology and Innovation
Notes to the final financial statements for the period 1 July 2017 to 12 December 2017
42 Annual Report 2017–18 | Department of Science, Information Technology and Innovation
34. Machinery-of-government transfers
As a result of the Public Service Departmental Arrangements Notice (No3) 2017, responsibility for all functions of
the department were transferred as follows:
• Science including the Office of the Queensland Chief Scientist was transferred to the Department of
Environment and Science (DES).
• One-Stop Shop Strategy and Implementation office, Queensland Government Chief Information Office,
Digital Economy and Productivity were transferred to the Department of the Premier and Cabinet (DPC).
• Smart Service Queensland, Queensland State Archives, Strategic ICT including CITEC and Queensland
Shared Services were transferred to the Department of Housing and Public Works (HPW).
• Innovation was transferred to the Department of Innovation, Tourism Industry Development and the
Commonwealth Games (DITID).
As a result of these changes, the following assets and liabilities were transferred.
HPW - CITEC (CBU)
$'000
HPW - Queensland Shared Services (SSP)
$'000
DES
$'000
Assets
Cash and cash equivalents 14,663 8,380 (1,455)
Receivables 22,043 31,042 1,700
Intangible assets 2,384 24,998 1,644
Property, plant and equipment 7,895 587 46,783
Other assets 6,520 3,225 636
Total assets 53,505 68,232 49,308
Liabilities
Payables 14,952 9,902 4,374
Interest-bearing liabilities - - -
Accrued employee benefits 948 1,748 921
Deferred tax liabilities 599 - -
Other liabilities 992 3,576 -
Total liabilities 17,491 15,226 5,295
Net Assets 36,014 53,006 44,013
HPW – Other $'000
DITID $'000
DPC $'000
Administered - HPW $'000
Assets
Cash and cash equivalents (147) - 2,924 5,001
Receivables 19,021 709 960 2,507
Intangible assets 2,788 - 4,656 -
Property, plant and equipment 121,904 2,776 833 -
Other assets 5,705 1,099 781 15,721
Total assets 149,271 4,584 10,154 23,229
Liabilities
Payables 23,807 3,316 4,087 2,765
Interest-bearing liabilities 123,153 - - -
Accrued employee benefits 1,684 203 418 -
Deferred tax liabilities - - - -
Other liabilities 79 3,085 129 -
Total liabilities 148,723 6,604 4,634 2,765
Net assets 548 (2,020) 5,520 20,464
Refer to note 5 and note 31 for details relating to values of budgeted appropriation revenue and equity payments
transferred under machinery-of-Government changes.

PART B Department of Science, Information Technology and Innovation
Notes to the final financial statements for the period 1 July 2017 to 12 December 2017
Annual Report 2017–18 | Department of Science, Information Technology and Innovation 43
35. Summary of other accounting policies
a) Leases A distinction is made in the financial statements between finance leases, which effectively transfer from the lessor to the lessee substantially all risks and benefits incidental to ownership, and operating leases, under which the lessor retains substantially all risks and benefits. Leases of non-current assets where the department, as lessee, has substantially all the risks and rewards of ownership are classified as finance leases. Finance leases are capitalised at the lease’s inception at the fair value of the leased property or, if lower, the present value of the minimum lease payments. The corresponding rental obligations, net of finance charges, are included in other short-term and long-term liabilities. Each lease payment is allocated between the liability and finance cost. The finance cost is charged to the Statement of Comprehensive Income over the lease period so as to produce a constant periodic rate of interest on the remaining balance of the liability for each period. Operating lease payments are representative of the pattern of benefits derived from the leased assets and are expensed in the periods in which they are incurred. Incentives received on entering into operating leases are recognised as liabilities. Lease payments are allocated between rental expense and reduction of the liability. b) Insurance With the exception of non-current physical assets held by CITEC, which are commercially insured, the department’s non-current physical assets and other risks, including those relating to business interruption following natural disasters, are insured through the Queensland Government Insurance Fund. Premiums are paid on a risk assessment basis. In addition, the department pays premiums to Workcover Queensland in respect of its obligations for employee compensation. c) Contributed equity Interpretation 1038 Contributions by Owners Made to Wholly Owned Public Sector Entities specifies the principles for recognising contributed equity by the department. Appropriations and non-appropriated equity adjustments (refer to Statement of Changes in Equity) have been recognised as contributed equity by the department during the reporting and comparative years. d) Issuance of financial statements The financial statements are authorised for issue by the former Director-General and former Chief Finance Officer at the date of signing the Management Certificate. e) Accounting estimates and judgements The preparation of financial statements necessarily requires the determination and use of certain critical accounting estimates, assumptions, and management judgements that have the potential to cause a material adjustment to the carrying amounts of assets and liabilities within the next financial year. Such estimates, judgements and underlying assumptions are reviewed on an ongoing basis. Revisions to accounting estimates are recognised in the period in which the estimate is revised and in future periods as relevant. Estimates and assumptions with the most significant effect are outlined in the following financial statement notes: Valuation of property, plant and equipment – note 17 Financial instruments – note 27 Finance leases – note 19 Contingencies – note 26 Receivables – note 14 Further, the matters covered in each of those notes (except for depreciation and amortisation) necessarily involve estimation uncertainty, with the potential to materially impact on the carrying amount of the department’s assets and liabilities in the next reporting period. Reference should be made to the respective notes for more information.
f) Currency, rounding and comparatives
Amounts included in the financial statements are in Australian dollars and rounded to the nearest $1,000 or, where that amount is $500 or less, to zero, unless disclosure of the full amount is specifically required.
Comparative information reflects the audited 2016–17 financial statements except where comparatives have been re-stated to
be consistent with the disclosures in the current reporting period. In particular, note 8 refers to other revenue where additional line items relating to recovery of ICT related project costs and rent have been disclosed. Accordingly, the comparatives have been re-stated.

PART B Department of Science, Information Technology and Innovation
Notes to the final financial statements for the period 1 July 2017 to 12 December 2017
44 Annual Report 2017–18 | Department of Science, Information Technology and Innovation
35. Summary of other accounting policies (continued)
g) Current/non-current classification
Assets and liabilities are classified as either ‘current’ or ‘non-current’ in the Statement of Financial Position and associated notes. Assets are classified as ‘current’ where their carrying amount is expected to be realised within 12 months after the reporting date. Liabilities are classified as ‘current’ when they are due to be settled within 12 months after the reporting date, or the department does not have an unconditional right to defer settlement to beyond 12 months after the reporting date. All other assets and liabilities are classified as non-current.
h) Donated/transferred assets
Assets donated or transferred to the department are recognised as revenues (refer note 7).
i) Capital work in progress, including intangible assets under development
Work in progress is recognised at cost. All costs relating to items of property, plant and equipment and intangible assets constructed in-house are recorded as work in progress until completion of the project using all direct costs and, where applicable, reliable attributed indirect costs. Work in progress performed under external contracts is recorded using the invoice amount supplied by the contractor. The department does not capitalise finance and borrowing costs.
j) Acquisition of assets
Historical cost is used for the initial recording of all non-current physical and intangible asset acquisitions. Historical cost is determined as the value given as consideration plus costs incidental to the acquisition, including all other costs incurred in getting the assets ready for use, including architects' fees and engineering design fees. However, any training costs are expensed as incurred. Where assets are received free of charge from another Queensland Government department (whether as a result of a machinery-of-government change or other involuntary transfer), the acquisition cost is recognised as the carrying amount in the books of the other agency immediately prior to the transfer. Assets acquired at no cost or for nominal consideration, other than from an involuntary transfer from another Queensland Government entity, are recognised at their fair value at date of acquisition.
k) Basis of capitalisation and recognition thresholds
Items of property, plant and equipment with a historical cost or other value equal to or exceeding the following thresholds in the year of acquisition are reported as property, plant and equipment in the following classes:
Buildings $10,000 Infrastructure $10,000
Heritage and cultural $5,000 Plant and equipment $5,000
Leased assets $5,000 Land $1
Items with a lesser value are expensed in the year of acquisition. Expenditure is only capitalised if it increases the service potential or useful life of the existing asset. Maintenance that merely restores original service potential (lost through ordinary wear and tear) is expensed. Land improvements undertaken by the department are included with buildings.
l) Measurement of non-current physical assets using fair value
Land, buildings, infrastructure and heritage and cultural assets are measured at fair value as required by Queensland Treasury’s Non-Current Asset Policies for the Queensland Public Sector. Leased assets are measured at fair value in accordance with AASB 117 Leases. These assets are reported at their revalued amounts, being the fair value at the date of valuation, less any subsequent accumulated depreciation and subsequent accumulated impairment losses where applicable. The cost of items acquired during the reporting period has been judged by the management of the department to materially represent their fair value at the end of the reporting period.
m) Measurement of non-current physical and intangible assets using historical cost
Plant and equipment is measured at historical cost in accordance with the Non-Current Asset Policies. The carrying amounts for such plant and equipment is not materially different from their fair value. Separately identified components of assets are measured on the same basis as the assets to which they relate. Intangible assets are measured at their historical cost, unless there is an active market for the assets concerned (in which case they will be measured at fair value).

PART B Department of Science, Information Technology and Innovation
Notes to the final financial statements for the period 1 July 2017 to 12 December 2017
Annual Report 2017–18 | Department of Science, Information Technology and Innovation 45
35. Summary of other accounting policies (continued)
n) Revaluation of non-current physical and intangible assets measured at fair value
Property, plant and equipment classes measured at fair value are revalued on an annual basis either by specific appraisals undertaken by an independent professional valuer or internal expert, or by the use of appropriate and relevant indices. For financial reporting purposes, the revaluation process is managed by a team in the department’s Finance, Procurement and Business Services unit, which determines the specific revaluation practices and procedures. The department undertakes annual reviews of the revaluation practices (after each year’s revaluation process), and reports to the department’s Audit and Risk Management Committee (of which the department’s Chief Finance Officer is an invitee) regarding the outcomes of, and recommendations arising from, each annual review. Revaluations using an independent professional valuer or internal expert appraisals are undertaken at least once every five years. However, if a particular asset class experiences significant and volatile changes in fair value, that class is subject to specific appraisal in the reporting period, where practicable, regardless of the timing of the last specific appraisal. This is arranged by the department’s Finance, Procurement and Business Services unit after consultation with the department’s Finance and Procurement sub-Committee. Materiality is considered in determining whether the difference between the carrying amount and the fair value of an asset is material (in which case, revaluation is warranted). The fair values reported by the department are based on appropriate valuation techniques that maximise the use of available and relevant observable inputs, and minimise the use of unobservable inputs. Where assets have not been specifically appraised in the reporting period, their previous valuations are materially kept up to date via the application of relevant indices. The department ensures that the application of such indices results in a valid estimation of the assets’ fair values at reporting date. The State Valuation Service (SVS) supplies the indices used for the various types of assets. Such indices are either publicly available, or are derived from market information available to SVS. SVS provides assurance of their robustness, validity and appropriateness for application to the relevant assets. Indices used are also tested for reasonableness by applying the indices to a sample of assets, comparing the results to similar assets that have been valued by an independent professional valuer or internal expert, and analysing the trend of changes in values over time. Through this process, which is undertaken annually, the department assesses and confirms the relevance and suitability of indices provided by SVS based on the department’s own particular circumstances. Any revaluation increment arising from the revaluation of an asset is credited to the asset revaluation surplus of the appropriate class, except to the extent it reverses a revaluation decrement for the class previously recognised as an expense. A decrease in the carrying amount on revaluation is charged as an expense, to the extent it exceeds the balance, if any, in the revaluation surplus relating to that asset class. For assets revalued using a cost valuation approach (e.g. current replacement cost), accumulated depreciation is adjusted to equal the difference between the gross amount and carrying amount, after taking into account accumulated impairment losses. This is generally referred to as the ‘gross method’. For assets revalued using a market based valuation approach, accumulated depreciation and accumulated impairment losses are eliminated against the gross amount of the asset prior to restating for the revaluation. This is generally referred to as the ‘net method’.
o) Fair value measurement
Fair value is the price that would be received to sell an asset or paid to transfer a liability in an orderly transaction between market participants at the measurement date under current market conditions (i.e. an exit price) regardless of whether that price is directly derived from observable inputs or estimated using another valuation technique. Observable inputs are publicly available data that are relevant to the characteristics of the assets/liabilities being valued. Observable inputs used by the department include, but are not limited to, published sales data for land and general office buildings. Unobservable inputs are data, assumptions and judgements that are not available publicly, but are relevant to the characteristics of the assets/liabilities being valued. Significant unobservable inputs used by the department include, but are not limited to, subjective adjustments made to observable data to take account of the characteristics of the department’s assets/liabilities, internal records of recent construction costs (and/or estimates of such costs) for assets' characteristics/functionality, and assessments of physical condition and remaining useful life. Unobservable inputs are used to the extent that sufficient relevant and reliable observable inputs are not available for similar assets/liabilities. A fair value measurement of a non-financial asset takes into account a market participant’s ability to generate economic benefits by using the asset at its highest and best use.

PART B Department of Science, Information Technology and Innovation
Notes to the final financial statements for the period 1 July 2017 to 12 December 2017
46 Annual Report 2017–18 | Department of Science, Information Technology and Innovation
35. Summary of other accounting policies (continued)
o) Fair value measurement
All assets and liabilities of the department, for which fair value is measured or disclosed in the financial statements, are categorised within the following fair value hierarchy, based on the data and assumptions used in the most recent specific appraisals: Level 1 represents fair value measurements that reflect unadjusted quoted market prices in active markets for identical
assets and liabilities; Level 2 represents fair value measurements that are substantially derived from inputs (other than quoted prices included
within level 1) that are observable, either directly or indirectly; and Level 3 represents fair value measurements that are substantially derived from unobservable inputs. None of the department’s valuations of assets or liabilities are eligible for categorisation into Level 1 of the fair value hierarchy. There were no transfers of assets between fair value hierarchy levels during the period. More specific fair value information about the department’s property, plant and equipment is outlined in note 17. Details of individual assets and liabilities measured under each category of fair value are set out in the tables at note 27.
p) Intangible assets
Intangible assets with a historical cost or other value greater than or equal to $100,000, are recognised in the financial statements. Items with a lesser value are expensed. Each intangible asset, less any anticipated residual value, is amortised over its estimated useful life to the department. The residual value is zero for all the department’s intangible assets. There is not an active market for any of the department’s intangible assets. As such, the assets are recognised and carried at historical cost, less accumulated amortisation and accumulated impairment losses. No intangible assets have been classified as held for sale, or form part of a disposal group held for sale. Purchased software The purchase cost of software has been capitalised and is amortised on a straight-line basis over the period of the expected benefit to the department, generally five years. However, where appropriate, the useful lives of certain assets have been determined on an individual basis. Internally generated software Expenditure on research activities relating to internally-generated intangible assets is recognised as an expense in the period in which it is incurred. Costs associated with the development of computer software have been capitalised and are amortised on a straight-line basis over the period of the expected benefit to the department, generally five years. However, where appropriate, the useful lives of certain assets have been determined on an individual basis.
q) Amortisation and depreciation of intangible assets and property, plant and equipment
Land is not depreciated as it has an unlimited useful life. All intangible assets of the department have finite useful lives and are amortised on a straight-line basis over their estimated useful life to the department. Property, plant and equipment (excluding land) is depreciated on a straight-line basis so as to allocate the net cost or revalued amount of each asset, less its estimated residual value, progressively over its estimated useful life to the department. For depreciable assets, residual value is determined to be zero, reflecting the estimated amount to be received on disposal at the end of their useful life. All heritage and cultural assets of the department are not depreciated as the service potential of the assets are not expected to diminish over time. Assets under construction (work in progress) are not depreciated until they reach their service delivery capacity. Service delivery capacity relates to when construction is complete and the asset is first put to use, or is installed ready for use in accordance with its intended application. These assets are then reclassified to the relevant classes within property, plant and equipment and intangible assets. Where assets have separately identifiable components that are subject to regular replacement, these components are assigned useful lives distinct from the asset to which they relate and are depreciated accordingly. Any expenditure that increases the originally assessed capacity or service potential of an asset is capitalised and the new depreciable amount is depreciated over the remaining useful life of the asset to the department. Major spares purchased specifically for particular assets are capitalised and depreciated on the same basis as the asset to which they relate.

PART B Department of Science, Information Technology and Innovation
Notes to the final financial statements for the period 1 July 2017 to 12 December 2017
Annual Report 2017–18 | Department of Science, Information Technology and Innovation 47
35. Summary of other accounting policies (continued)
q) Amortisation and depreciation of intangible assets and property, plant and equipment
The depreciable amount of improvements to or on leasehold land, is allocated progressively over the estimated useful lives of the improvements, or the unexpired period of the lease, whichever is the shorter. The unexpired period of a lease includes any option period where exercise of the option is probable. Plant and equipment subject to a finance lease is depreciated on a straight-line basis over the term of the lease or, where it is likely that the department will obtain ownership of the asset, the expected useful life of the asset to the department. Straight-line depreciation is used reflecting the progressive, and even consumption of future economic benefits over their useful life to the department. Items comprising the department’s technical library are expensed on acquisition. For each class of depreciable assets, the following depreciation and amortisation rates are used:
Class Rates Class Rates
Buildings 2% to 10% Leasehold improvements 2.5% to 20%
Infrastructure 2% to 12.5% Computer equipment 4% to 55%
Financed leased assets 7% to 20% Scientific equipment 4% to 33%
Other equipment 4% to 33% Software internally generated 6% to 24%
Software purchased 4% to 26%
Where appropriate, the depreciation and amortisation rates applied to assets are determined on an individual basis.
r) Impairment of non-current assets
All non-current physical and intangible assets are assessed for indicators of impairment on an annual basis. If an indicator of possible impairment exists, the department determines the asset’s recoverable amount. Any amount by which the asset’s carrying amount exceeds the recoverable amount is recorded as an impairment loss. The asset’s recoverable amount is determined as the higher of the asset’s fair value less costs to sell, current replacement cost, or net cash inflows generated through use of the asset. An impairment loss is recognised immediately in the Statement of Comprehensive Income, unless the asset is carried at a revalued amount. When the asset is measured at a revalued amount, the impairment loss is offset against the asset revaluation surplus of the relevant class to the extent available. Where an impairment loss subsequently reverses, the carrying amount of the asset is increased to the revised estimate of its recoverable amount, to the extent that the increased carrying amount does not exceed the carrying amount that would have been determined had no impairment loss been recognised for the asset in prior years. A reversal of an impairment loss is recognised as income, unless the asset is carried at a revalued amount, in which case the reversal of the impairment loss is treated as a revaluation increase. When an asset is revalued using a market valuation approach, any accumulated impairment losses at that date are eliminated against the gross amount of the asset prior to restating for the revaluation. The department’s annual asset impairment assessment process is conducted in accordance with the department’s asset impairment assessment guide that forms part of the department’s asset management handbook, maintained by Finance, Procurement and Business Services. Within this guide, the department maintains a schedule of impairment indicators for each individual asset class, which are reviewed and updated annually. The assessment of and outcomes from the department’s asset impairment assessment process is reported to and endorsed by the department’s Audit and Risk Management Committee annually.
s) New and revised accounting standards
At the date of authorisation of the final financial statements there were a number of new or amended Australian Accounting Standards with future commencement dates. As these are the final financial statements for the department these standards are not applicable to the department.
35. Summary of other accounting policies (continued)
t) First-year application of new accounting standards or changes in accounting policy

PART B Department of Science, Information Technology and Innovation
Notes to the final financial statements for the period 1 July 2017 to 12 December 2017
48 Annual Report 2017–18 | Department of Science, Information Technology and Innovation
The department did not voluntarily change any of its accounting policies and no Australian Accounting Standards have been early adopted during the reporting period. Accounting standards applied for the first time AASB 2016-2 Amendments to Australian Accounting Standards – Disclosure Initiative: Amendments to AASB 107 requires the disclosure of information that will allow users to understand changes in liabilities arising from financing activities. Disclosure of the relevant figures can be found in note 24. AASB 2016-4 Amendments to Australian Accounting Standards – Recoverable Amount of Non-Cash Generating Specialised Assets for not-for-Profit Entities simplified and clarified the impairment testing requirements under AASB 136 for non-cash generating assets held by NFP entities. This amendment has not changed any reported amounts. References to the Depreciated Replacement Costs have been replaced with Current Replacement Cost in line with these amendments. u) Restated financial report Revised financial information was provided by Queensland Treasury, subsequent to management certification dated 29 March 2018 and signing of the accompanying auditor’s report, dated 9 April 2018, of a previous version of the financial statements. The following adjustments were made to correct the 2017-18 amounts reported within the previous version of the financial statements as a result of this revised financial information. Note 5 Treasurer’s transfers to equity adjustments and Treasurer’s transfers from appropriation revenue were understated by $5.581 million and overstated by $6.15 million respectively. Unforeseen expenditure was overstated by $8.121 million and Transfers to other departments for appropriation revenue and equity adjustments were overstated by $5.581 million and understated by $14.721 million respectively. Note 31 The transfer from administered appropriation revenue to administered equity adjustment was previously understated by $0.569 million. The adjustments made in the notes to the accounts disclosing the reconciliations of payments from the consolidated fund to appropriation revenue and equity payments had no impact upon total appropriation revenue and total equity appropriations reported within the previous financial statements. The previous version of the financial statements and accompanying auditor’s report have been withdrawn and replaced with the restated financial report authorised for issue by the former Director-General and former Chief Finance Officer at the date of signing the Management Certificate.
36. Events subsequent to abolition of the department
Further machinery-of-government changes took effect subsequent to 12 December 2017 under Public Service
Departmental Arrangements Notice (No4) 2017 and Public Service Departmental Arrangements Notice (No1)
2018 impacting those functions of the department transferred under Public Service Departmental Arrangements
Notice (No3) 2017.
Under Public Service Departmental Arrangements Notice (No4) 2017, the Contract and Investment Management
Unit of Science Development transferred from the Department of Environment and Science to the Department of
Tourism, Major Events, Small Business and the Commonwealth Games which took effect from 22 December
2017.
Under Public Service Departmental Arrangements Notice (No1) 2018, One-Stop Shop Strategy and
Implementation Office, Queensland Government Chief Information Office and Digital Economy and Productivity
transferred from the Department of the Premier and Cabinet to the Department of Housing and Public Works
which took effect from 9 February 2018.
There were no other material events subsequent to the reporting date but prior to the signing of these accounts of
which management was aware.

PART B Department of Science, Information Technology and Innovation
Annual Report 2017–18 | Department of Science, Information Technology and Innovation 49
Department of Science, Information Technology and Innovation
Final Management Certificate
for the reporting period ended 12 December 2017
These general purpose financial statements have been prepared pursuant to section 62(1) of the Financial
Accountability Act 2009 (the Act), section 47 of the Financial and Performance Management Standard 2009 and
other prescribed requirements. In accordance with section 62(1)(b) of the Act, we certify that in our opinion:
(a) the prescribed requirements for establishing and keeping the accounts have been complied with in
all material respects; and
(b) the financial statements have been drawn up to present a true and fair view, in accordance with
prescribed accounting standards, of the transactions of the Department of Science, Information
Technology and Innovation for the reporting period ended 12 December 2017 and of the financial
position of the department at 12 December 2017; and
(c) these assertions are based upon an appropriate system of internal controls and risk management
processes being effective, in all material aspects, with respect to financial reporting throughout the
reporting period.
Danny Short Jamie Merrick
B Comm FCPA former Director-General
former Chief Finance Officer
2 May 2018 2 May 2018


![Legislative Assembly Hansard 1924 - parliament.qld.gov.auLegislative Assembly Hansard 1924 - parliament.qld.gov.au ... [ 4 september.]](https://static.documents.pub/doc/80x56/5e6178bfabe261714c56376d/legislative-assembly-hansard-1924-legislative-assembly-hansard-1924-4.jpg)


