rence Berkeley National Laboratory, University of California, Earth Sciences versity of Oslo, Department of Geophysics, [email protected]Simulating Unsaturated Flow Fields Based on Ground Penetrating Radar and Saturation Measurement Stefan Finsterle 1 and Nils-Otto Kitterød 2
Transcript
1 Lawrence Berkeley National Laboratory, University of California, Earth Sciences Division2 University of Oslo, Department of Geophysics, [email protected]
Simulating Unsaturated Flow Fields
Based on
Ground Penetrating Radar and Saturation Measurements
Stefan Finsterle1 and Nils-Otto Kitterød2
Purpose: Estimate unsaturated flow velocitiesby inverse modelling of flow parameters
conditioned on soil moisture content
and Ground Penetrating Radar
Why soil moisture?
Why unsaturated flow?
Why inverse modelling?
Why Ground Penetrating Radar?
Why do a tracer test?
Why unsaturated flow?
Protection of groundwater resources
The Gardermoen airport
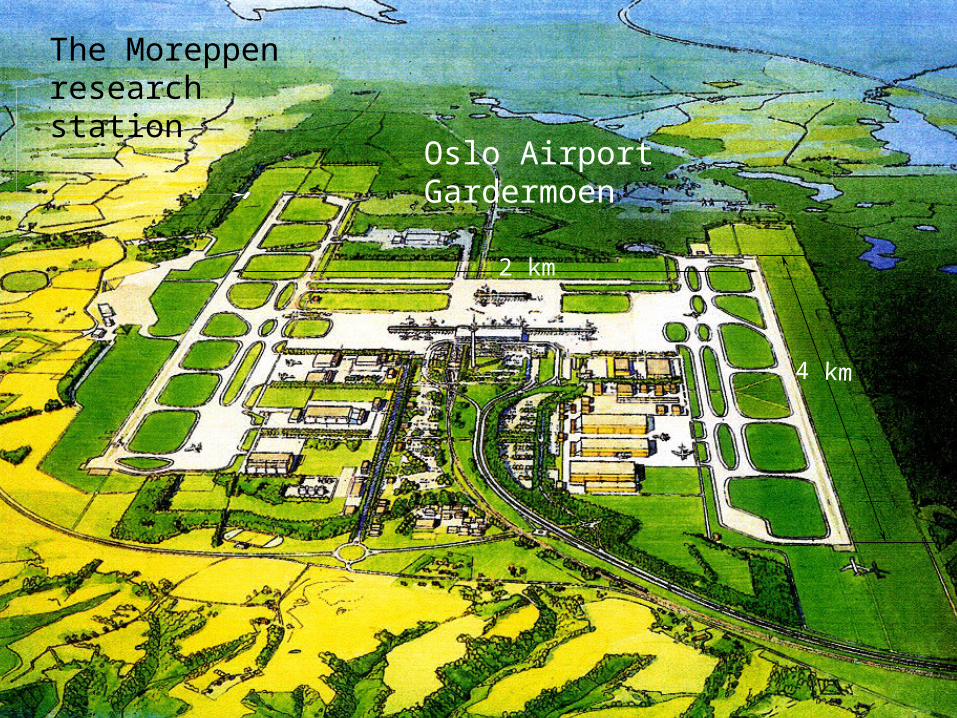
The Moreppen research station
Oslo Airport Gardermoen
4 km
2 km
Residence time?
On the runways (acetate, formeate)
On the airplanes (glycol)
Consumption of ~ 400 mill. liter/year
Deicing chemical
Jet fuel
Main problem:
Good remediation potential in the unsaturated zone(oxygen is the best electron acceptor)
However:
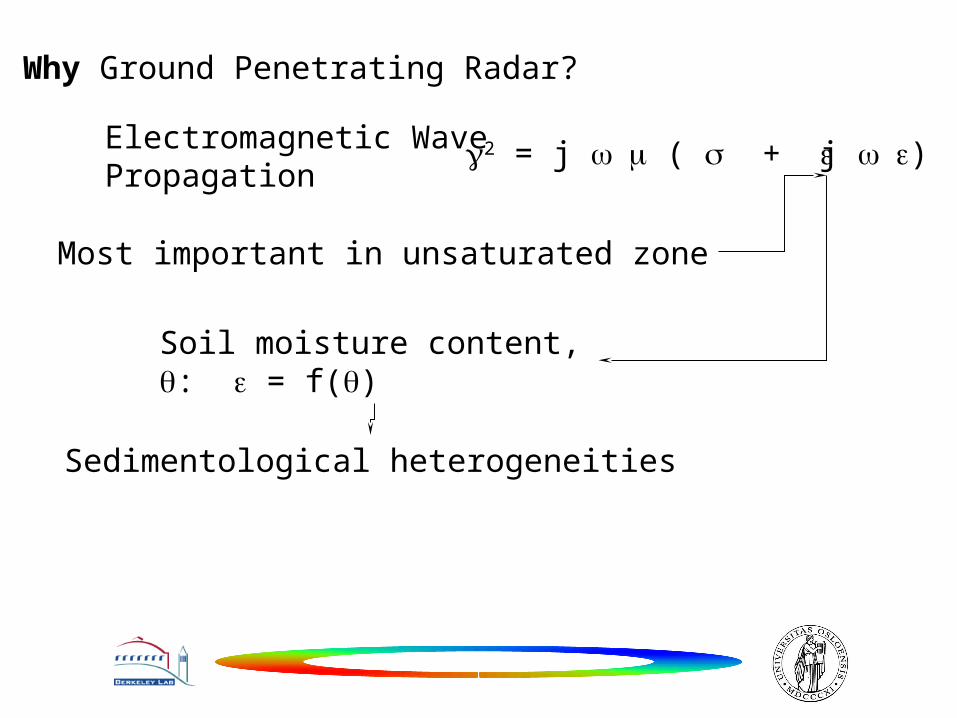
Why Ground Penetrating Radar?
Electromagnetic Wave Propagation
2 = j ( + j )
Soil moisture content, : = f()
Sedimentological heterogeneities
Most important in unsaturated zone
Oslo Airport Gardermoen
railwayrunways
utm-E
utm-N
616 000 618 000
6672500
6674500
6676500
Moreppenresearch site
10m
N
Moreppen research site
615,750 615,8006,677,740
6,677,760
6,677,780
6,677,800
6,677,820
6,677,840
p42 p44 p46p48
p33
p41
p43
p45
p47
p35
p47Delta topset
Delta foreset
What did we see? Cross section of a delta
Delta bottomset
Iso-crones
Delta foreset
Delta topsetSea level (~10.000 BP)
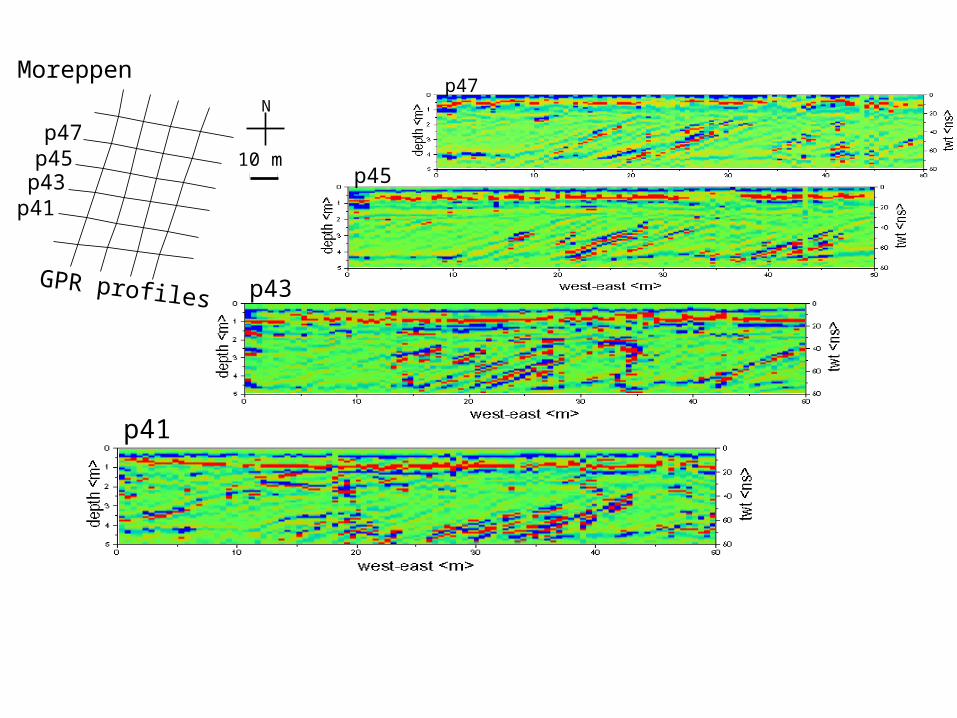
p47
p45
p43
p41
GPR profiles
p41p43p45p47
MoreppenN
10 m
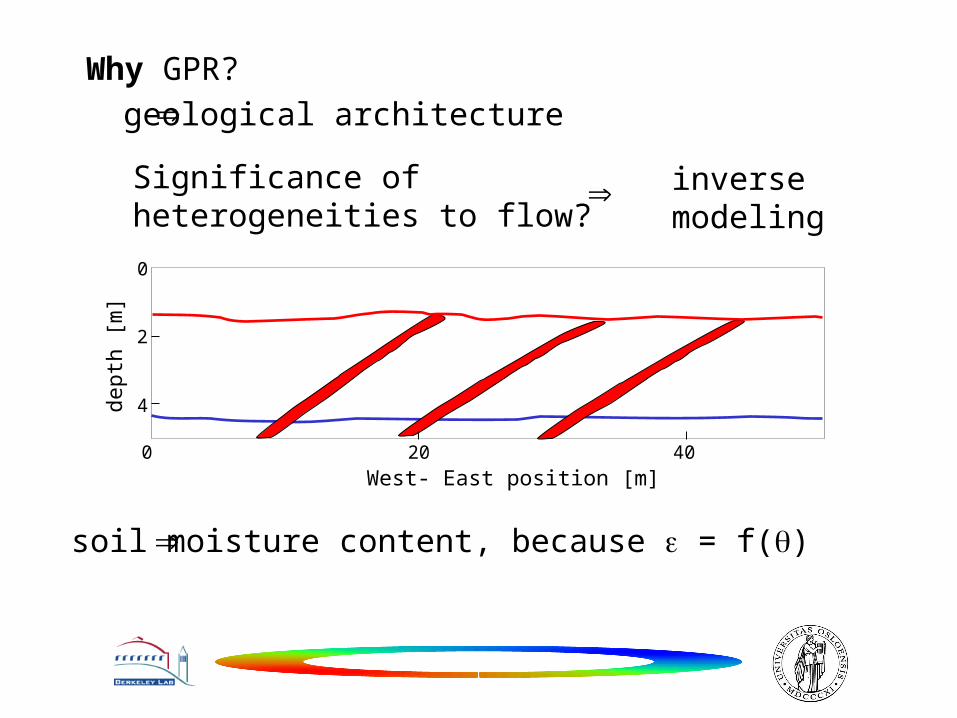
Why GPR?
geological architecturede
pth
[m]
0
2
4
0 20 40
West- East position [m]
Significance of heterogeneities to flow?
soil moisture content, because = f()
inverse modeling
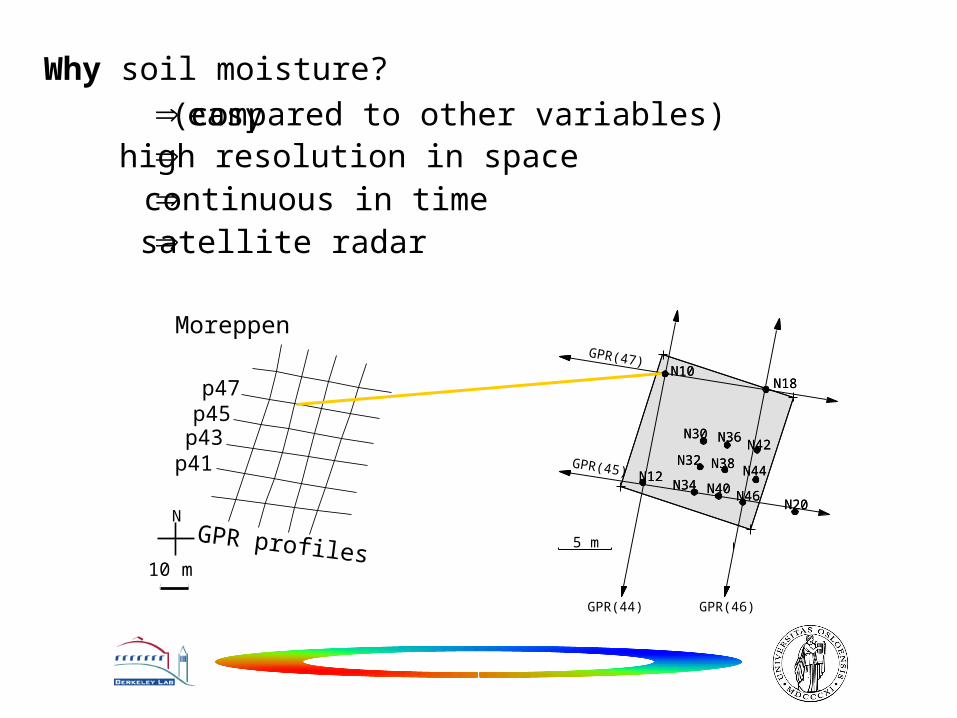
Why soil moisture?
easyhigh resolution in spacecontinuous in time
(compared to other variables)
satellite radar
GPR profiles
p41p43p45p47
Moreppen
N
10 m
N12
N10N18
N20
N34
N32
N30
N40
N38
N36
N46
N44
N42
N12
N10N18
N20
N34
N32
N30
N40
N38
N36
N46
N44
N42
GPR(44) GPR(46)
GPR(47)
GPR(45)
5 m
soil moisture content0.2 m below the surface Moreppen,
delta topset
May 11. 1995
vol% H2O
3.0 29.8
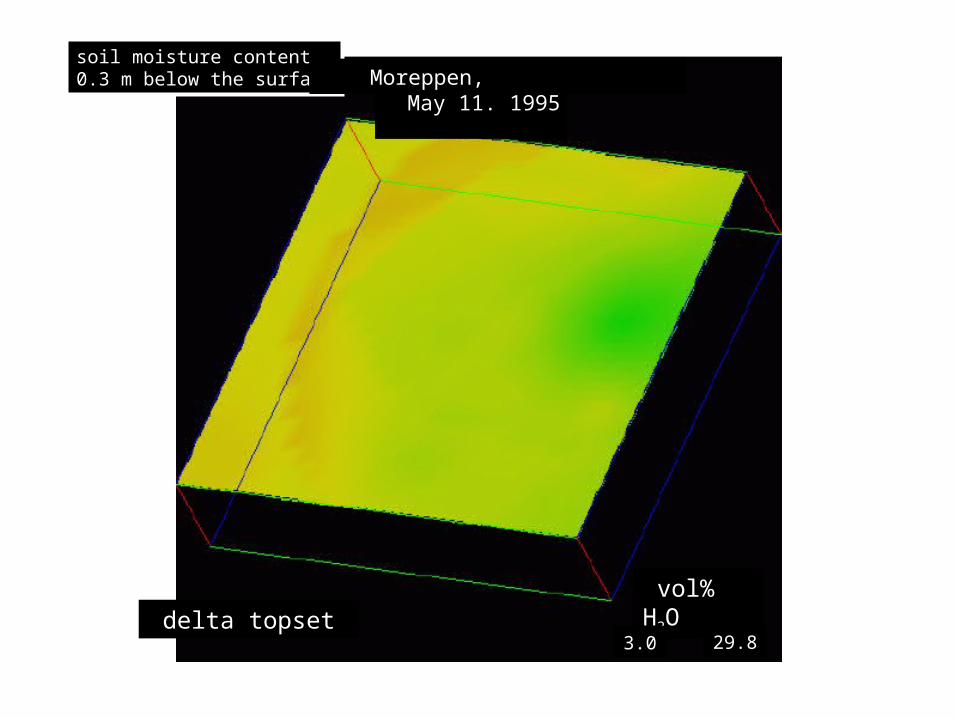
interpolationin 3D
soil moisture content0.3 m below the surface
Moreppen,
delta topset
May 11. 1995
vol% H2O
3.0 29.8
soil moisture content0.5 m below the surface Moreppen,
delta topset
May 11. 1995
vol% H2O
3.0 29.8
soil moisture content1.0 m below the surface Moreppen,
delta topset
May 11. 1995
vol% H2O
3.0 29.8
soil moisture content1.5 m below the surface Moreppen,
delta topset
May 11. 1995
vol% H2O
3.0 29.8
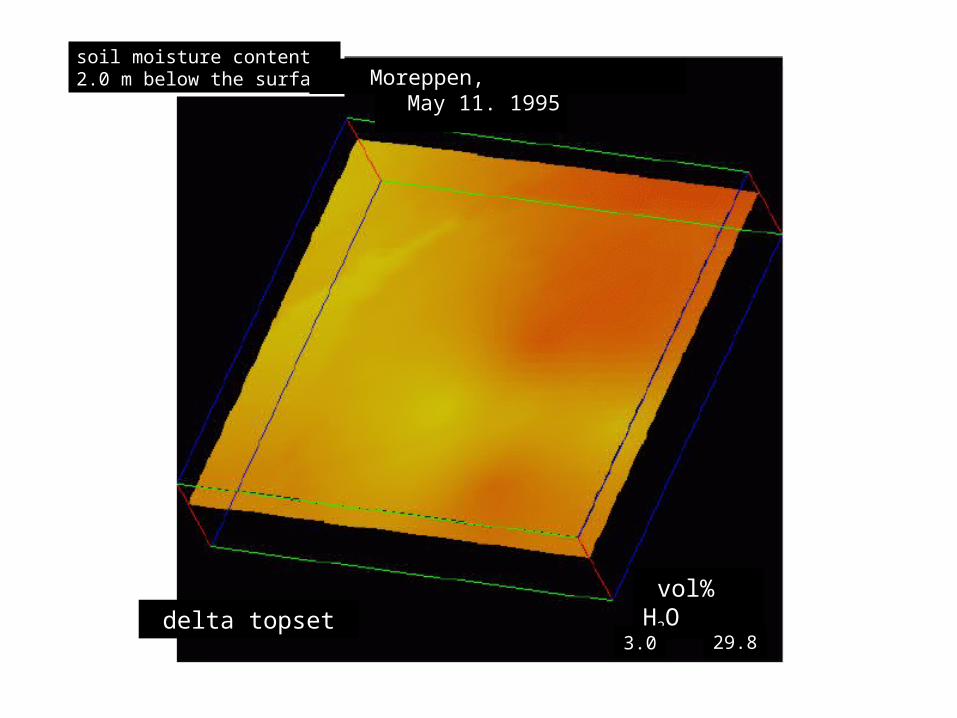
soil moisture content2.0 m below the surface Moreppen,
delta topset
May 11. 1995
vol% H2O
3.0 29.8
soil moisture content2.5 m below the surface
Moreppen,
delta foreset
May 11. 1995
vol% H2O
3.0 29.8
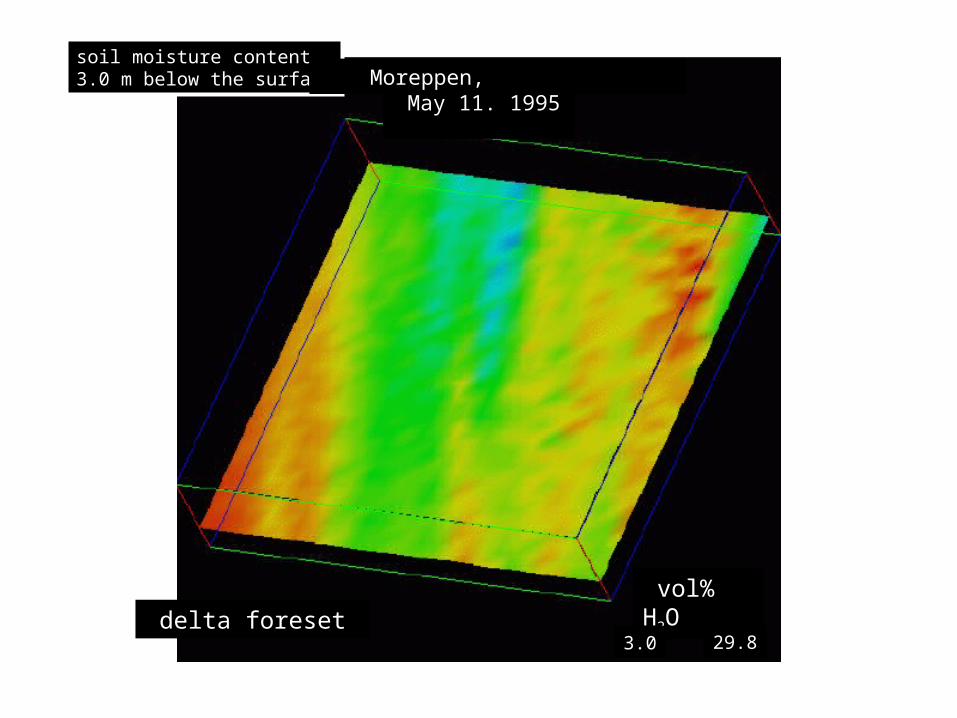
soil moisture content3.0 m below the surface
Moreppen,
delta foreset
May 11. 1995
vol% H2O
3.0 29.8
soil moisture content3.5 m below the surface
Moreppen,
delta foreset
May 11. 1995
vol% H2O
3.0 29.8
soil moisture content3.7 m below the surface Moreppen,
below groundwater table
May 11. 1995
vol% H2O
3.0 29.8
soil moisture content
Moreppen,
fence diagram
May 11. 1995
vol% H2O
3.0 29.8
Why inverse modeling?
honor observationsinclude a priori informationconsistent homogenization
question of scale!!
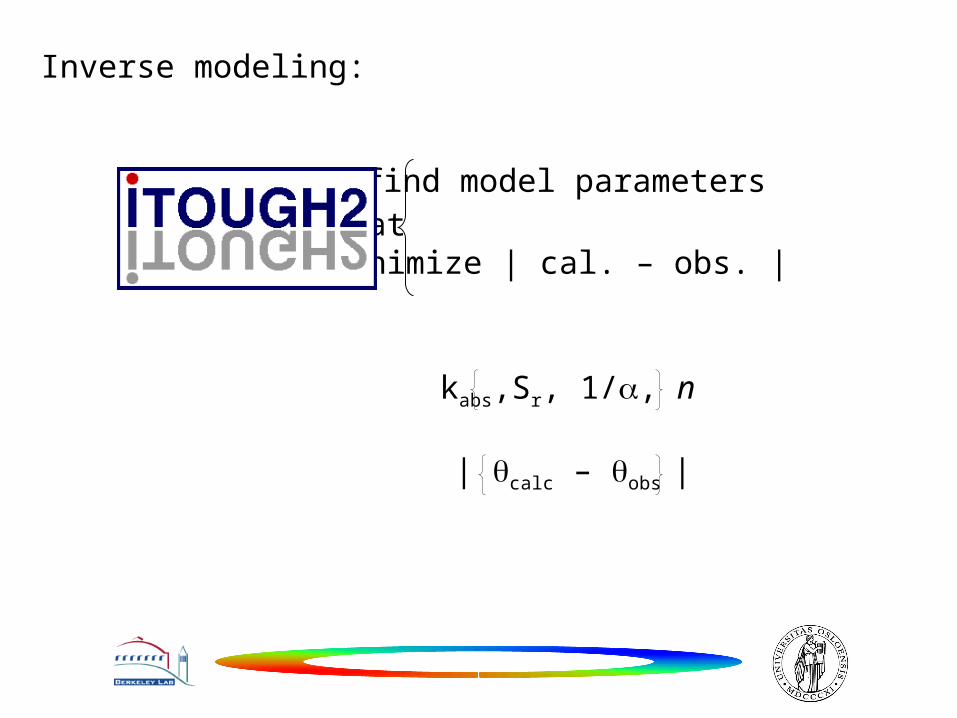
find model parametersthat minimize | cal. – obs. |
Inverse modeling:
kabs,Sr, 1/, n
| calc – obs |
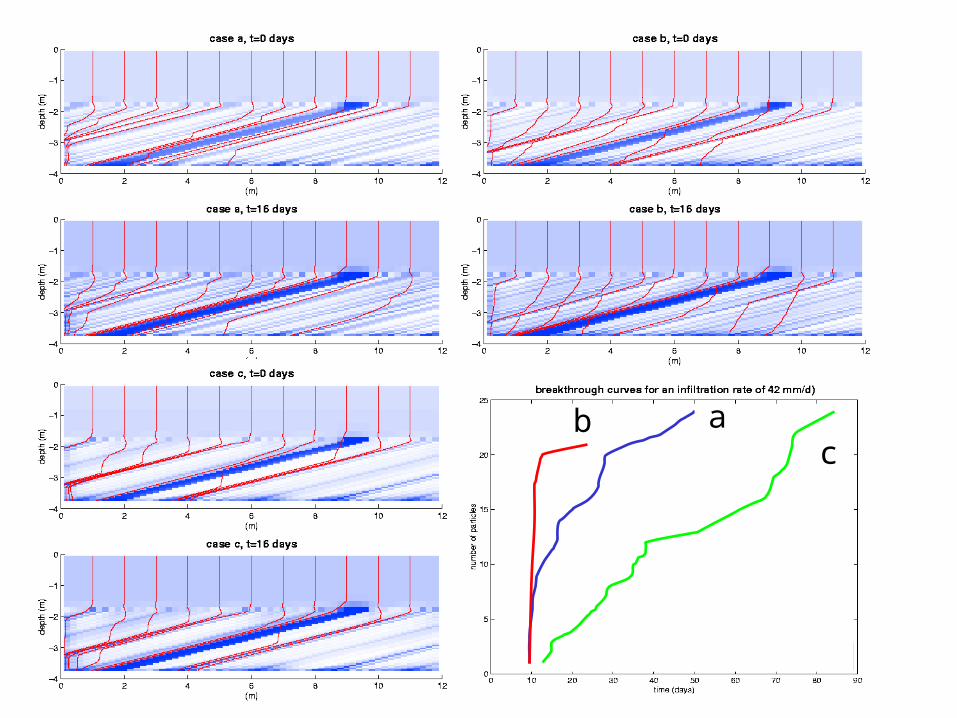
dept
h (m
)
0
-1
-2
-3
2 4 6 8 10 12
dept
h (m
)
0
-1
-2
-3
2 4 6 8 10 12
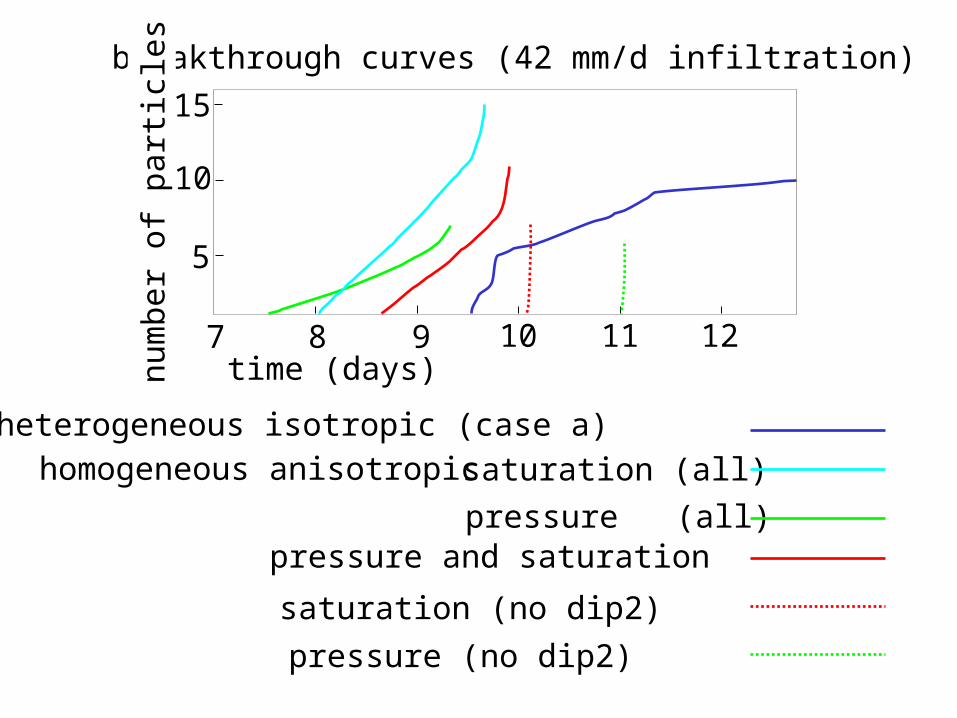
top1top2
dip1dip2
drysaturated~ 0.5 sat.
dept
h (m
)
0
-1
-2
-3
2 4 6 8 10 12
c11 c16
top1
top2
dip1
dip2
observed
most likely
withuncertanty
c11 and c16 are the conditioning wells
obs – calc for the whole flow domain
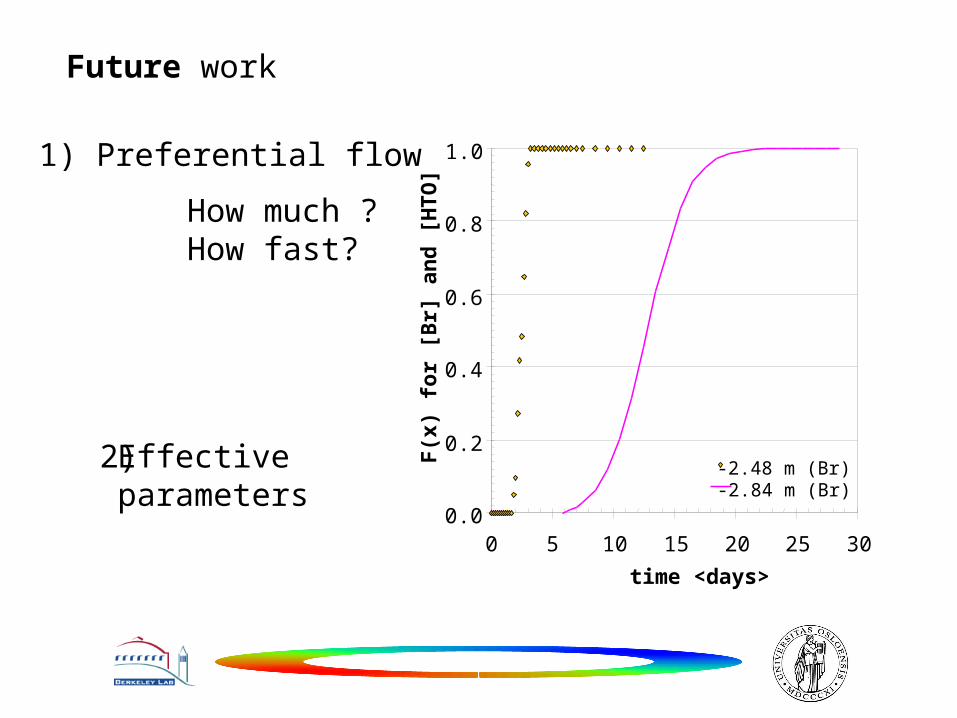
Why do a tracer test?
validate model parameters by independent observations
Primary observations is reproducedare we able to reproduce (or make forecasts)
of non-observed variables?
, but
GPR profiles
p41p43p45p47
MoreppenN
10 m
GPR profiles
p41 p43 p45 p47
Moreppen
N
10 m
Lysimeter trench
GPR profiles
p41 p43 p45 p47
Moreppen
N
10 m
Prenart probe
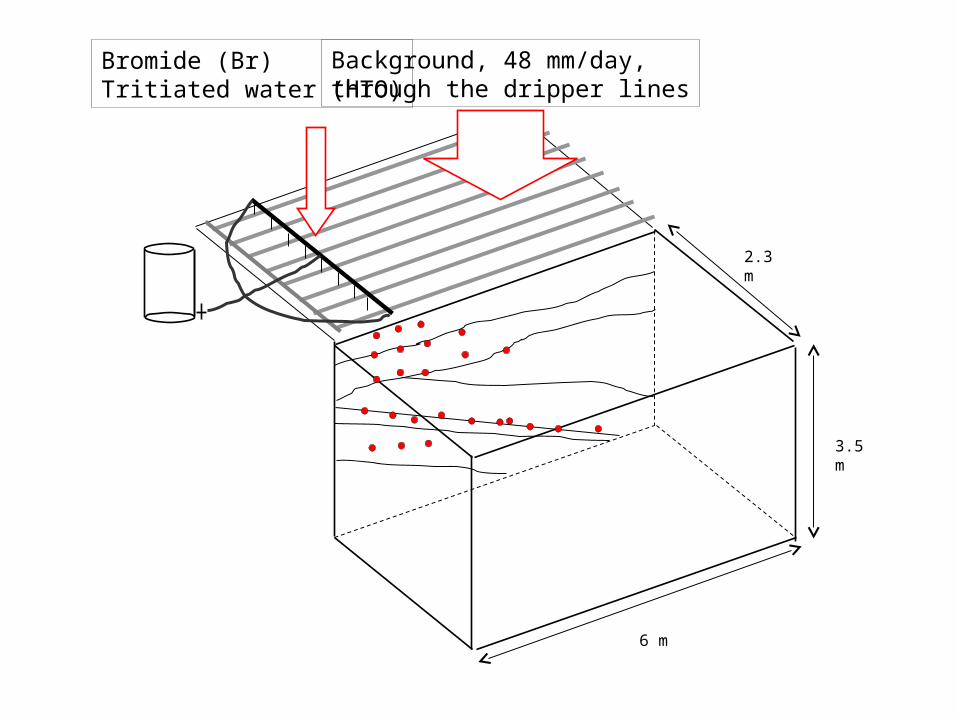
3.5 m
6 m
2.3 m
Background, 48 mm/day, through the dripper lines
Bromide (Br)Tritiated water (HTO)
dept
h (m
)
0
-1
-2
-3
0
-1
-2
-3
2 4 6 8 10 12
0
-1
-2
-3
day 1
day 2
day 3
0.00
0.20
0.40
0.60
0.80
1.00
F(x
) fo
r [B
r] a
nd
[H
TO
]
0.00 5.00 10.00 15.00 20.00 25.00 30.00
time <days>
Søvik and Alfnes et al. (2001)
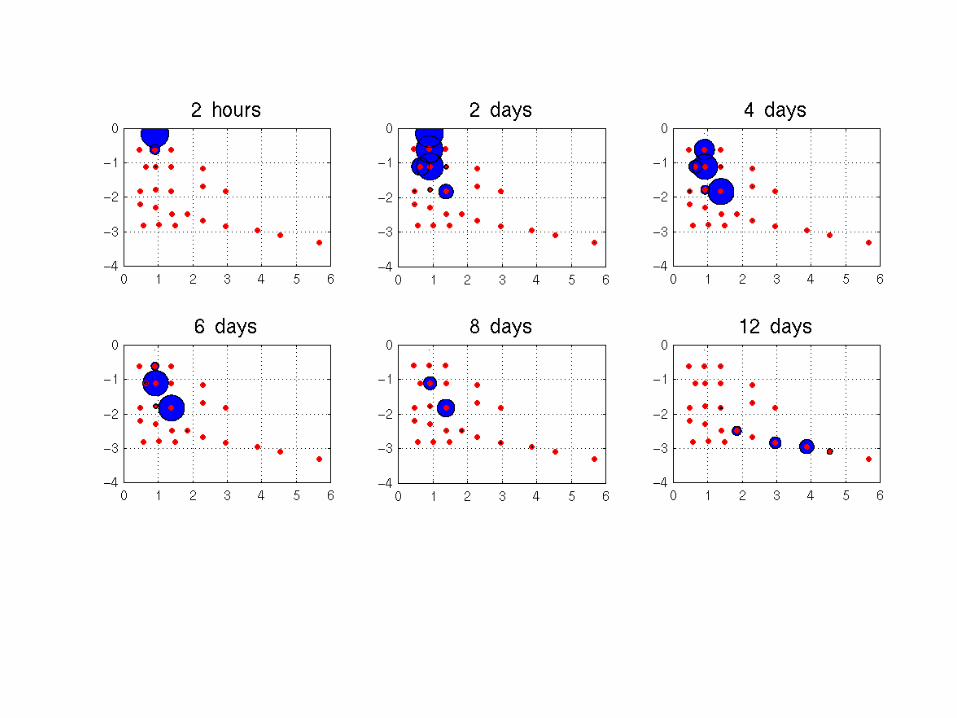
Moreppen tracer test
-1.82 m (Br)-1.83 m (Br)
-2.95 m (Br)-3.09 m (Br)-3.30 m (Br)-1.78 m (HTO)-2.49 m (HTO)-2.95 m (HTO)-3.09 m (HTO)-3.30 m (HTO)1.8 m iso2.8 m iso3.3 m iso