24
1 Lecture #5 Efficiencies and Growth Patterns
| Date post: | 19-Dec-2015 |
| Category: |
Documents |
| View: | 215 times |
| Download: | 1 times |

1
Lecture #5
Efficiencies and Growth Patterns

2
3
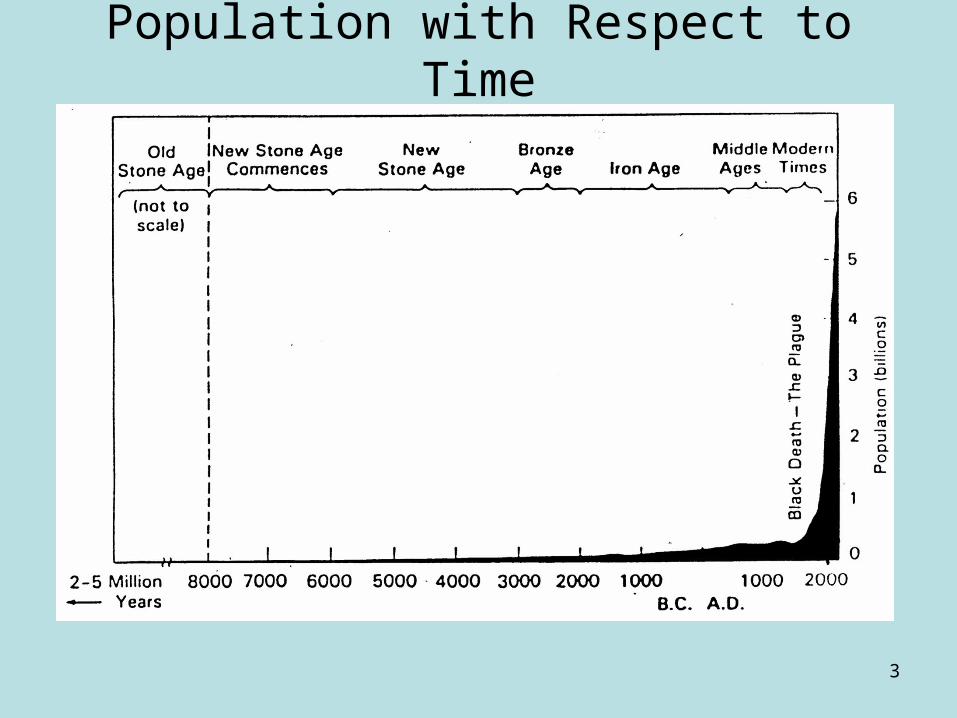
Population with Respect to Time

4
Population Growth
• Constant rate of increase leads to exponential growth
• Exponential growth has a portion that increases very quickly→ This is referred to as the knee of the graph
• The knee of the population graph appears to be around 1900
• Zooming in on that portion of the graph…
5
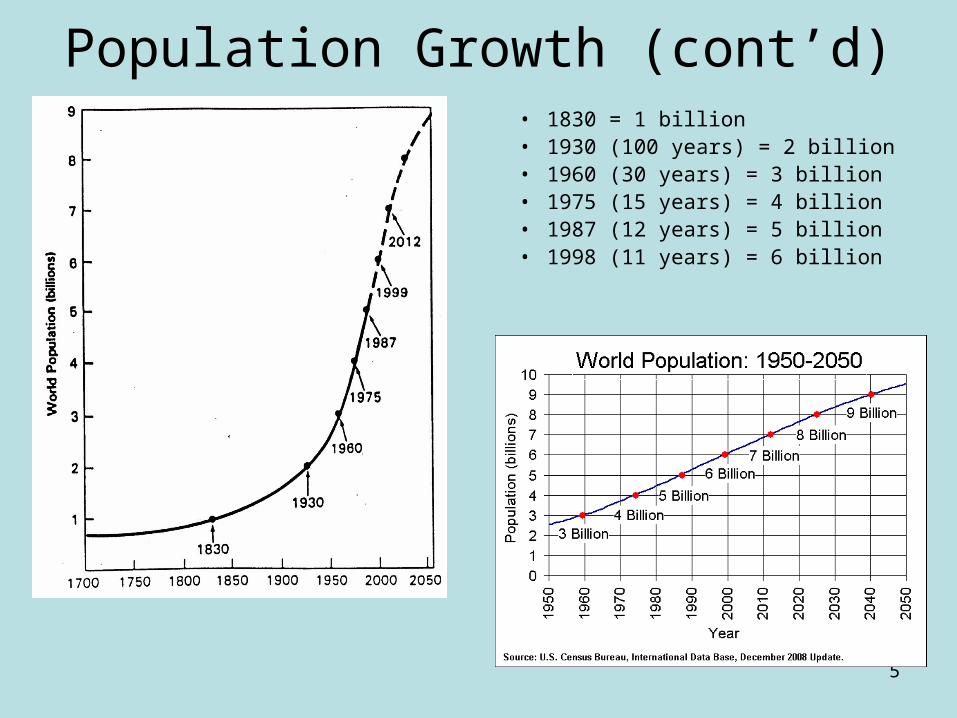
Population Growth (cont’d)• 1830 = 1 billion• 1930 (100 years) = 2 billion• 1960 (30 years) = 3 billion• 1975 (15 years) = 4 billion• 1987 (12 years) = 5 billion• 1998 (11 years) = 6 billion
6
Population Growth (cont’d)
• Every time there is a breakthrough (improved farming, clothing, medicine, technology) there is a jump in population
• This initial jump decreases until another breakthrough
• It is unknown when these jumps will occur

7
Population Growth (cont’d)
8
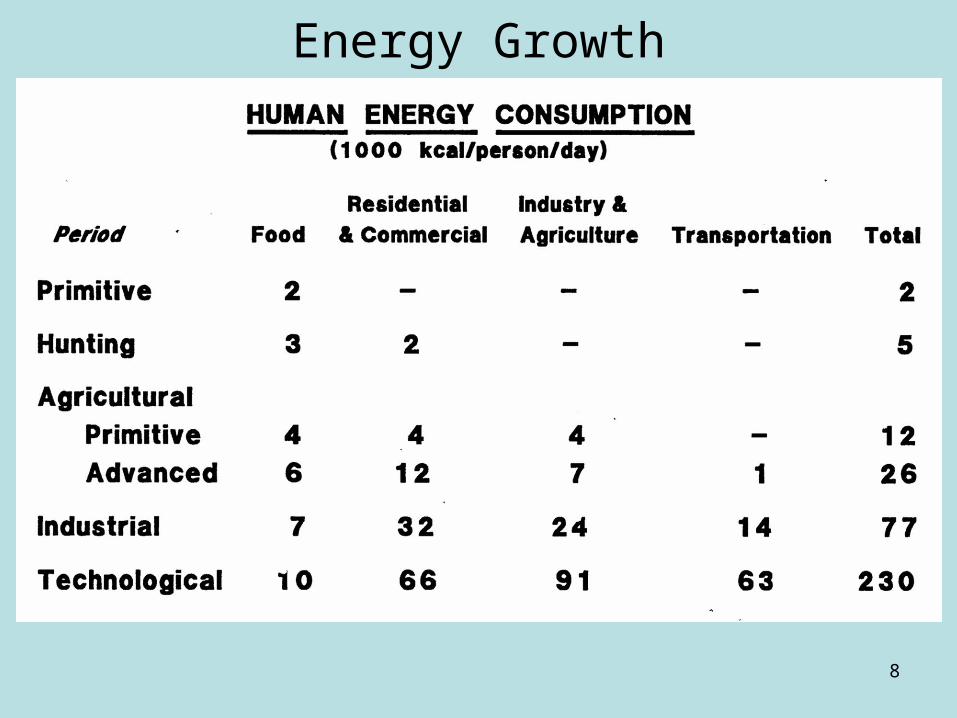
Energy Growth

9
Energy Growth (cont’d)
• As people became more advanced they had the freedom to use energy more and have a better lifestyle
• The energy used to produce food has slightly increased
• The energy for houses & commerce, industry, and transportation has significantly increased
• The forms of energy used have also changed
10
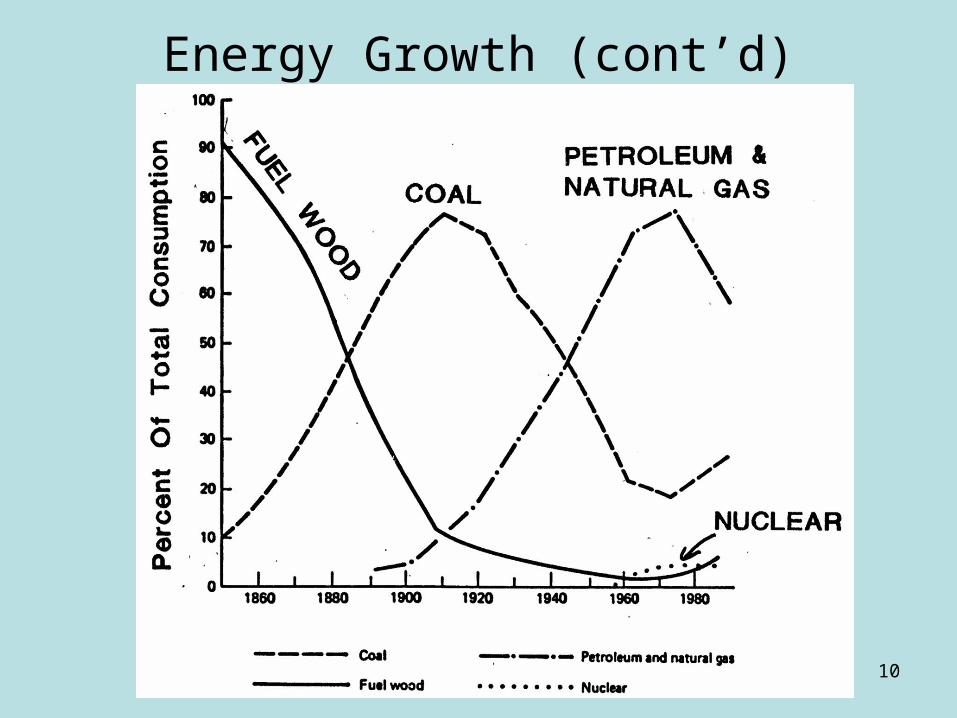
Energy Growth (cont’d)
11
Energy Growth (cont’d)
• As different forms of energy were found, society adapted and used the newer forms
• The newer forms usually had advantages of:→ Cheaper at first, more efficient, more versatile, easier
to obtain, more abundant
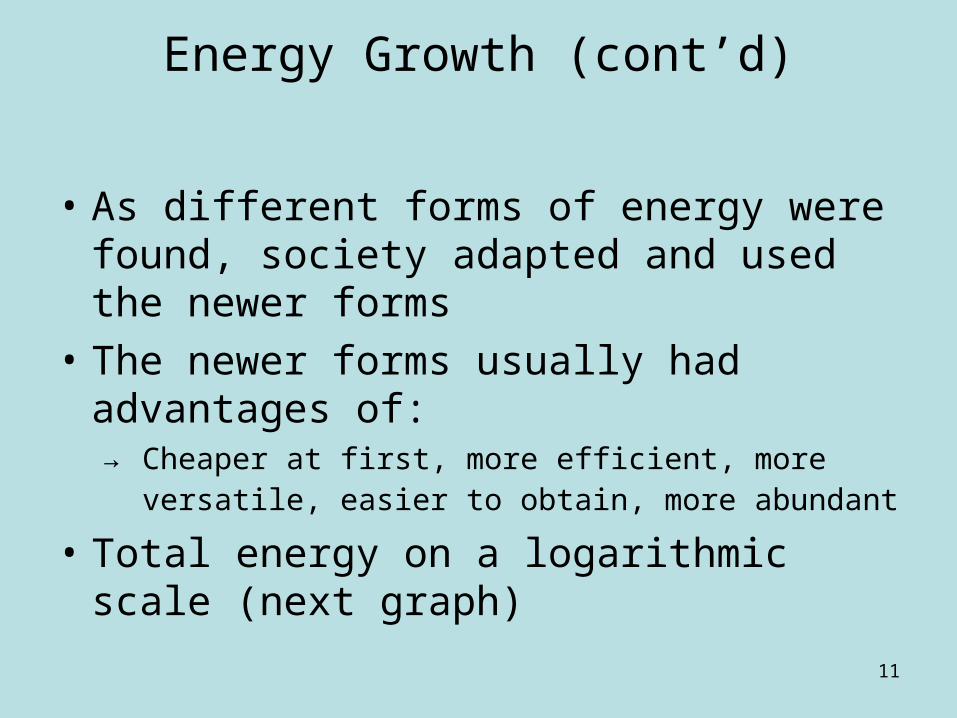
• Total energy on a logarithmic scale (next graph)
12
Energy Growth (cont)
13
Demand
20% ROI
10% ROI
En
erg
y (Q
uad
s)
Time (years)
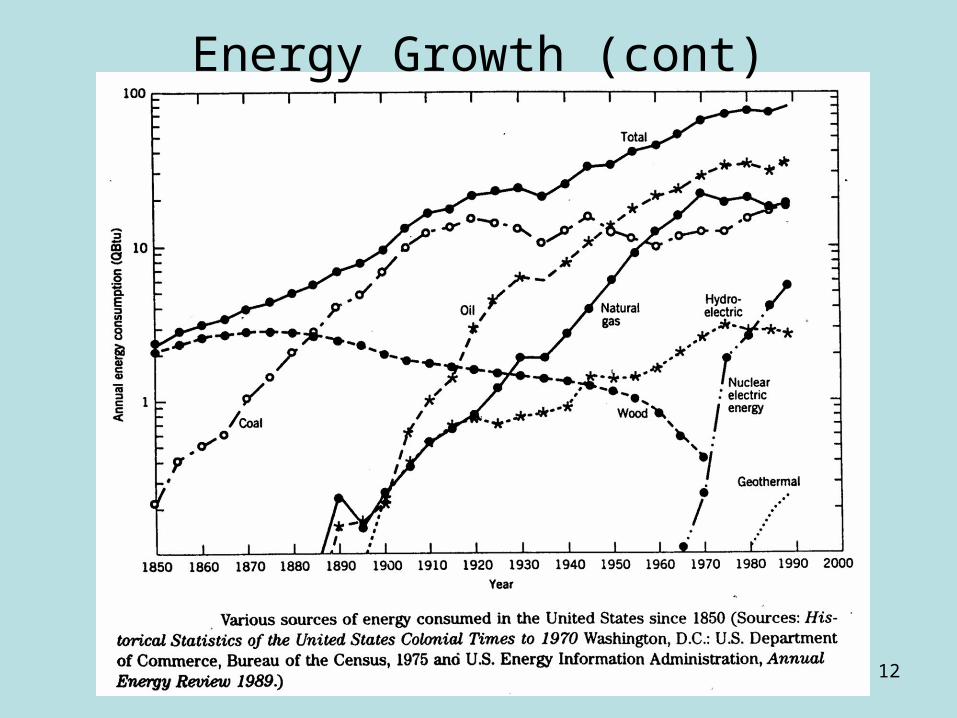
Energy Growth (cont’d)U.S. Energy Demand Versus Possible Supply from Solar Energy
14
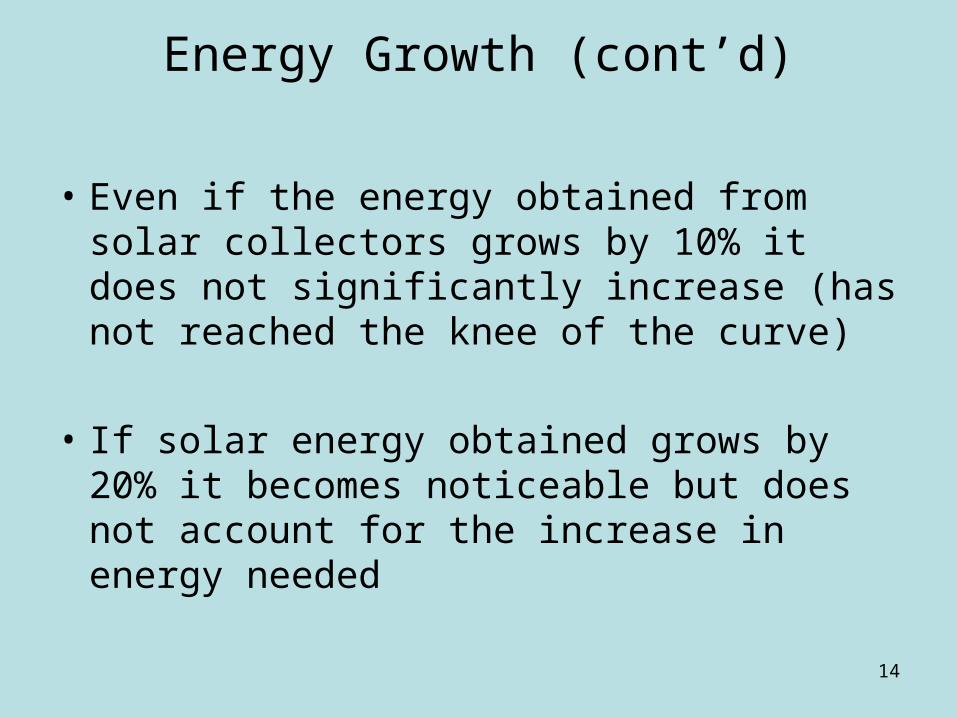
Energy Growth (cont’d)
• Even if the energy obtained from solar collectors grows by 10% it does not significantly increase (has not reached the knee of the curve)
• If solar energy obtained grows by 20% it becomes noticeable but does not account for the increase in energy needed
15
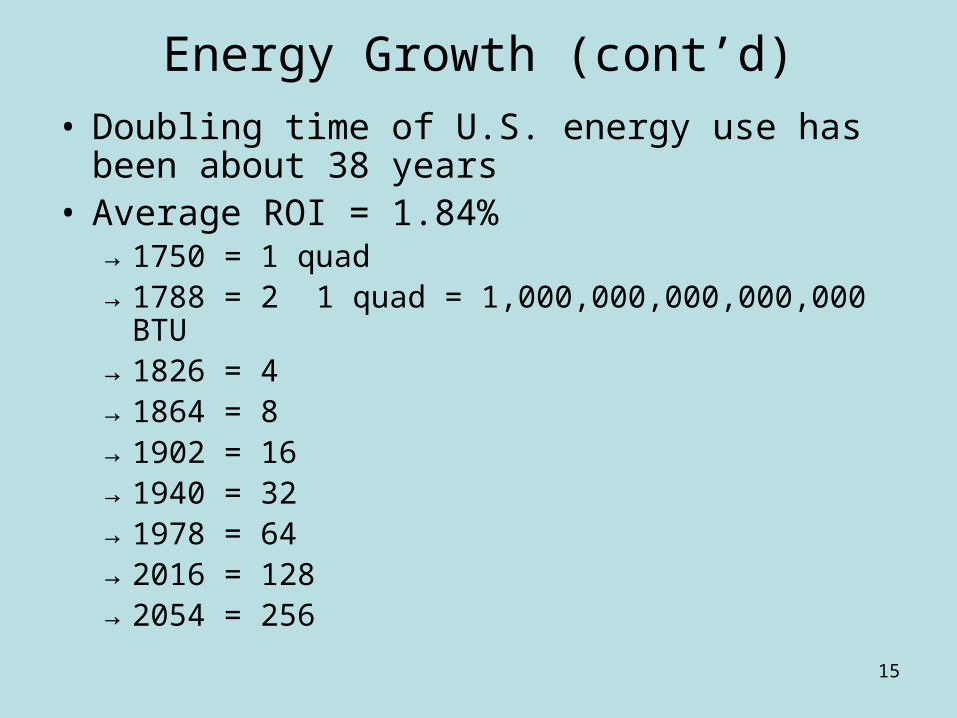
Energy Growth (cont’d)
• Doubling time of U.S. energy use has been about 38 years
• Average ROI = 1.84%→1750 = 1 quad →1788 = 2 1 quad = 1,000,000,000,000,000 BTU→1826 = 4→1864 = 8→1902 = 16→1940 = 32→1978 = 64→2016 = 128→2054 = 256
16
Growth Rates
• Growth rates are usually expressed as “Rate of Increase” (ROI)
• By knowing the ROI the “Doubling Period” can be determined, which is the amount of time needed for the value to double
• In Economics ROI = “Return on Investment” which means the same thing
17
Growth Rates (cont)
• An approximate equation for Doubling Period is:→ Doubling Period = 70* years / (% growth
rate)
• For example:→ What is the doubling period if the world’s
population is increasing at 1.3%?→ Doubling Period = 70 years / 1.3 = 53.8
years
* Actually closer to 72
18
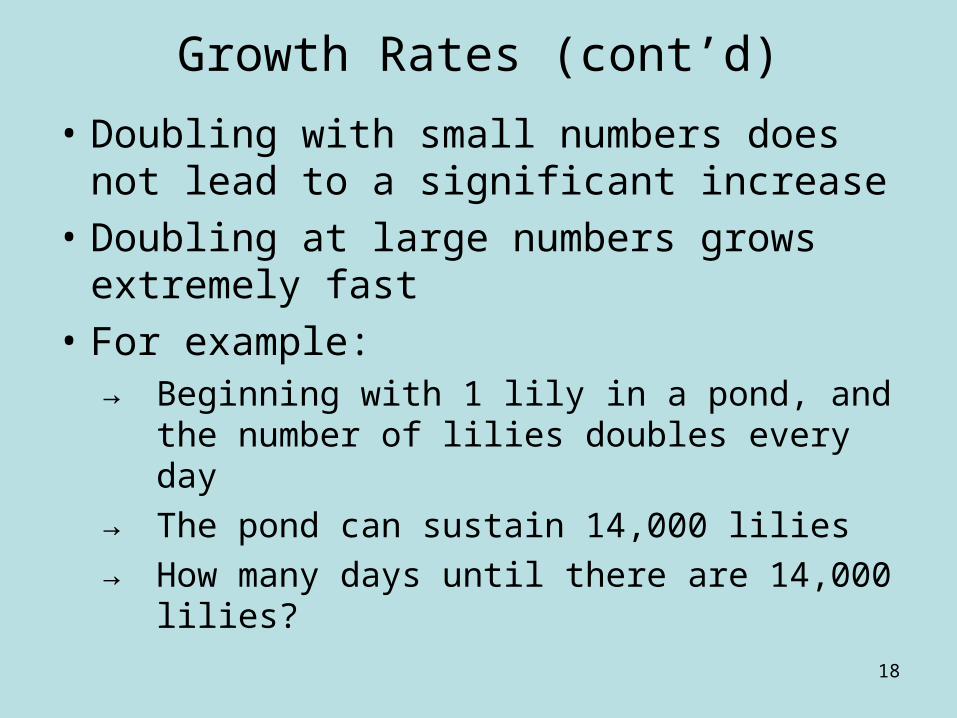
Growth Rates (cont’d)
• Doubling with small numbers does not lead to a significant increase
• Doubling at large numbers grows extremely fast
• For example: → Beginning with 1 lily in a pond, and the
number of lilies doubles every day→ The pond can sustain 14,000 lilies→ How many days until there are 14,000 lilies?

19
Lilies in Pond
Lilies in a Pond
(limit = 14,000 lilies)
Day Lilies
1 1
2 2
3 4
4 8
5 16
6 32
7 64
8 128
9 256
10 512
11 1024
12 2048
13 4096
14 8192
15 16,384

20
Lilies in Pond - Graphical

21
Growth Rates
What are the limiting agents that affect the growth of organisms?
→ Food Supply→ Energy Supply→ Space→ Pollution

22
Growth Rates (cont’d)
What happens when organism growth becomes limited?
→ Expansion to new territories→ War→ Disease→ Death
23
Growth Rates (cont’d)
• Hopefully technology breakthroughs will reduce or remove the limitations
→ Better food production techniques→ New energy sources→ Improved ways for using current energy
sources→ Improved medical procedures
• Uncertain when these will occur and in what areas (energy, food, medicine)
24
Growth Rates (cont’d)
What are the signs that an energy resource is starting to limit growth?
→ Total “cost-of-use” becomes unacceptable (too expensive)
→ Government places restrictions on use


