+ All Categories
Home > Documents > 1 Lecture 5: How to Design a Good Usability Evaluation Brad Myers 05-863 / 08-763 / 46-863:...

1 Lecture 5: How to Design a Good Usability Evaluation Brad Myers 05-863 / 08-763 / 46-863:...

Date post: 16-Dec-2015
Category:
Upload: arturo-culling
View: 215 times
Download: 0 times
Share this document with a friend
Popular Tags:
31
1 Lecture 5: How to Design a Good Usability Evaluation Brad Myers 05-863 / 08-763 / 46-863: Introduction to Human Computer Interaction for Technology Executives Fall, 2013, Mini 2 © 2013 - Brad Myers
Transcript

© 2013 - Brad Myers 1

Lecture 5:

How to Design aGood Usability Evaluation

Brad Myers

05-863 / 08-763 / 46-863: Introduction to Human Computer Interaction for Technology Executives

Fall, 2013, Mini 2

© 2013 - Brad Myers 2

Announcements HW 1 grades and comments already on

Blackboard Hurray for TAs!

12 people who are registered didn’t submit yet Definitely worthwhile if in the course, since

generous late penalty http://www.cs.cmu.edu/~bam/uicourse/08763fall13/grading.html

Be sure to drop officially if you aren’t actually take the course

© 2013 - Brad Myers 3

Why Evaluate with “Usability Evaluations”?

Following guidelines never sufficient for good UIs

Need both good design and user studies (Similar to users with CI) Note: users, subjects participants

Quality, before andafter user studies

Gooddesigners

Averagedesigners

4

“Don’ts” of Usability Evaluations Don’t evaluate whether it works (quality assurance) Don’t have experimenters evaluate it – get users Don’t (just) ask user questions. Not an “opinion

survey.” Instead, watch their behavior. Don’t evaluate with groups: see how well system

works for each person individually (not a “focus group”)

Don’t train users: want to see if they can figure it out themselves.

Don’t test user evaluate the system Not a “user test” call it Usability Evaluation instead

Don’t put your ego as a designer on the line© 2013 - Brad Myers

© 2013 - Brad Myers 5

Issue: Reliability

Do the results generalize to other people? Individual differences Up to a factor of 10 in performance

If comparing two systems Statistics for confidence intervals, p<.01 But rarely are doing A vs. B studies

Also, small number of users cannot evaluate an entire site Just a sample

© 2013 - Brad Myers 6

Issue: Validity

Did the evaluation measure what we wanted? Wrong users “Confounding” factors, etc,

Issues which were not controlled but not relevant to the evaluation

Other usability problems, setting, etc. Ordering effects Learning effects Too much help given to some users

© 2013 - Brad Myers 7

Plan your Evaluation Goals:

Formative – help decide features and design CIs Summative – evaluate system Now

Pilot evaluations Preliminary evaluations to check materials, look for bugs, etc. Evaluate the instructions, timing Users do not have to be representative

© 2013 - Brad Myers 8

Evaluation Design “Between subjects” vs. “within subjects”

For comparing different conditions Within:

Each user does all conditions Removes individual differences Add ordering effects

Between Each user does one condition Quicker for each user But need more users due to huge variation in people

Randomized assignment of conditions To people, or order

© 2013 - Brad Myers 9

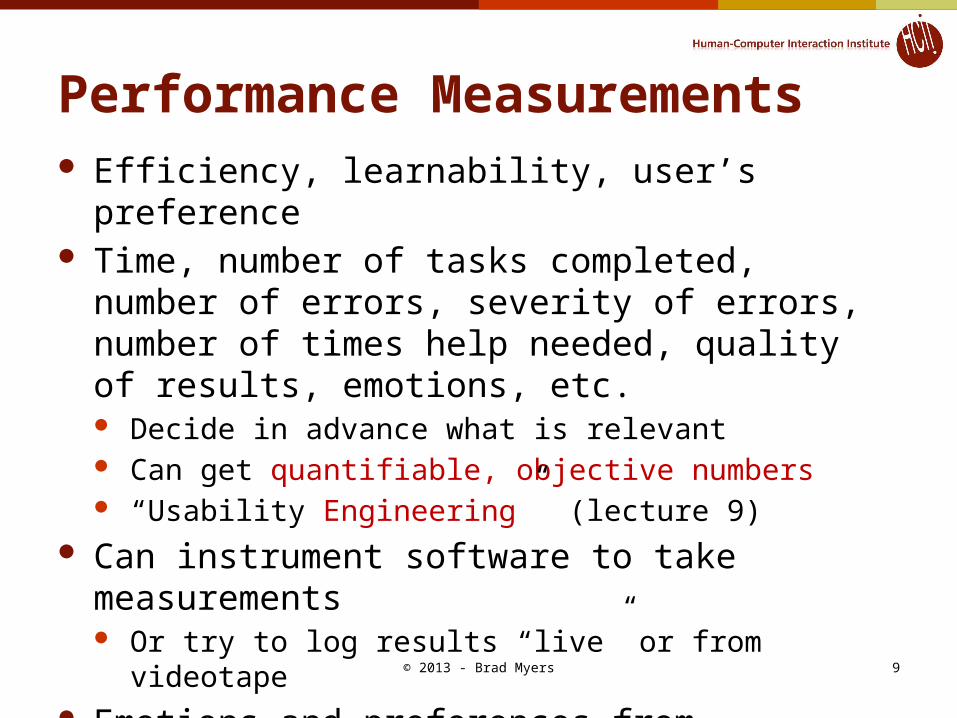
Performance Measurements Efficiency, learnability, user’s preference Time, number of tasks completed, number of errors,

severity of errors, number of times help needed, quality of results, emotions, etc. Decide in advance what is relevant Can get quantifiable, objective numbers “Usability Engineering” (lecture 9)

Can instrument software to take measurements Or try to log results “live” or from videotape

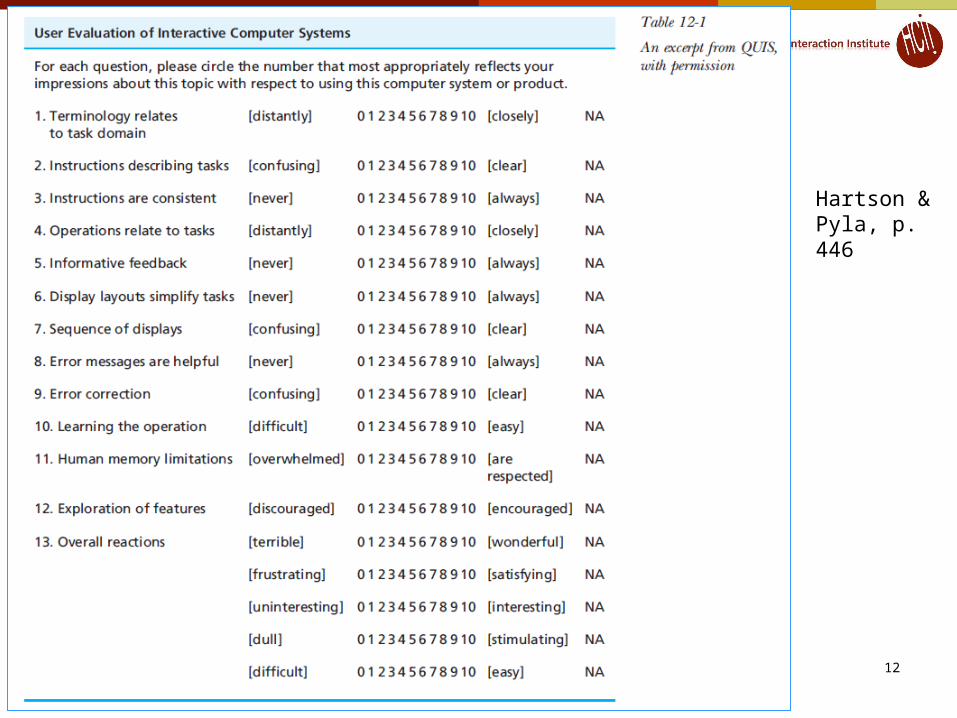
Emotions and preferences from questionnaires and apparent frustration, happiness with system

© 2013 - Brad Myers 10

Questionnaire Design

Collect general demographic information that may be relevant Age, sex, computer experience, etc.

Evaluate feelings towards your product and other products

Important to design questionnaire carefully Users may find questions confusing

May not answer the question you think you are asking May not measure what you are interested in

© 2013 - Brad Myers 11

Questionnaire, 2

“Likert scale” Propose something and let people agree or disagree:

agree disagreeThe system was easy to use: 1 .. 2 .. 3 .. 4 .. 5

“Semantic differential scale” Two opposite feelings:

difficult easyFinding the right information was: -2 .. -1 .. 0 .. 1 .. 2

If multiple choices, rank order them:Rank the choices in order of preference (with 1 being most preferred and 4 being least): Interface #1 Interface #2 Interface #3 Interface #4 (in a real survey, describe the interfaces)

© 2013 - Brad Myers 12

Survey example

Hartson & Pyla, p. 446

© 2013 - Brad Myers 13

Videotaping Often useful for measuring after the evaluation

But very slow to analyze and transcribe Useful for demonstrating problems to developers,

management Compelling to see someone struggling

Facilitate Impact analysis Which problems will be most important to fix? How many users and how much time wasted on each problem

But careful notetaking will often suffice when usability problems are noticed

© 2013 - Brad Myers 14

“Think Aloud” Protocols “Single most valuable usability engineering method” – Nielsen Get user to continuously verbalize their thoughts Find out why user does things

What thought would happen, why stuck, frustrated, etc. Encourage users to expand on whatever interesting But interferes with timings May need to “coach” user to keep talking

Unnatural to describe what thinking Ask general questions: “What did you expect”, “What are you

thinking now” Not: “What do you think that button is for”, “Why didn’t you click here” Will “give away” the answer or bias the user

Alternative: have two users and encourage discussion

© 2013 - Brad Myers 15

Getting Users Should be representative If multiple groups of users

Representatives of each group, if possible Issues:

Managers will pick most able people as participants Getting users who are specialists

E.g., doctors, dental assistants Maybe can get students, retirees

Paying users Novices vs. experts

Very different behaviors, performance, etc.

© 2013 - Brad Myers 16

Number of participants

About 10 for statistical studies As few as 5 for usability evaluation

Can update after each user to correct problems But can be misled by “spurious behavior” of a single person

Accidents or just not representative Five users cannot

evaluate all of a system

© 2013 - Brad Myers 17

Ethical Considerations No harm to the users Emotional distress

Highly trained people especially concerned about looking foolish

Emphasize system being evaluated, not user Results of evaluation and users’ identities kept secret Stop evaluation if user is too upset At end, ask for comments, explain any deceptions,

thank the participants At universities, have “Institutional Review Board” (IRB)

© 2013 - Brad Myers 18

Milgram Psychology Experiments

Stanley Milgram 1961-1962 Subject (“teacher” T) told by

experimenter (E) to shock another person ("Learner" L, an actor) if L gets answers wrong

> 65% of subjects were willing to give apparently harmful electric shocks – up to 450 volts – to a pitifully protesting victim

Study created emotional distress Some subjects needed significant

counseling afterward http://www.stanleymilgram.com/ Image from Wikipedia

© 2013 - Brad Myers 19

Authoring the Evaluation

Set up realistic situation Write up task scenarios Write detailed script of what you will say PRACTICE Recruit users

© 2013 - Brad Myers 20

Example Script (copied from lecture 3)

© 2013 - Brad Myers 21

Who runs the experiment? Trained usability engineers know how to run a valid

usability evaluation Called “facilitators” Good methodology is important

2-3 vs. 5-6 of 8 usability problems found

But useful for developers & designers to watch Available if system crashes or user gets

completely stuck But have to keep them from interfering

Randy Pausch’s strategy Having at least one observer (notetaker)

is useful Common error: don’t help too early!

© 2013 - Brad Myers 22

Where Evaluate? Usability Labs

Cameras, 2-way mirrors,specialists

Separate observationand control room Should disclose who is watching

Having one may increase usability evaluations in an organization

Can usually perform an evaluation anywhere Can use portable video recorder, screen recorder,

etc.

© 2013 - Brad Myers 23

Stages of an Evaluation Preparation Introduction Running the evaluation Cleanup after the evaluation

© 2013 - Brad Myers 24

Preparation and Introduction Make sure evaluation is ready to go before user arrives Introduce the observation phase

Say purpose is to evaluate software Consent form Pre-test questionnaire Give instructions Instruct them on how to do a think aloud Write down script to make sure consistent for all users

Final instructions (“Rules”): You won’t be able to answer questions during, but if

questions cross their mind, say them aloud If you forget to think aloud, I’ll say “Please keep talking”

© 2013 - Brad Myers 25

Running the Evaluation

Run the think-aloud At end:

Post-test questionnaire Explain purpose & any deceptions Thanks

© 2013 - Brad Myers 26

Cleaning up After an Evaluation

For desktop applications Remove old files, recent file lists, etc.

Harder for evaluations of web sites: In evaluations of web sites, need to remove

history to avoid hints to next user Browser history, “cookies”, etc.

© 2013 - Brad Myers 27

Analyze Think-Aloud Data

Not just a transcription of the tape. Establish criteria for critical incidents Record breakdowns and other observations (old: UAR Template):

http://www.cs.cmu.edu/~bam/uicourse/UARTemplate.doc

New: Form with rows: http://www.cs.cmu.edu/~bam/uicourse/UsabilityEvalReport_template.doc

© 2013 - Brad Myers 28

Analyzing the data Numeric data

Example: times, number of errors, etc. Tables and plots using a spreadsheet Look for trends and outliers

Organize problems by scope and severity Scope: How widespread is the problem? Severity: How critical is the problem?

© 2013 - Brad Myers 29

Scope and Severity Separately

Proportion of users experiencing the problem

Few Many

Impact of the problem on the

users who experience it

Small Low Severity Medium Severity

Large Medium Severity High Severity

© 2013 - Brad Myers 30

Write a Summarizing Report

“Executive” summary Conceptual re-designs are most important If just “tuning”, then a “top ten” list

Levels of severity help rank the problems “Highlights” video is often a helpful

communications device

© 2013 - Brad Myers 31

What to do with Results

Modify system to fix most important problems Can modify after each user, if don’t need

statistical results No need for other users to “suffer”

But remember: user is not a designer Don’t necessarily adopt the user’s fixes


Recommended