1 LECTURE 7 TRIGGERING MECHANISMS OF TURBIDITY CURRENTS CEE 598, GEOL 593 TURBIDITY CURRENTS: MORPHODYNAMICS AND DEPOSITS http:// clasticdetritus.com/ category/marine-science/ Scripps and La Jolla Submarine Canyons, San Diego, California What causes turbidity currents?
Transcript
1
LECTURE 7TRIGGERING MECHANISMS OF TURBIDITY CURRENTS
CEE 598, GEOL 593TURBIDITY CURRENTS: MORPHODYNAMICS AND DEPOSITS
ScrippsandLa Jolla Submarine Canyons, San Diego, California
What causes turbidity currents?
2
A PARTIAL LIST OF TRIGGERING MECHANISMS
1. Hyperpycnal flows
2. Surface waves
3. Breaching
4. Double-diffusive phenomenon
5. Transformation from slope failures and submarine debris flows
6. Internal waves
7. Wave-supported sheet turbidity currents
3
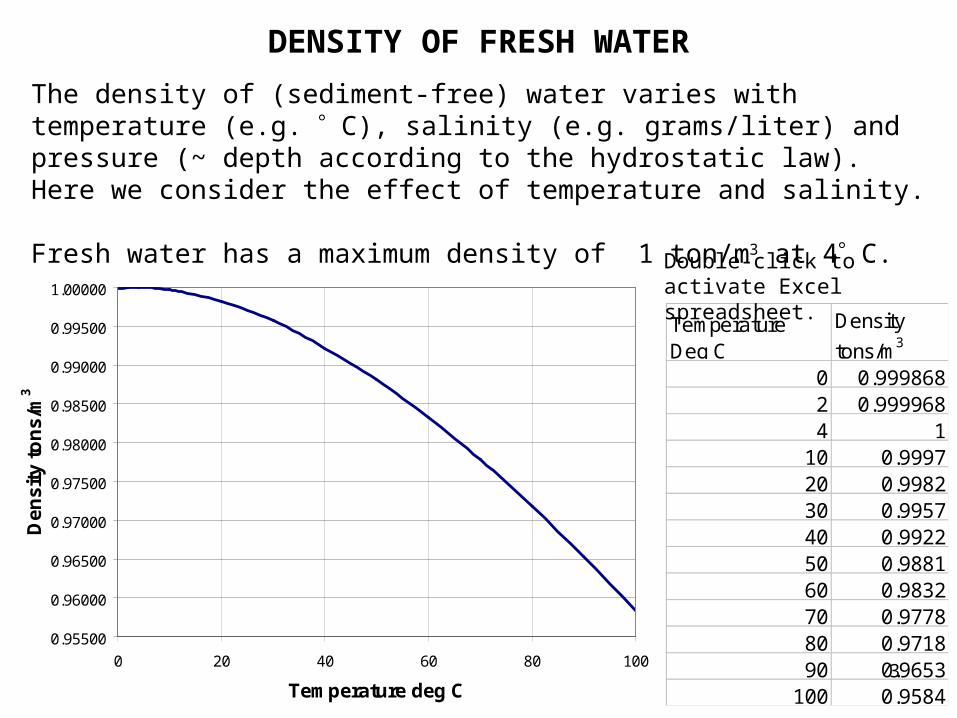
DENSITY OF FRESH WATER
The density of (sediment-free) water varies with temperature (e.g. C), salinity (e.g. grams/liter) and pressure (~ depth according to the hydrostatic law). Here we consider the effect of temperature and salinity.
Fresh water has a maximum density of 1 ton/m3 at 4 C.
The “standard” density of sea water is ~ 1.026 tons/m3. This corresponds to a salinity of 35000 mg/liters (35 grams/liter) and a temperature of 14 C. Increasing temperature (usually) makes water lighter, and increasing salinity makes it heavier.
You can find a calculator of seawater density athttp://www.csgnetwork.com/h2odenscalc.html
The density of seawater can, however, vary considerably. In brackish coastal waters near river mouths, the density can approach that of freshwater, i.e.
1.000 tons/m3. In nearly-enclosed seas with high evaporation rates, such as the Red Sea, the salinity can be as high as 40000 mg/liters. Assuming, for example, a water temperature of 20 C, the density is about
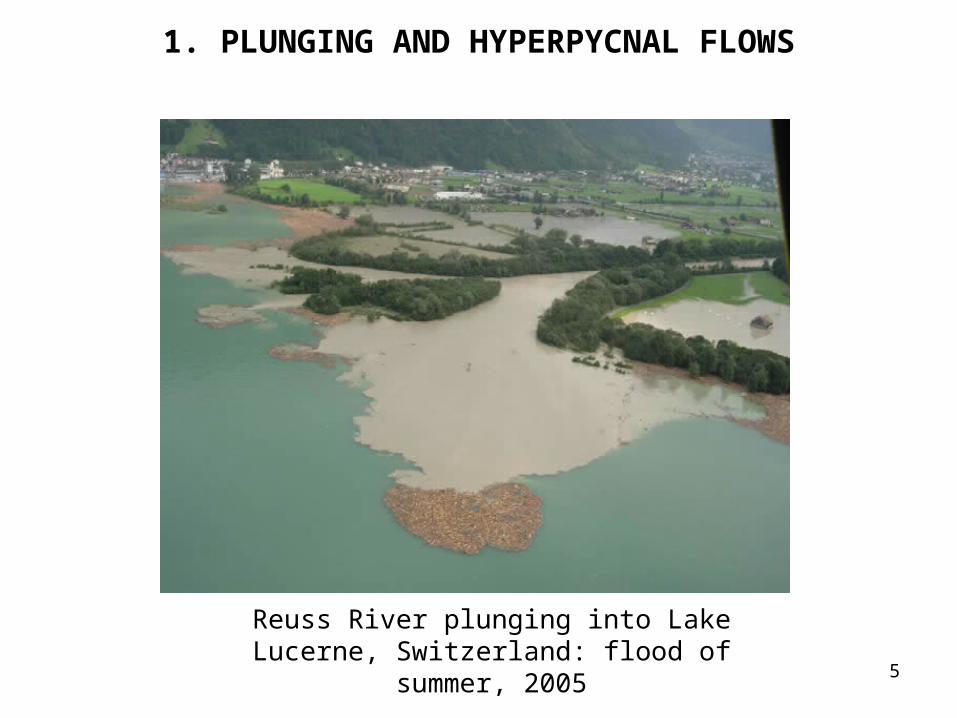
Reuss River plunging into Lake Lucerne, Switzerland: flood of summer, 2005
6
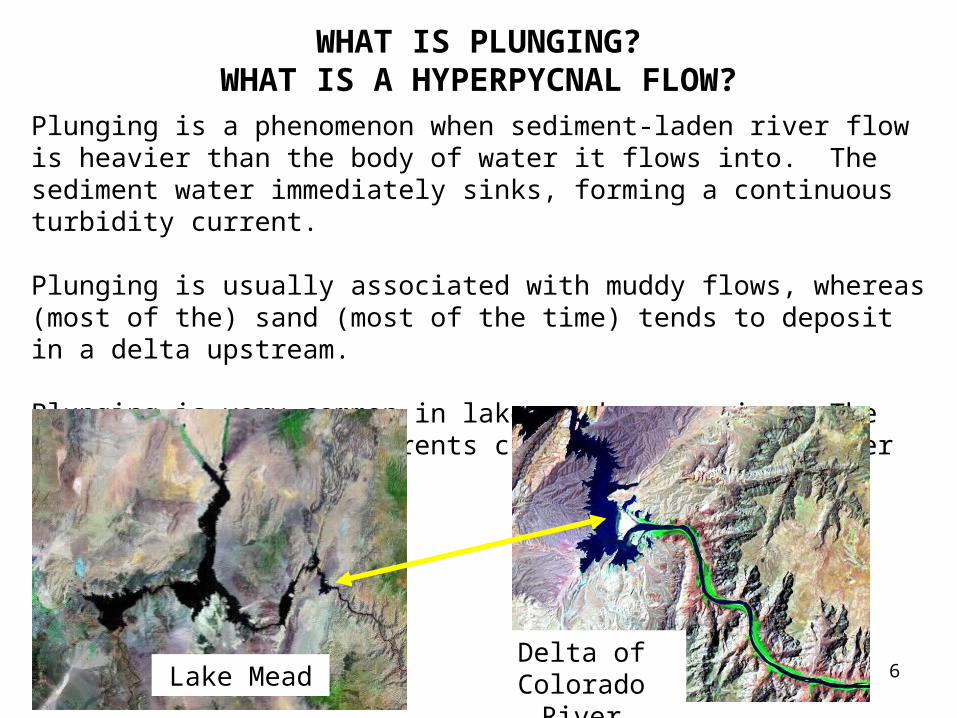
WHAT IS PLUNGING?WHAT IS A HYPERPYCNAL FLOW?
Plunging is a phenomenon when sediment-laden river flow is heavier than the body of water it flows into. The sediment water immediately sinks, forming a continuous turbidity current.
Plunging is usually associated with muddy flows, whereas (most of the) sand (most of the time) tends to deposit in a delta upstream.
Plunging is very common in lakes and reservoirs. The resulting turbidity currents can emplace sediment over long distances.
Lake MeadDelta of
Colorado River
7
PLUNGING IN LAKE MEAD
Image from USBR
Logjam near plunge point
plunge line
8
PLUNGING CREATES A HYPERPYCNAL FLOW
Hyper excess, pycnal density. So a hyperpycnal flow is a continuous bottom turbidity created by the excess density of the river flow relative to the ambient standing water due to the presence of sediment.
Coarser sediment deposits in delta (topset and foreset).
A (usually muddy) turbidity current is created by hyperpycnal conditions.
Finer sediment (mud) deposits in bottomset.
9
HYPOPYCNAL FLOWS
A hypopycnal flow is a sediment-laden surface plume created when the sediment-laden river water is less dense than the ambient water into which it flows. Sediment gradually rains out from the surface plume (hemipelagic sedimentation) to emplace the bottomset.
Coarser sediment deposits in delta (topset and foreset).
Surface plume of muddy water
Sediment gradually rains out to emplace the bottomset.
10
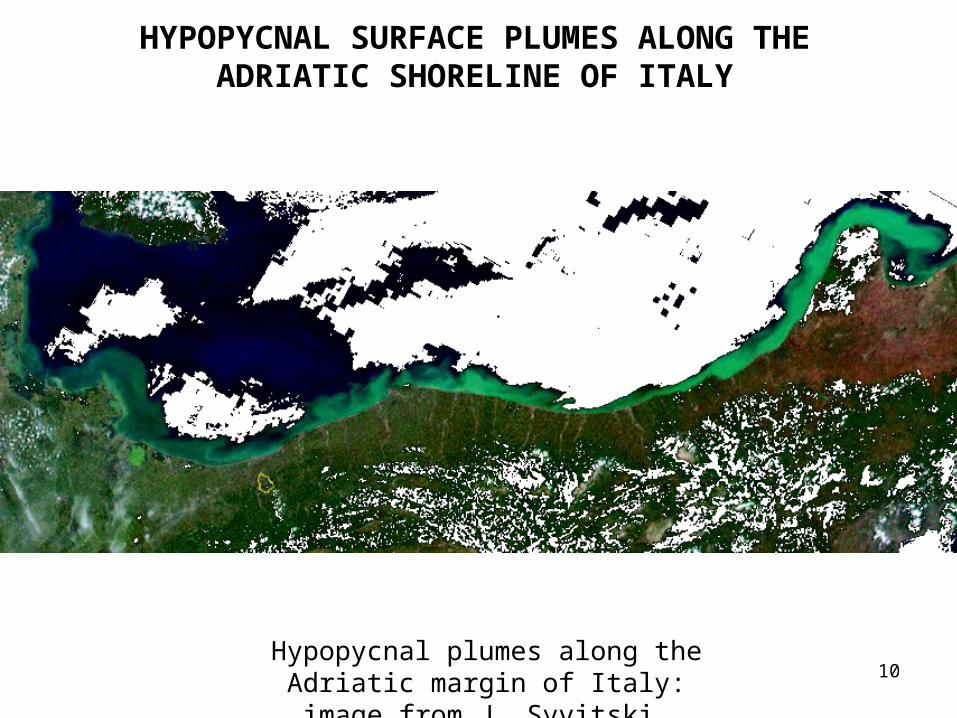
HYPOPYCNAL SURFACE PLUMES ALONG THE ADRIATIC SHORELINE OF ITALY
Hypopycnal plumes along the Adriatic margin of Italy: image from J. Syvitski.
11
TURBIDITES IN LAKE MEAD EMPLACED BY PLUNGING TURBIDITY CURRENTS
Twichell et al. (2006)
12
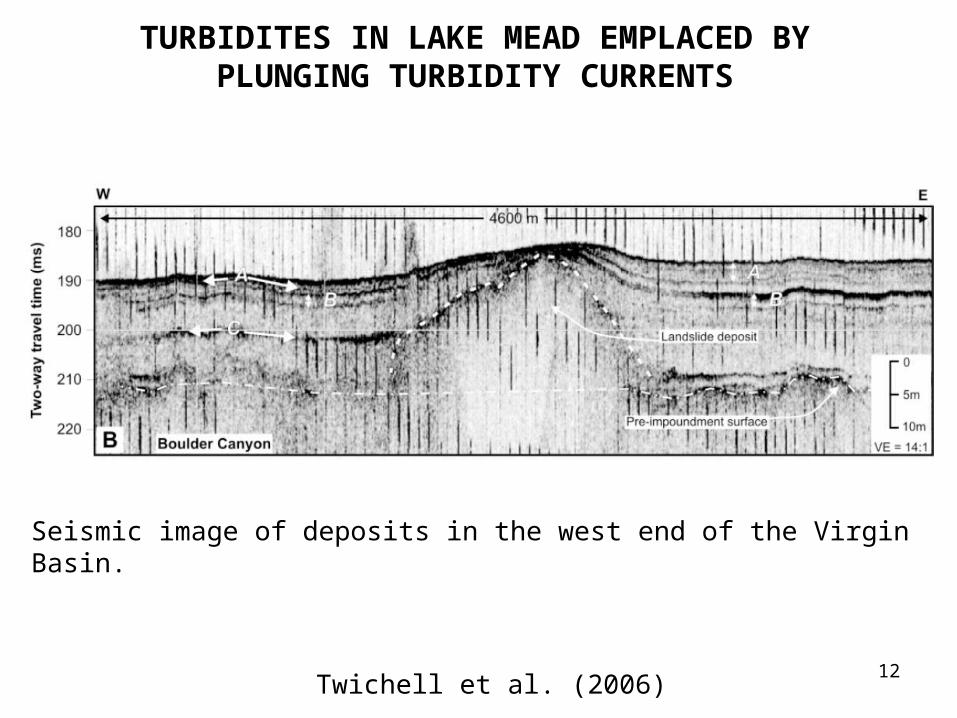
TURBIDITES IN LAKE MEAD EMPLACED BY PLUNGING TURBIDITY CURRENTS
Twichell et al. (2006)
Seismic image of deposits in the west end of the Virgin Basin.
13
RELATION BETWEEN SEDIMENT CONCENTRATION IN MG/L AND WATER DENSITY
Let X denote the concentration in mg/l. Where f equals the density of the sediment-laden flow, rw is the density of the river water without sediment and s denotes the density of sediment. The volume concentration C is given as
65.11R,1R
X10x1C
f
s
f
6
The density of the sediment-laden flow is thus
)RC1(rwf
14
HOW EASY IS IT TO CREATE PLUNGING IN FRESHWATER?
Suppose the lake has a temperature of 10 C (l = 0.9997 t/m3). We consider two cases: the river water has a temperature of 10 C (l = 0.9997
t/m3) and 20 C (rw = 0.9982 t/m3). In the latter case there is a temperature barrier to plunging). The minimum concentration is for plunging can be calculated with the spreadsheet. (Double-click to activate.) The minimum concentrations are 0 mg/l and 2413 mg/l.
As shown on the next slide, even a concentration of 2413 mg/l during floods is not uncommon in mountain streams.
lrwf )RC1(
1R
1R10x1X
1R
1C
rw
lf
6
rw
l
The minimum condition for plunging is:
Critical condition forhyperpycnal flow
rw 0.9982 t/m3
l 0.9997 t/m3
C 0.0009X 2413.4 mg/liter
15
SUSPENDED SEDIMENT CONCENTRATION IN RIVERS
Sediment concentrations are based on mean flows rather than flood flows. From USGS website.
16
Suspended Sediment Concentration Minnesota River Mankato
1
10
100
1000
10000
1 10 100 1000 10000
Q (m3/s)
X m
g/li
ter
SUSPENDED SEDIMENT CONCENTRATION IN THE MINNESOTA RIVER
17
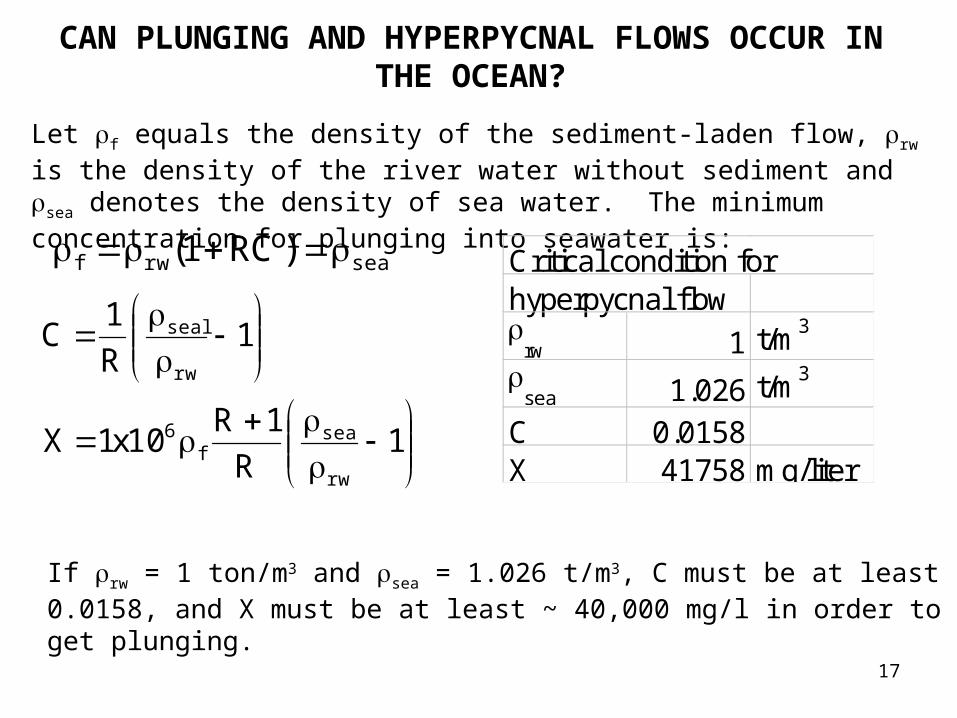
CAN PLUNGING AND HYPERPYCNAL FLOWS OCCUR IN THE OCEAN?
Let f equals the density of the sediment-laden flow, rw is the density of the river water without sediment and sea denotes the density of sea water. The minimum concentration for plunging into seawater is:
searwf )RC1(
1R
1R10x1X
1R
1C
rw
seaf
6
rw
seal
Critical condition forhyperpycnal flow
rw 1 t/m3
sea 1.026 t/m3
C 0.0158X 41758 mg/liter
If rw = 1 ton/m3 and sea = 1.026 t/m3, C must be at least 0.0158, and X must be at least ~ 40,000 mg/l in order to get plunging.
18
THIS CONDITION IS RARELY MET IN RIVERS
Sediment concentrations are based on mean flows rather than flood flows. From USGS website.
19
Mississippi River Tarbert Landing
0
500
1000
1500
2000
2500
3000
01-Oct-1949
27-Jun-1952
24-Mar-1955
18-Dec-1957
13-Sep-1960
10-Jun-1963
06-Mar-1966
30-Nov-1968
27-Aug-1971
23-May-1974
Day
Su
spen
ded
Sed
imen
t C
on
cen
trat
ion
mg
/lite
rAND IT IS ESPECIALLY RARELY MET IN LARGE,
LOWLAND RIVERS FLOWING INTO PASSIVE MARGINS
20
Mississippi Submarine Fan
meandering channel on fan
AND SO HYPERPYCNAL FLOWS ARE NOT LIKELY TO BE RESPONSIBLE FOR THE EMPLACEMENT OF MOST
LARGE SUBMARINE FANS ON PASSIVE MARGINS.
21
AND YET SOME RIVERS SOMETIMES DO FORM HYPERPYCNAL FLOWS WHEN THEY REACH THE SEA
Plunging of the Yellow River into the Bohai Sea, China
From International Journal of Sediment Research
And when they do they can move enormous amounts of sediment into the sea.
22
NOW WHERE MIGHT RIVERS FLOWING INTO THE SEA HAVE SUCH
HIGH CONCENTRATIONS OF
SUSPENDED SEDIMENT?
Active margins undergoing rapid uplift!
Erosion rates in mm/year for Taiwan.
Image courtesy C. Stark
16 of the rivers listed by Mulder and Syvitski (1995) that go hyperpycnal at least once per 100 years are in Taiwan
23
A DOCUMENTED CASE OF HYPERPYCNAL FLOW TO THE OCEAN
The Eel River in Northern California carries a very high sediment load. It is estimated to become hyperpycnal once every 10 years.
24
HYPERPYCNAL EVENT ON THE EEL RIVER
A hyperpycnal event was recorded and documented in the flood of 1995.
From Imran and Syvitski (2000)
25
2. TURBIDITY CURRENTS IN CANYONS GENERATED BY COASTAL SURFACE WAVE ACTION
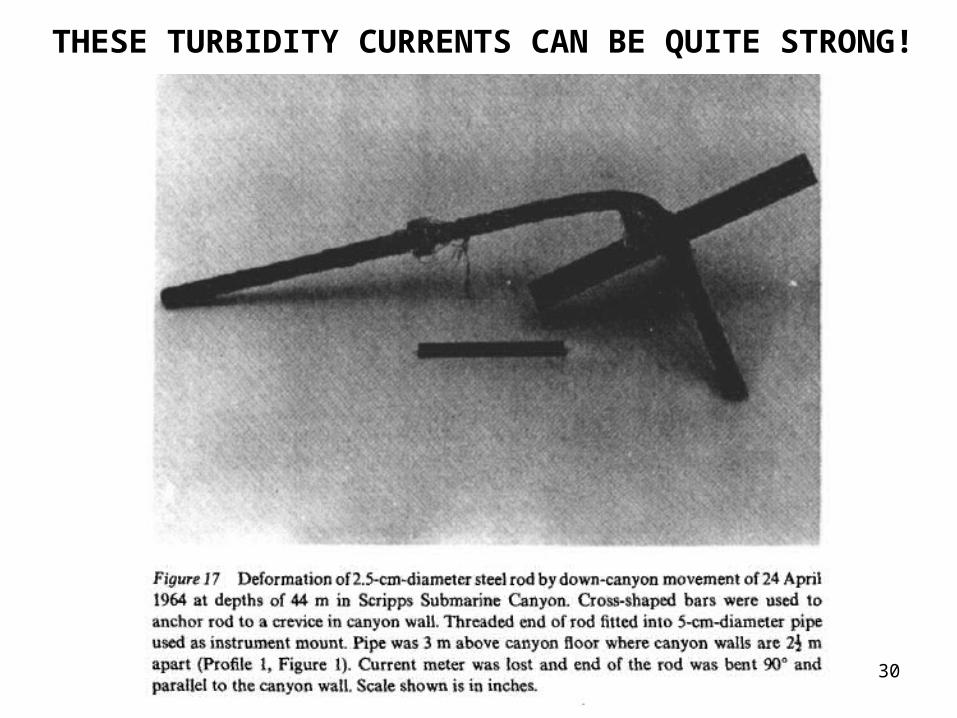
One of the first field measurements of turbidity currents in the ocean was performed in Scripps Submarine Canyon off San Diego, California (Inman et al., 1976).
The turbidity currents were generated by wave action, which was in turn driven by a winter storm.
26
LITTORAL DRIFT
The canyon is not located near a river mouth. The sediment (fine sand) is delivered from river mouths to the head of the canyon by littoral drift, mostly during the summer. The sediment piles up at the head of the canyon.
Littoral drift is an along-coast flow of sediment driven by incident waves that are not parallel to the shore.
Incident waves Reflected waves
Alongshore sediment transport
shore
27
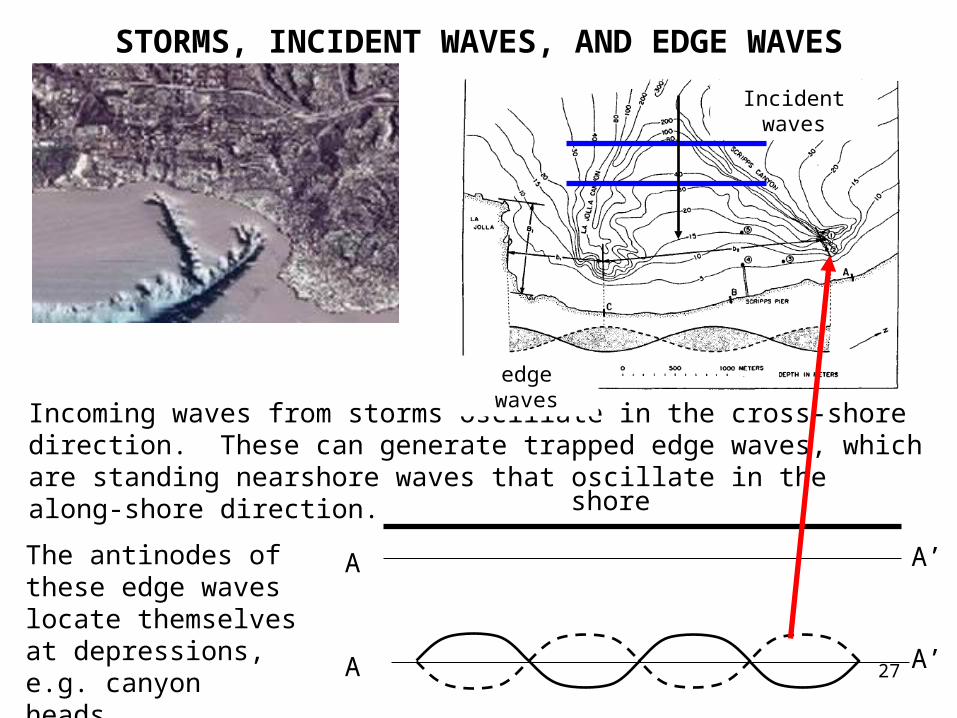
STORMS, INCIDENT WAVES, AND EDGE WAVES
Incoming waves from storms oscillate in the cross-shore direction. These can generate trapped edge waves, which are standing nearshore waves that oscillate in the along-shore direction.
The antinodes of these edge waves locate themselves at depressions, e.g. canyon heads.
A
shore
Incident waves
edge waves
A’
A A’
28
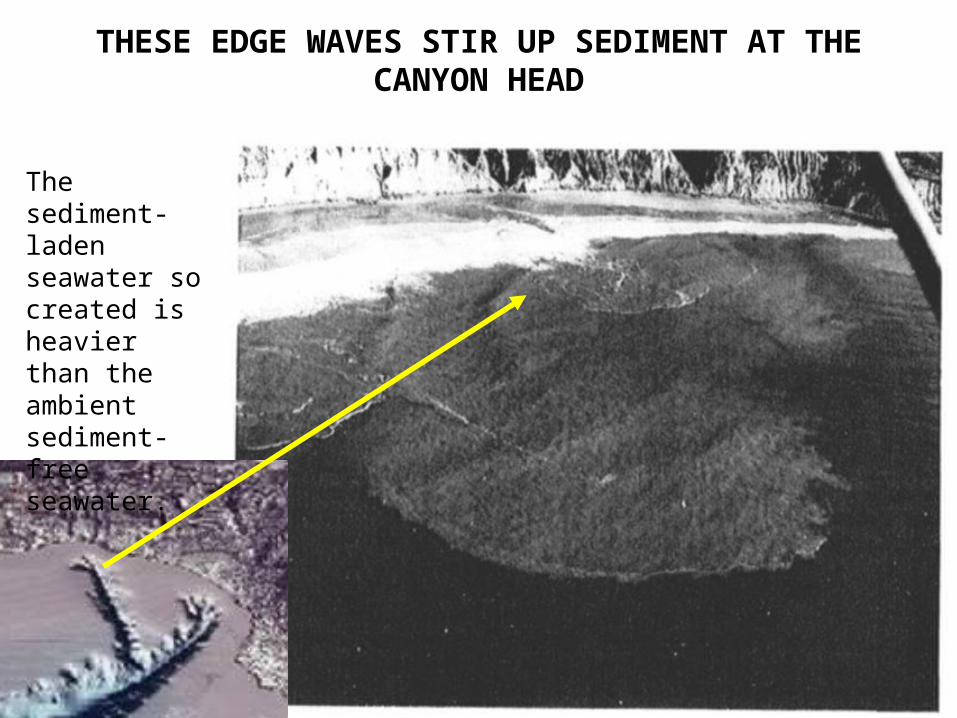
THESE EDGE WAVES STIR UP SEDIMENT AT THE CANYON HEAD
The sediment-laden seawater so created is heavier than the ambient sediment-free seawater.
29
AND THE RESULT IS A DOWN-CANYON TURBIDITY CURRENT
The current so created is sustained as long as the edge waves are present and there is sediment available in the canyon head (hours, or even days). A storm immediately subsequent to one that generated a turbidity current often creates no turbidity current, because there is no longer any sediment available.
30
THESE TURBIDITY CURRENTS CAN BE QUITE STRONG!
31
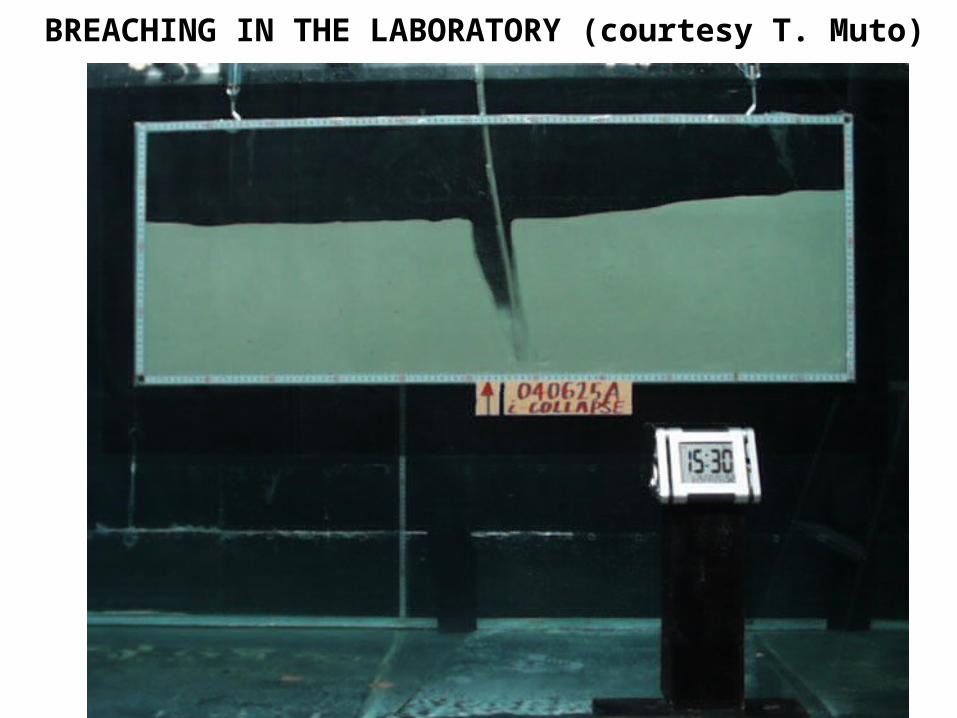
Breaching is the sustained, slow failure of a near-vertical subaqueous face of slightly overdensified clean, fine sand by spalling of sediment from the face.
4. TURBIDITY CURRENTS CREATED BY BREACHING
See van den Berg et al. (2002); Mastbergen and van den Berg (2003).
32
BREACHING HAS BEEN USED BY THE DREDGING INDUSTY IN THE NETHERLANDS TO INSTIGATE SELF-SUSTAINED
REMOVAL BY MEANS OF SPALLING TO A TURBIDITY CURRENT
33
A SLOW BREACH FAILURE LAUNCHES A BOAT
34
BREACHING IN THE LABORATORY (courtesy T. Muto)
35
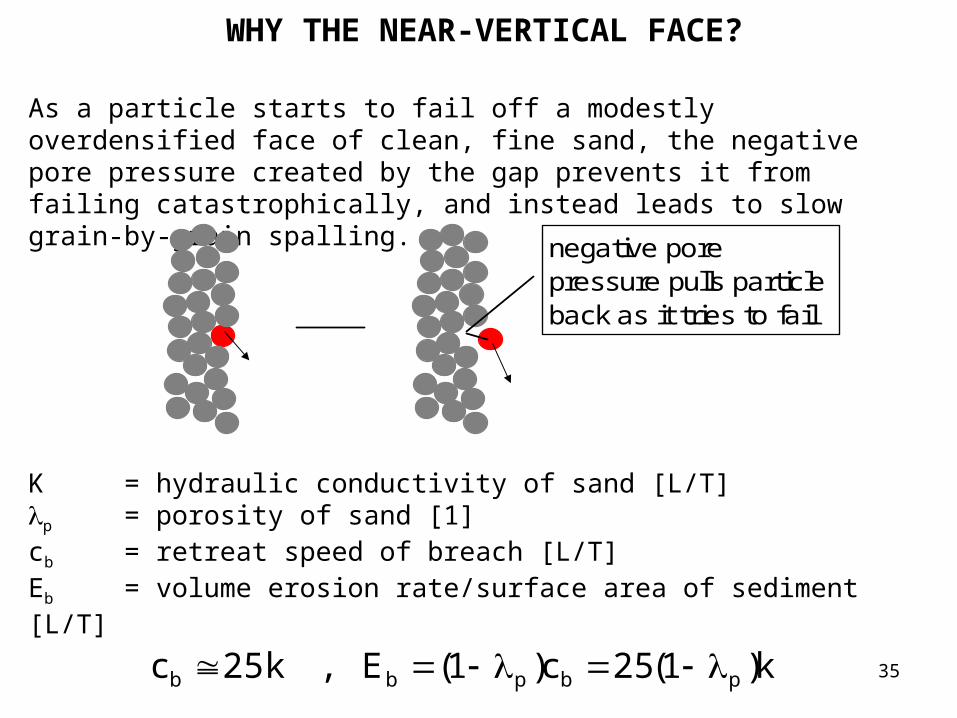
WHY THE NEAR-VERTICAL FACE?
As a particle starts to fail off a modestly overdensified face of clean, fine sand, the negative pore pressure created by the gap prevents it from failing catastrophically, and instead leads to slow grain-by-grain spalling.
negative pore pressure pulls particle back as it tries to fail
K = hydraulic conductivity of sand [L/T]p = porosity of sand [1]cb = retreat speed of breach [L/T]Eb = volume erosion rate/surface area of sediment [L/T]
k)1(25c)1(E,k25c pbpbb
36
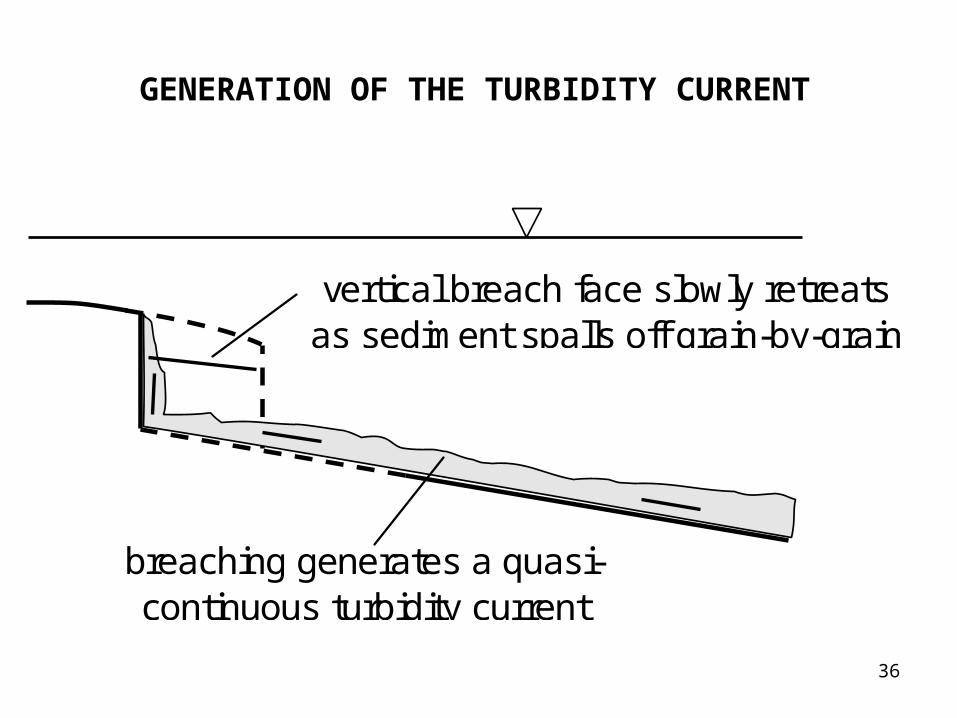
GENERATION OF THE TURBIDITY CURRENT
vertical breach face slowly retreats
as sediment spalls off grain-by-grain
breaching generates a quasi-continuous turbidity current
37
TURBIDITY CURRENT GENERATED BY BREACHING IN THE LABORATORY
38
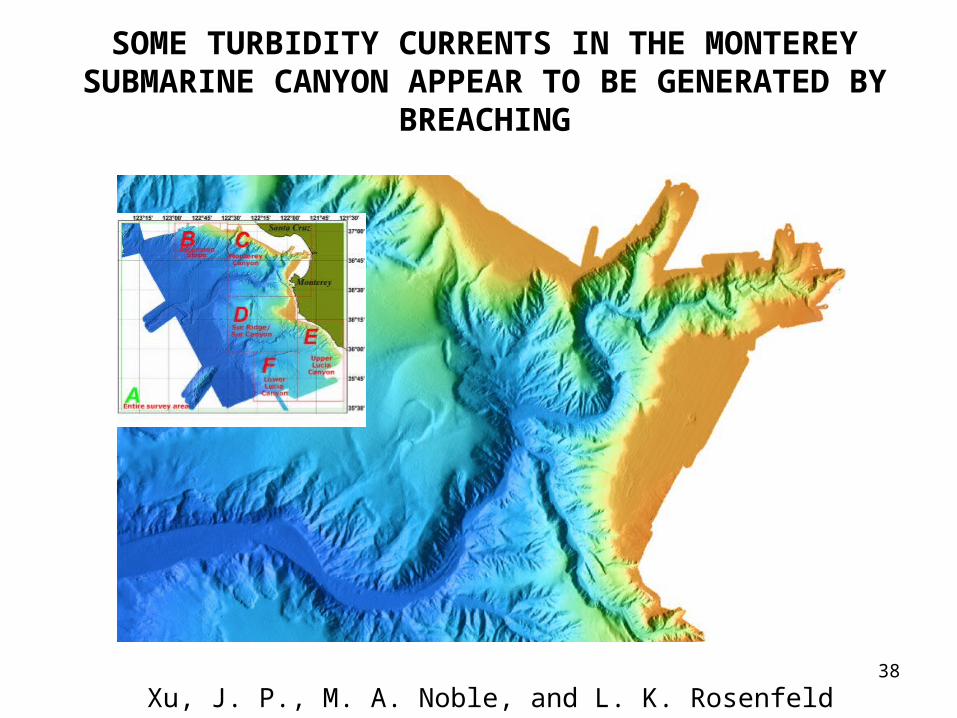
SOME TURBIDITY CURRENTS IN THE MONTEREY SUBMARINE CANYON APPEAR TO BE GENERATED BY
BREACHING
Xu, J. P., M. A. Noble, and L. K. Rosenfeld (2004)
39
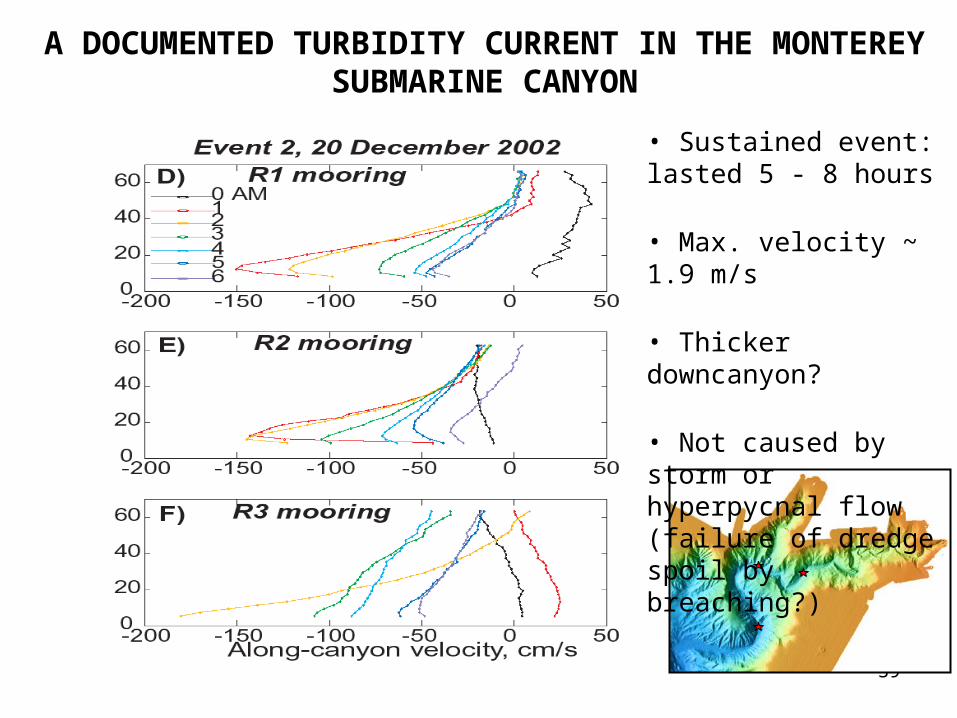
• Sustained event: lasted 5 - 8 hours
• Max. velocity ~ 1.9 m/s
• Thicker downcanyon?
• Not caused by storm or hyperpycnal flow (failure of dredge spoil by breaching?)
A DOCUMENTED TURBIDITY CURRENT IN THE MONTEREY SUBMARINE CANYON
40
4. TURBIDITY CURRENTS GENERATED BY DOUBLE DIFFUSION
Double-diffusion phenomena were discovered in the context of the ocean.
As noted in a previous slide, (sediment-free) oceanic water varies in both salinity and temperature. A higher salinity makes water heavier. A higher temperature makes water lighter. In the ocean, the density of water is controlled by both factors.
In oceanic waters, heat and salt can be fluxed by both convection and molecular diffusion.
Here we are interested in flux by molecular diffusion. Diffusion fluxes a quantity from a zone of high concentration to low concentration. Consider any quantity per unit volume b (e.g. heat in joules per unit volume or salt in grams per unit volume. We further assume that this quantity decreases in the x direction.
Diffusive flux transports a quantity from high concentration to low concentration, or in this case in the positive x direction.
41
WHAT IS DOUBLE DIFFUSION? contd.
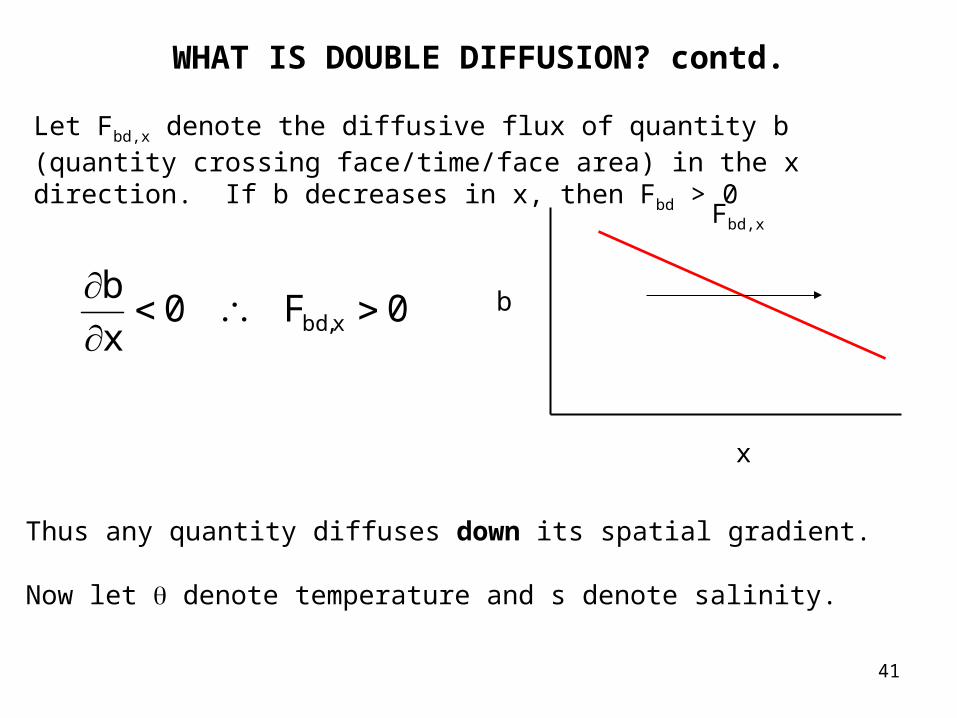
Thus any quantity diffuses down its spatial gradient.
Now let denote temperature and s denote salinity.
0F0x
bx,bd
Let Fbd,x denote the diffusive flux of quantity b (quantity crossing face/time/face area) in the x direction. If b decreases in x, then Fbd > 0
b
x
Fbd,x
42
WHAT IS DOUBLE DIFFUSION? contd.
where w is the density of the water, cp is the specific heat of water at constant pressure (e.g. no. of joules required to raise 1 kg by 1 C) and Dh and Ds denotes the kinematic diffusivity of heat and salt (e.g. m2/s).
Typical values of cp, Dh and Ds are 4.18 x 103,1.45 x 10-7 m2/s and1.35 x 10-9 m2/s
The point to note here is:
This means that in a relative sense, salt diffuses much less rapidly than heat.
We denote the temperature as and the salinity as s. The diffusive flux of heat and salt in the x-direction are denoted as Fhd, x and Fsd,x. These terms are given as
x
sDF,
xDcF sx,sdhpwx,hd
1D/D hs
43
THE FIRST CASE OF DOUBLE DIFFUSION: HENRY STOMMELS PERPETUAL SALT FOUNTAIN
Consider an aluminum tube that extends vertically from the deep ocean to the surface. We assume that warm, saline water at the surface overlies cold, less saline water at depth. The water is stably stratified, i.e. the deep water is denser than the surface water.
But suppose we start a vertical flow in the pipe. The flow will sustain itself creating a “perpetual” salt fountain!
Why? As the flow in the pipe rises, heat diffuses across the pipe walls, warming the pipe water to the temperature of the seawater surrounding it.
But salt cannot diffuse in due to the walls. So the water from depth arrives at the surface with the same temperature as the surface water, but a lower salinity. Being lighter than seawater, it fountains upward!
cold, less salty
Warm, more salty
Warm, less salty
Heat diffuses in, but not salt
44
DOUBLE DIFFUSIVE MECHANISM FOR TURBIDITY CURRENTS
Consider hypopycnal river freshwater entering the sea. For simplicity, we assume that both are at the same temperature. The coarse sediment deposits to form a delta, and the fine sediment, i.e. mud, forms a surface plume.
fresh, sediment-laden water
surface plume
saline water
delta
45
DOUBLE DIFFUSIVE MECHANISM FOR TURBIDITY CURRENTS contd.
The kinematic diffusivity of mud, which is governed by Brownian motion, is far less that the kinematic diffusivity of salt.
Consider a blob of mud-laden, fresh water at the interface.
fresh, sediment-laden water
surface plume
saline water
delta
46
DOUBLE DIFFUSIVE MECHANISM FOR TURBIDITY CURRENTS contd.
Salt can diffuse into the blob much faster than sediment diffuses out. As a result, the blob can get heavier than the surrounding saltwater and sink.
Parsons and Garcia (2000)
47
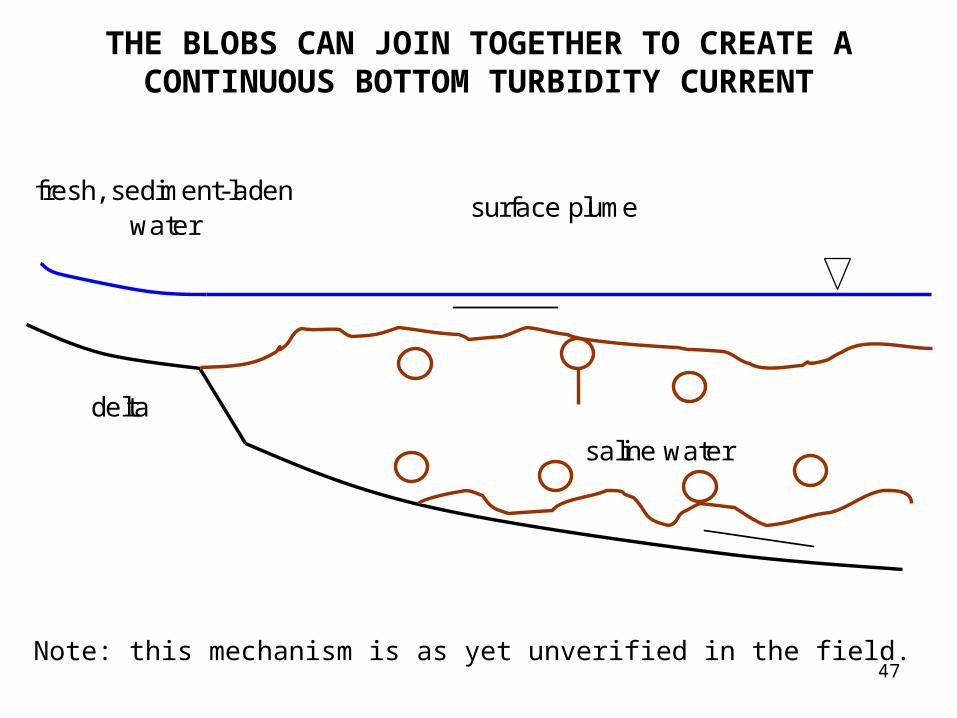
THE BLOBS CAN JOIN TOGETHER TO CREATE A CONTINUOUS BOTTOM TURBIDITY CURRENT
Note: this mechanism is as yet unverified in the field.
fresh, sediment-laden water
surface plume
saline water
delta
48
5. TRANSFORMATION FROM SLOPE FAILURES AND SUBMARINE DEBRIS FLOWS
Submarine landslides and debris flows can generate turbidity currents as sediment is entrained into suspension from their heads (and also their bodies). The landslide/debris flow can come to rest, but the turbidity current can run out much father distances.
slide scar
antecedent seafloor profile
landslide/debris flow(comes to rest)
turbidity current (can go much farther before coming to rest)
49
THE GRAND BANKS SUBMARINE LANDSLIDE/TURBIDITY CURRENT
An earthquake in 1929 generated the Grand Banks failure, which produced a huge submarine landslide that devolved into a debris flow, and then into a turbidity current that ran long distances. The layer of sand deposited by the turbidity current covered a surface the size of Quebec. Maximum turbidity current velocities may have been as high as 18 m/s, as evidenced from the timing of transatlantic submarine cable breaks. This event served to catalyze interest in turbidity currents as a submarine process for the redistribution of sediment (e.g. Heezen and Ewing, 1952; Kuenen, 1952).
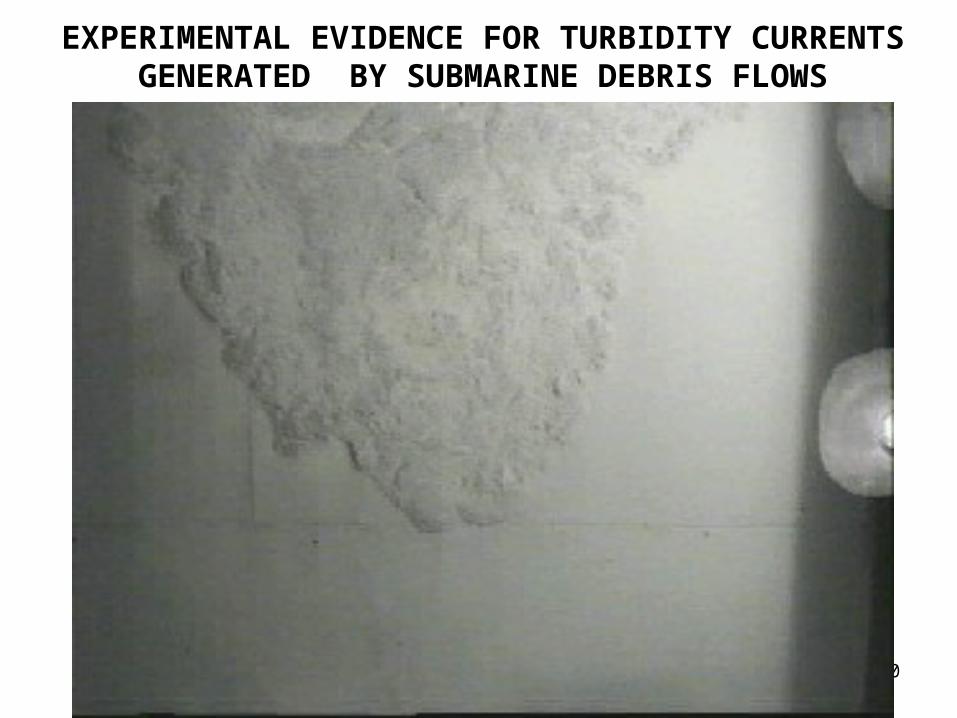
EXPERIMENTAL EVIDENCE FOR TURBIDITY CURRENTS GENERATED BY SUBMARINE DEBRIS FLOWS
51
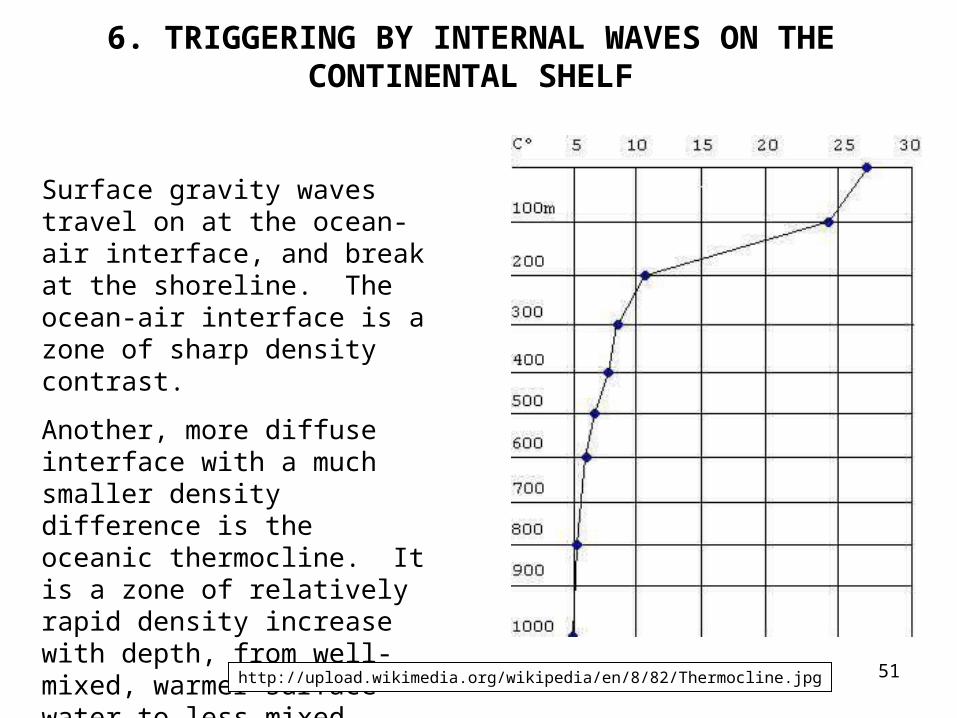
6. TRIGGERING BY INTERNAL WAVES ON THE CONTINENTAL SHELF
Surface gravity waves travel on at the ocean-air interface, and break at the shoreline. The ocean-air interface is a zone of sharp density contrast.
Another, more diffuse interface with a much smaller density difference is the oceanic thermocline. It is a zone of relatively rapid density increase with depth, from well-mixed, warmer surface water to less-mixed, colder water at depth.
Internal waves can form and propagate along the thermocline. It has been hypothesized that internal waves breaking on the continental slope could be responsible for the generation of turbidity currents (D. Cacchione).
A VIEW OF BREAKING INTERNAL WAVES IN THE LABORATORY
54
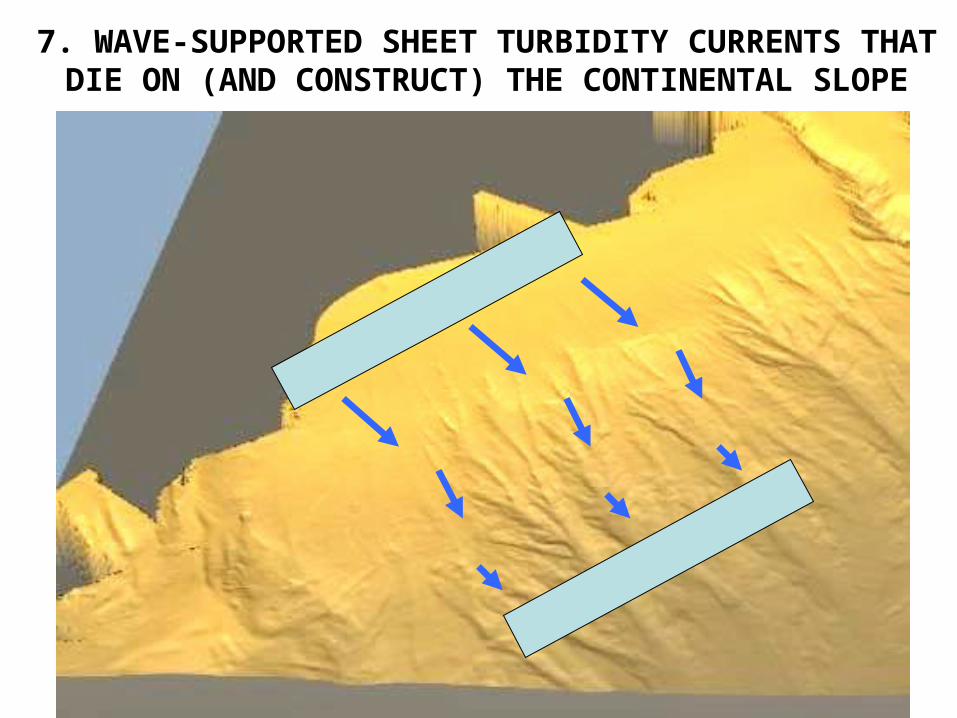
7. WAVE-SUPPORTED SHEET TURBIDITY CURRENTS THAT DIE ON (AND CONSTRUCT) THE CONTINENTAL SLOPE
55
WAVE-SUPPORTED SHEET TURBIDITY CURRENTS
wave-current boundary layer on shelf edge net-depositional turbidity
current on slope
turbidity current becomes extremely thick and dilute as it
decelerates
56landcontinental
shelfcontinental
slope sea
sediment supply
wave orbital amplitude
suspended sediment concentration profile
waves
below wave base
above wave base
WAVE-SUPPORTED SHEET TURBIDITY CURRENTS CAN BE GENERATED BY WAVE-CURRENT BOUNDARY
LAYERS ON THE CONTINENTAL SHELF
Wave-supported turbidity current
57
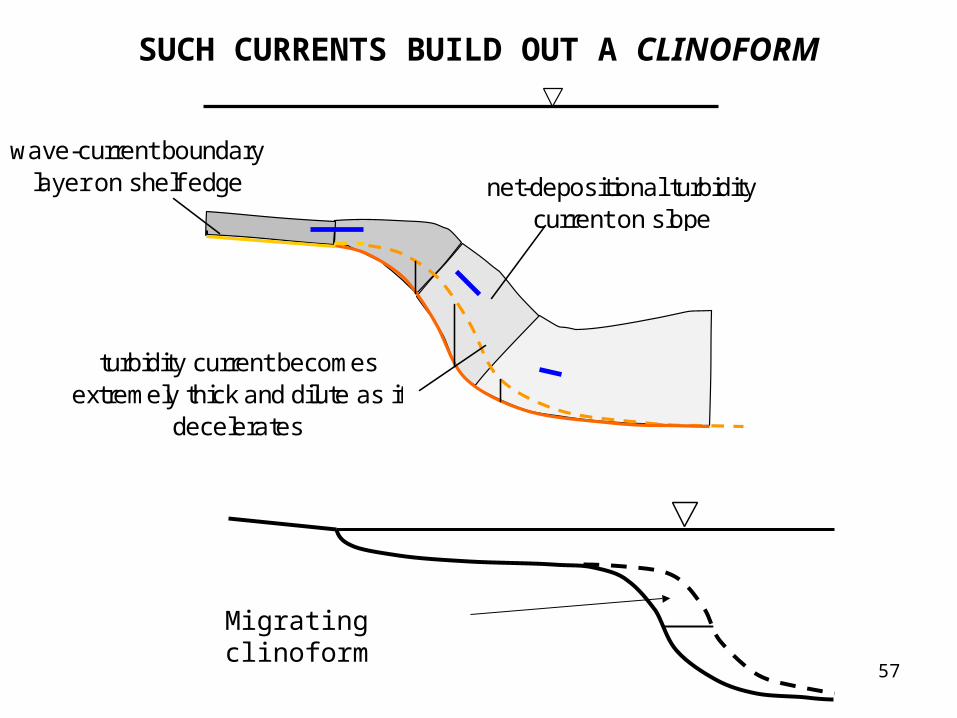
SUCH CURRENTS BUILD OUT A CLINOFORM
wave-current boundary layer on shelf edge net-depositional turbidity
current on slope
turbidity current becomes extremely thick and dilute as it
decelerates
Migrating clinoform
581 km10 ms
Late Holocene Adriatic clinoform
Wave resuspension
Diluted muddyturbidity currents
THE CLINOFORM THUS BUILDS OUTWARD, EXTENDING THE SHELF
Slide courtesy F. Trincardi
Your first seismic image!
59
GANGES-BRAHMAPUTRA DELTA
60
GANGES-BRAHMAPUTRA CLINOFORM: KUEHL ET AL. (1997)
Topset deposit = deposit on shelf
Foreset deposit = deposit on slope
Bottomset deposit = deposit on slope base/rise
61
References to collectMulder and Syvitski (1995)Parsons and Garcia (2000)Imran and Syvitski (2000)Van den Berg et al. (2002)Mastbergen et al. (2003)TrincardiKuehlXu, J. P., M. A. Noble, and L. K. Rosenfeld (2004), In-situ measurements of velocity
structure within turbidity currents, Geophys. Res. Lett., 31, L09311, doi:10.1029/2004GL019718.
Kuenen, P. H. (1952) Estimated size of the Grand Banks [Newfoundland] turbidity current, American Journal of Science, 250, 874-884.
Heezen, B.C., and Ewing, M. (1952) Turbidity currents and submarine slumps and the 1929 Grand Banks earthquake, American Journal of Science, 250, 849-873.
Mohrig, D. and Marr, J. G. (2003) Constraining the efficiency of turbidity current generation from submarine debris flows and slides using laboratory experiments, Marine and Petroleum Geology, 20(6-8), 883-899.