+ All Categories
Home > Documents > 1 Managed Care Digest Series ®, © 2013 sanofi-aventis U.S. LLC, A SANOFI COMPANY Data source: IMS...

1 Managed Care Digest Series ®, © 2013 sanofi-aventis U.S. LLC, A SANOFI COMPANY Data source: IMS...

Date post: 27-Dec-2015
Category:
Upload: chastity-elliott
View: 214 times
Download: 1 times
Share this document with a friend
Popular Tags:
37
1 Managed Care Digest Series ® , © 2013 sanofi-aventis U.S. LLC, A SANOFI COMPANY Data source: IMS Health © 2013 Featuring Demographic, Charge, Pharmacotherapy and Hospital Utilization Data for Diabetes Patients South Carolina Market Brief Diabetes
Transcript

1 Managed Care Digest Series®, © 2013 sanofi-aventis U.S. LLC, A SANOFI COMPANY Data source: IMS Health © 2013

Featuring Demographic, Charge, Pharmacotherapy and Hospital Utilization Data for Diabetes Patients

South Carolina Market BriefDiabetes

2 Managed Care Digest Series®, © 2013 sanofi-aventis U.S. LLC, A SANOFI COMPANY Data source: IMS Health © 2013

Sample Managed Care Digest Series® Data Sets

Patient Claims Data (Diabetes, AFib/AFlutter, Oncology):National, Regional, State, MSA Data– 2012 Data

Hospital Profile and Discharge Data (59 Disease States): National, Regional, State, MSA, System and Individual Hospital Data– 2011 Data

Health Plan Data (HMOs):National, Regional, State and MSA Data– 2012 Data

Retail Pharmacy Data (60+ Drug Classes/Subclasses):National, Regional and State Data– Midyear 2012 Data (updated to midyear 2013 in September)

3 Managed Care Digest Series®, © 2013 sanofi-aventis U.S. LLC, A SANOFI COMPANY Data source: IMS Health © 2013

Tracking Patients Across the Continuum of Care

4 Managed Care Digest Series®, © 2013 sanofi-aventis U.S. LLC, A SANOFI COMPANY Data source: IMS Health © 2013

Diabetes patient claims data are generated by IMS Health for the Managed Care Digest Series® using health care professional and institutional insurance claims. In 2012, data represented more than 7.1 million unique patients nationally with a diagnosis of Type 2 diabetes. Data from physicians of all specialties and from all hospital types are included.

IMS Health also gathers data on prescription activity from the National Council for Prescription Drug Programs (NCPDP). These data account for some 2 billion prescription claims annually, or more than 50% of the prescription universe. These prescription data represent the sampling of prescription activity from a variety of sources, including retail chains, mass merchandisers and pharmacy benefit managers. Cash, mail order, Medicaid and third-party transactions are tracked.

Diabetes Patient Claims Data

5 Managed Care Digest Series®, © 2013 sanofi-aventis U.S. LLC, A SANOFI COMPANY Data source: IMS Health © 2013

Percentage of Type 1 and Type 2 Diabetes Patients, by Payer, 2012

Medicare Medicaid Commercial Insurance1

Market Type 1 Type 2 Type 1 Type 2 Type 1 Type 2

Charleston 29.6% 44.5% 11.8% 7.8% 58.6% 45.3%

Columbia 21.9% 43.4% 16.5% 6.8% 58.5% 48.4%

Florence 29.7% 49.2% 19.0% 13.9% 51.3% 35.9%

Greenville 22.5% 46.7% 15.8% 8.0% 61.7% 44.3%

Myrtle Beach — 52.6% — 8.3% — 37.5%

Sumter — 49.2% — 10.7% — 36.9%

South Carolina 27.5% 47.3% 14.9% 9.0% 55.8% 42.3%

NATION 19.0% 39.1% 10.9% 9.8% 69.2% 50.5%

1 Includes HMOs, PPOs, point-of-service plans and exclusive provider organizations.NOTE: Throughout this presentation, the Charleston market includes North Charleston, and the Greenville market includes Spartanburg and

Anderson. Some demographic data for Type 1 diabetes patients were unavailable for Myrtle Beach and Sumter.

6 Managed Care Digest Series®, © 2013 sanofi-aventis U.S. LLC, A SANOFI COMPANY Data source: IMS Health © 2013

Percentage of Type 1 Diabetes Patients, by A1c Level Range1

≤7.0% 7.1–7.9% 8.0–9.0% >9.0%

Market 2010 2011 2012 2010 2011 2012 2010 2011 2012 2010 2011 2012

South Carolina 30.0% 29.0% 32.9% 24.6% 24.7% 21.7% 16.7% 18.4% 18.8% 28.8% 27.8% 26.7%

NATION 28.2% 27.7% 28.1% 26.5% 26.1% 25.5% 22.4% 22.0% 22.0% 22.9% 24.2% 24.4%

1 The A1c test measures how much glucose has been in the blood during the past 2–3 months.Note: A1c level data data were unavailable for Type 1 diabetes patients in Charleston, Columbia, Florence, Greenville, Myrtle Beach and Sumter. Some A1c level data were unavailable for Greenville.

7 Managed Care Digest Series®, © 2013 sanofi-aventis U.S. LLC, A SANOFI COMPANY Data source: IMS Health © 2013

≤7.0% 7.1–7.9% 8.0–9.0% >9.0%

Market 2010 2011 2012 2010 2011 2012 2010 2011 2012 2010 2011 2012

Charleston 46.5% 48.0% 44.8% 22.5% 20.5% 21.8% 13.7% 13.0% 13.6% 17.3% 18.6% 19.9%

Columbia 47.2% 49.2% 45.8% 20.9% 19.9% 21.0% 14.5% 12.6% 13.4% 17.4% 18.3% 19.9%

Florence 48.5% 47.3% 45.9% 21.9% 19.5% 18.9% 13.3% 13.3% 13.9% 16.3% 19.8% 21.3%

Greenville 50.2% 54.1% 51.3% 22.1% 19.5% 19.2% 13.2% 12.3% 13.6% 14.5% 14.1% 15.9%

Myrtle Beach 50.3% 51.5% 48.8% 23.3% 21.9% 21.3% 13.8% 12.0% 14.2% 12.6% 14.6% 15.7%

Sumter 50.2% 50.7% 47.2% 23.6% 19.7% 19.4% 12.4% 13.4% 12.6% 13.8% 16.1% 20.9%

South Carolina 48.5% 50.7% 47.4% 22.0% 20.1% 20.4% 13.7% 12.4% 13.7% 15.8% 16.8% 18.6%

NATION 50.2% 51.1% 50.6% 22.0% 20.7% 20.6% 13.3% 12.6% 12.9% 14.6% 15.6% 15.9%

Percentage of Type 2 Diabetes Patients, by A1c Level Range1

1 The A1c test measures how much glucose has been in the blood during the past 2–3 months.

8 Managed Care Digest Series®, © 2013 sanofi-aventis U.S. LLC, A SANOFI COMPANY Data source: IMS Health © 2013

Percentage of Type 1 Diabetes Patients, by Actual Complication, 20121

MarketCardiovascular

DiseaseHypoglycemia Nephropathy Neuropathy Retinopathy

Charleston 45.3% 9.4% 25.5% 28.3% 41.5%

Columbia 58.7% — 22.8% 30.4% 35.9%

Florence 44.1% — 49.2% 20.3% 22.0%

Greenville 36.0% 13.7% 26.6% 38.1% 27.3%

South Carolina 46.0% 13.5% 31.3% 32.6% 28.1%

NATION 35.9% 16.5% 27.3% 28.7% 32.8%

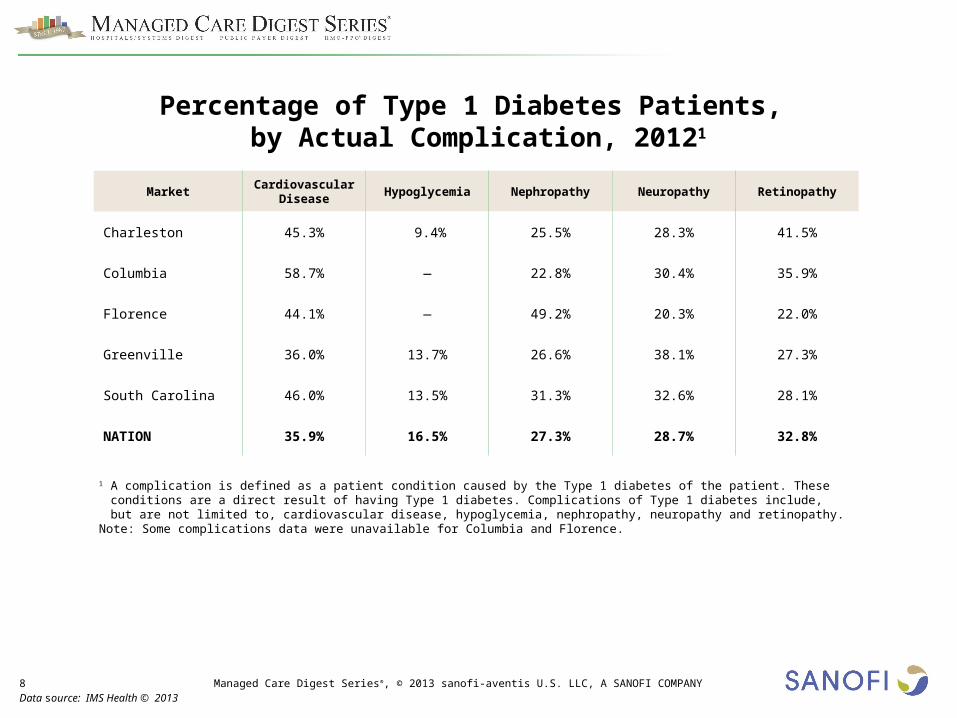
1 A complication is defined as a patient condition caused by the Type 1 diabetes of the patient. These conditions are a direct result of having Type 1 diabetes. Complications of Type 1 diabetes include, but are not limited to, cardiovascular disease, hypoglycemia, nephropathy, neuropathy and retinopathy.

Note: Some complications data were unavailable for Columbia and Florence.

9 Managed Care Digest Series®, © 2013 sanofi-aventis U.S. LLC, A SANOFI COMPANY Data source: IMS Health © 2013

Percentage of Type 2 Patients, by Actual Complication, 20121

MarketCardiovascular

DiseaseHypoglycemia Nephropathy Neuropathy Retinopathy

Charleston 52.6% 9.0% 27.7% 32.5% 29.7%

Columbia 63.9% 4.8% 21.2% 30.0% 19.8%

Florence 67.9% 6.3% 33.8% 30.5% 11.3%

Greenville 61.4% 7.7% 29.7% 35.5% 12.5%

Myrtle Beach 66.6% 8.9% 23.2% 37.3% 15.9%

Sumter 57.8% 9.5% 36.6% 42.2% 20.5%

South Carolina 61.7% 7.4% 28.0% 33.6% 16.3%

NATION 58.1% 7.3% 29.6% 31.3% 18.5%

1 A complication is defined as a patient condition caused by the Type 2 diabetes of the patient. These conditions are a direct result of having Type 2 diabetes. Complications of Type 2 diabetes include, but are not limited to, cardiovascular disease, hypoglycemia, nephropathy, neuropathy and retinopathy.

10 Managed Care Digest Series®, © 2013 sanofi-aventis U.S. LLC, A SANOFI COMPANY Data source: IMS Health © 2013

Percentage of Type 2 Diabetes Patients, Using Various Insulin Therapies

Long-Acting Insulin

Rapid-Acting Insulin

Short-ActingInsulin

Market 2010 2011 2012 2010 2011 2012 2010 2011 2012

Charleston 21.3% 21.8% 22.0% 13.9% 14.4% 14.0% 15.6% 15.8% 15.0%

Columbia 20.1% 21.6% 23.1% 14.2% 14.9% 16.5% 15.3% 16.1% 17.3%

Florence 26.0% 27.8% 27.2% 17.6% 18.4% 18.2% 18.6% 19.1% 18.7%

Greenville 21.6% 22.3% 23.0% 13.4% 13.7% 13.7% 14.8% 14.9% 14.6%

Myrtle Beach 20.9% 21.9% 22.8% 12.8% 13.2% 14.0% 14.5% 14.7% 15.4%

Sumter 25.3% 24.7% 24.6% 18.8% 19.4% 19.2% 19.7% 20.3% 19.7%

South Carolina 21.6% 22.5% 23.2% 14.1% 14.5% 14.8% 15.5% 15.7% 15.8%

NATION 23.0% 23.6% 24.9% 14.9% 15.3% 16.0% 17.0% 17.1% 17.6%

11 Managed Care Digest Series®, © 2013 sanofi-aventis U.S. LLC, A SANOFI COMPANY Data source: IMS Health © 2013

Percentage of Type 2 Diabetes Patients,Using Various Therapies

Intermediate-Acting Insulin

Mixed Insulin

2+ Non-Insulin Products

Market 2010 2011 2012 2010 2011 2012 2010 2011 2012

Charleston 2.7% 2.5% 2.1% 7.9% 7.1% 6.5% 24.8% 25.1% 22.6%

Columbia 2.1% 2.1% 1.6% 8.1% 7.5% 6.9% 26.3% 26.4% 23.9%

Florence 2.2% 1.8% 1.5% 9.9% 9.3% 9.2% 23.5% 23.0% 22.5%

Greenville 2.8% 2.3% 1.8% 7.5% 6.5% 5.8% 26.5% 26.4% 24.1%

Myrtle Beach 2.5% 2.1% 2.2% 6.4% 6.0% 6.0% 7.5% 7.4% 6.2%

Sumter 2.3% 1.9% 1.6% 8.3% 6.9% 6.9% 7.1% 7.8% 6.2%

South Carolina 2.5% 2.2% 1.8% 7.7% 6.9% 6.4% 26.3% 26.3% 24.1%

NATION 2.7% 2.3% 2.0% 6.7% 6.0% 5.7% 29.3% 28.4% 26.7%

12 Managed Care Digest Series®, © 2013 sanofi-aventis U.S. LLC, A SANOFI COMPANY Data source: IMS Health © 2013

Any Insulin Products

Long-Acting Insulin

Rapid-Acting Insulin

Vials Pens Vials Pens

Market % $ % $ % $ % $ % $

Charleston 32.3% $1,895 8.4% $1,046 15.2% $1,274 6.9% $1,460 8.4% $1,156

Columbia 33.0% $2,157 8.2% $1,220 16.6% $1,366 7.0% $1,476 10.7% $1,188

Florence 38.2% $2,251 11.3% $1,231 18.1% $1,445 7.7% $1,210 12.1% $1,476

Greenville 31.9% $2,100 10.0% $1,340 14.5% $1,414 6.7% $1,548 8.0% $1,301

Myrtle Beach 32.6% $2,060 9.1% $1,375 15.1% $1,454 6.8% $1,264 8.0% $1,287

Sumter 34.5% $2,093 8.9% $1,093 17.1% $1,233 7.5% $1,540 13.0% $1,190

South Carolina 32.8% $2,079 9.4% $1,252 15.3% $1,373 7.0% $1,455 9.0% $1,261

NATION 33.9% $2,079 11.3% $1,256 15.3% $1,334 8.0% $1,413 9.2% $1,303

Percentage of and Average Annual Payments1 for Type 2 Diabetes Patients Using Various Insulin Therapies, 2012

1 Figures reflect the per-patient yearly payments for Type 2 diabetes patients receiving a particular type of therapy. These are the actual amounts paid by the insurer and patient for such prescriptions. Costs mainly include copayments, but can also include tax, deductibles and cost differentials where applicable.

13 Managed Care Digest Series®, © 2013 sanofi-aventis U.S. LLC, A SANOFI COMPANY Data source: IMS Health © 2013

Percentage of and Average Annual Payments1 for Type 2 Diabetes Patients Using Various Insulin Therapies, 2012

Short-Acting Insulin

MixedInsulin

Intermediate-ActingInsulin

Vials Pens Vials Pens Vials Pens

Market % $ % $ % $ % $ % $ % $

Charleston 8.1% $1,417 8.4% $1,156 3.8% $1,246 3.1% $1,896 1.7% $607 0.4% $936

Columbia 7.8% $1,433 10.7% $1,188 3.8% $1,406 3.7% $2,110 1.4% $721 0.3% $1,366

Florence 8.6% $1,230 12.1% $1,476 5.7% $1,275 4.2% $2,253 1.5% $684 — —

Greenville 7.8% $1,455 8.0% $1,301 3.6% $1,368 2.5% $1,879 1.6% $972 0.3% $1,021

Myrtle Beach 8.4% $1,165 8.0% $1,287 3.7% $1,354 2.5% $2,191 1.9% $863 0.3% $1,351

Sumter 8.1% $1,558 13.0% $1,190 4.5% $1,333 3.1% $1,982 1.5% $834 — —

South Carolina 8.1% $1,394 9.0% $1,261 3.9% $1,344 2.9% $1,995 1.6% $816 0.3% $1,027

NATION 9.8% $1,333 9.2% $1,303 3.5% $1,345 2.6% $1,956 1.8% $782 0.3% $1,164

1 Figures reflect the per-patient yearly payments for Type 2 diabetes patients receiving a particular type of therapy. These are the actual amounts paid by the insurer and patient for such prescriptions. Costs mainly include copayments, but can also include tax, deductibles and cost differentials where applicable.

Note: Some pharmacotherapy data were unavailable for the selected markets.

14 Managed Care Digest Series®, © 2013 sanofi-aventis U.S. LLC, A SANOFI COMPANY Data source: IMS Health © 2013

Any Non-Insulin Antidiabetic

Product

Insulin Sensitizing Agents (TZDs)

GLP-1 Receptor Agonists

DPP-4Inhibitors

Market % $ % $ % $ % $

Charleston 85.0% $760 5.6% $1,530 7.0% $1,981 11.5% $1,418

Columbia 82.8% $747 6.4% $1,535 5.9% $1,891 12.0% $1,452

Florence 81.6% $735 9.0% $1,511 4.3% $1,906 11.9% $1,540

Greenville 85.7% $631 7.0% $1,656 3.6% $1,893 10.3% $1,495

Myrtle Beach 84.6% $752 8.1% $1,646 5.6% $2,130 11.3% $1,465

Sumter 83.5% $882 5.0% $1,470 7.5% $2,012 15.0% $1,604

South Carolina 84.6% $704 6.8% $1,604 5.0% $1,936 11.4% $1,473

NATION 84.6% $745 7.1% $1,650 4.9% $1,964 12.8% $1,525

Percentage of and Average Annual Payments1 for Type 2 Diabetes Patients Using Various Non-Insulin Antidiabetic Therapies, 2012

1 Figures reflect the per-patient yearly payments for Type 2 diabetes patients receiving a particular type of therapy. These are the actual amounts paid by the insurer and patient for such prescriptions. Costs mainly include copayments, but can also include tax, deductibles and cost differentials where applicable.

15 Managed Care Digest Series®, © 2013 sanofi-aventis U.S. LLC, A SANOFI COMPANY Data source: IMS Health © 2013

1 Figures reflect the per-patient yearly payments for Type 2 diabetes patients receiving a particular type of therapy. These are the actual amounts paid by the insurer and patient for such prescriptions. Costs mainly include copayments, but can also include tax, deductibles and cost differentials where applicable.

Average Annual Payments per Type 2 Diabetes Patient,by Type of Therapy, 20121

16 Managed Care Digest Series®, © 2013 sanofi-aventis U.S. LLC, A SANOFI COMPANY Data source: IMS Health © 2013

Endocrinology Primary Care1 Internal Medicine

MarketLong-Acting Insulin

Rapid-Acting Insulin

Short-Acting Insulin

Inter-mediate-Acting Insulin

Long-Acting Insulin

Rapid-Acting Insulin

Short-Acting Insulin

Inter-mediate-Acting Insulin

Long-Acting Insulin

Rapid-Acting Insulin

Short-Acting Insulin

Inter-mediate-Acting Insulin

Charleston 34.2% 41.4% 43.3% 8.0% 17.9% 8.1% 8.8% 5.8% 20.9% 12.0% 12.8% 6.1%

Columbia 43.7% 50.0% 51.2% 4.4% 19.3% 11.6% 12.3% 7.7% 21.9% 13.1% 14.0% 6.1%

Florence 35.9% 49.2% 50.8% 11.6% 23.5% 12.8% 13.3% 8.9% 29.0% 18.7% 19.8% 6.1%

Greenville 44.8% 50.4% 53.0% 4.3% 20.3% 10.0% 10.7% 4.8% 21.9% 11.9% 12.8% 6.9%

Myrtle Beach 29.1% 32.1% 32.9% 4.0% 18.8% 9.4% 10.6% 6.3% 21.7% 11.4% 10.6% 5.9%

Sumter 42.9% 47.2% 47.2% — 19.3% 13.4% 13.9% 5.0% 20.0% 8.8% 15.1% 8.8%

South Carolina 38.7% 43.8% 45.7% 5.4% 19.5% 10.1% 10.9% 6.0% 22.2% 12.7% 13.6% 6.6%

NATION 37.0% 36.0% 38.1% 7.1% 21.0% 10.7% 12.0% 4.8% 22.0% 12.4% 13.9% 5.5%

Percentage of Type 2 Diabetes Patients Using Various Insulin Therapies, by Prescribing Specialist, 2012

1 “Primary care” consists of both general and family practitioners.

17 Managed Care Digest Series®, © 2013 sanofi-aventis U.S. LLC, A SANOFI COMPANY Data source: IMS Health © 2013

Persistency: Various Insulin Products, South Carolina, 2012

18 Managed Care Digest Series®, © 2013 sanofi-aventis U.S. LLC, A SANOFI COMPANY Data source: IMS Health © 2013

Persistency: Various Non-Insulin Antidiabetic Products, South Carolina, 2012

19 Managed Care Digest Series®, © 2013 sanofi-aventis U.S. LLC, A SANOFI COMPANY Data source: IMS Health © 2013

Persistency: Various Insulin Therapies, Charleston, 2012

20 Managed Care Digest Series®, © 2013 sanofi-aventis U.S. LLC, A SANOFI COMPANY Data source: IMS Health © 2013

Persistency: Various Non-Insulin Antidiabetic Therapies, Charleston, 2012

21 Managed Care Digest Series®, © 2013 sanofi-aventis U.S. LLC, A SANOFI COMPANY Data source: IMS Health © 2013

Persistency: Various Insulin Therapies, Greenville, 2012

22 Managed Care Digest Series®, © 2013 sanofi-aventis U.S. LLC, A SANOFI COMPANY Data source: IMS Health © 2013

Persistency: Various Non-Insulin Antidiabetic Therapies, Greenville, 2012

23 Managed Care Digest Series®, © 2013 sanofi-aventis U.S. LLC, A SANOFI COMPANY Data source: IMS Health © 2013

Readmission Rates for Patients Diagnosed with Type 2 Diabetes, by Type of Therapy, 2010–20121

24 Managed Care Digest Series®, © 2013 sanofi-aventis U.S. LLC, A SANOFI COMPANY Data source: IMS Health © 2013

Professional Charges per Year for Type 2 Diabetes Patients, 20121

MarketAmbulatory

SurgeryEmergency

RoomHospital Inpatient

Hospital Outpatient

Office/Clinic

Charleston $3,321 $730 $3,747 $1,269 $2,154

Columbia $2,539 $1,228 $3,088 $1,312 $2,039

Florence $2,421 $722 $4,080 $1,240 $2,010

Greenville $2,208 $652 $2,664 $973 $2,172

Myrtle Beach $3,544 $557 $2,629 $1,093 $2,019

Sumter $3,462 $884 $3,152 $1,995 $3,898

South Carolina $2,713 $749 $2,987 $1,182 $2,068

NATION $2,475 $946 $2,769 $1,096 $1,846

1 Professional charges are those generated by the providers delivering care to Type 2 diabetes patients in various settings.

25 Managed Care Digest Series®, © 2013 sanofi-aventis U.S. LLC, A SANOFI COMPANY Data source: IMS Health © 2013

Inpatient Outpatient

Market

Charleston $17,019 $3,777

South Carolina $19,518 $3,366

NATION $33,161 $6,750

Facility Charges per Year for Type 1 Diabetes Patients, 20121

1 Figures reflect the charges generated for Type 2 diabetes patients by the facilities that delivered care. Facility charge data include charges for all services rendered, including prevention and charges associated with the treatment of other diseases. The data also reflect the average amountscharged in Type 2 diabetes patient claims, not the amount the claims paid.

Note: Facility charges data were unavailable for Type 1 diabetes patients in Columbia, Florence, Greenville, Myrtle Beach and Sumter.

26 Managed Care Digest Series®, © 2013 sanofi-aventis U.S. LLC, A SANOFI COMPANY Data source: IMS Health © 2013

Inpatient Outpatient

Market 2011 2012 2011 2012

Charleston $40,935 $46,177 $8,560 $8,199

Columbia $43,724 $48,111 $8,499 $7,932

Florence $47,617 $49,623 $8,121 $11,791

Greenville $43,347 $48,325 $11,417 $9,514

Myrtle Beach $40,591 $40,881 $7,995 $8,077

Sumter $40,887 $36,450 $7,632 $9,106

South Carolina $40,178 $44,463 $8,218 $8,109

NATION $49,150 $52,156 $10,061 $10,647

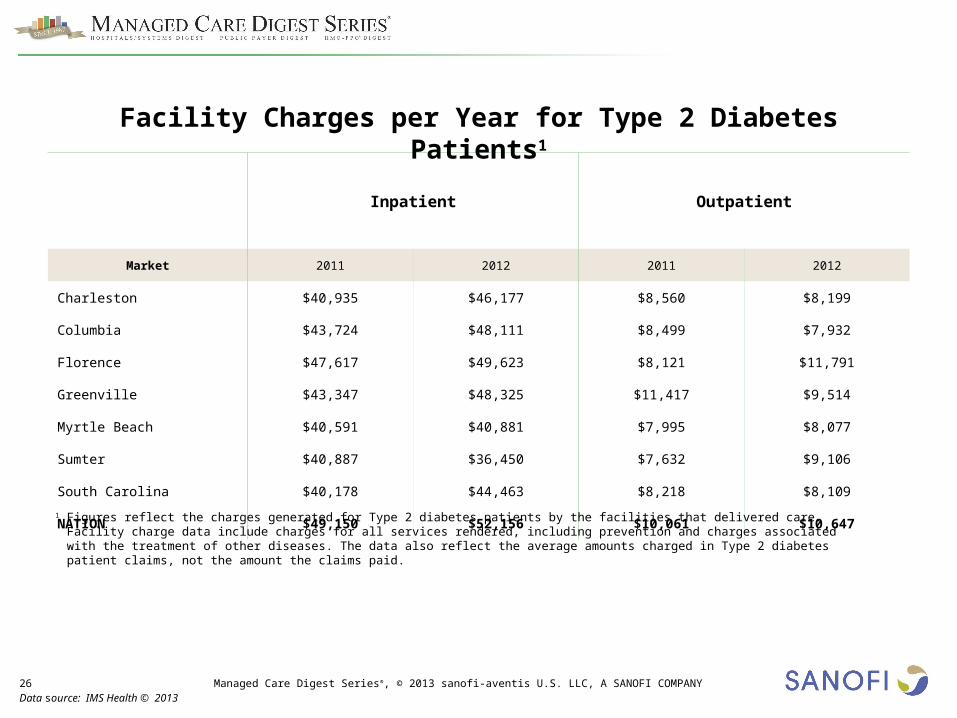
Facility Charges per Year for Type 2 Diabetes Patients1

1 Figures reflect the charges generated for Type 2 diabetes patients by the facilities that delivered care. Facility charge data include charges for all services rendered, including prevention and charges associated with the treatment of other diseases. The data also reflect the average amounts charged in Type 2 diabetes patient claims, not the amount the claims paid.

27 Managed Care Digest Series®, © 2013 sanofi-aventis U.S. LLC, A SANOFI COMPANY Data source: IMS Health © 2013

Hospital Discharges

28 Managed Care Digest Series®, © 2013 sanofi-aventis U.S. LLC, A SANOFI COMPANY Data source: IMS Health © 2013

Inpatient Outpatient

Market Average Total Average Total

Charleston 1,717.1 15,454 7,466.9 59,735

Columbia 2,881.8 14,409 11,681.2 58,406

Florence 2,798.0 8,394 7,729.7 23,189

Greenville 1,559.4 21,831 8,244.2 98,930

Myrtle Beach 1,257.8 5,031 7,763.7 23,291

South Carolina 1,425.6 95,518 6,064.2 382,043

NATION 1,282.8 6,382,133 5,251.4 25,574,123

Total and Average Number of Inpatient and Outpatient Diabetes Mellitus Cases per Hospital, 2011

Note: For slides 25–29, diabetes mellitus hospital discharge data were unavailable for Sumter.

29 Managed Care Digest Series®, © 2013 sanofi-aventis U.S. LLC, A SANOFI COMPANY Data source: IMS Health © 2013

Market Medicare Medicaid Commercial Insurance1

Charleston 59.3% 9.6% 18.1%

Columbia 54.4% 12.7% 22.6%

Florence 70.0% 9.2% 15.3%

Greenville 66.7% 9.6% 16.8%

Myrtle Beach 64.3% 9.9% 16.6%

South Carolina 63.8% 10.3% 17.8%

NATION 60.1% 11.9% 19.8%

Percentage of Inpatient Diabetes Mellitus Cases, by Payer, 2011

1 Includes HMOs, PPOs, point-of-service plans and exclusive provider organizations.

30 Managed Care Digest Series®, © 2013 sanofi-aventis U.S. LLC, A SANOFI COMPANY Data source: IMS Health © 2013

Market Primary Secondary

Charleston 8.0% 92.0%

Columbia 8.4% 91.6%

Florence 9.3% 90.7%

Greenville 8.2% 91.8%

Myrtle Beach 7.6% 92.4%

South Carolina 8.7% 91.3%

NATION 8.5% 91.6%

Percentage of Inpatient Diabetes Mellitus Cases, by Primary vs. Secondary Diagnosis, 2011

31 Managed Care Digest Series®, © 2013 sanofi-aventis U.S. LLC, A SANOFI COMPANY Data source: IMS Health © 2013

MarketHome/

RoutineShort Term

Hospital

Skilled Nursing Facility

Intermediate Care Facility

Other Facility1

Home Health

Against Advice

Died Other2

Charleston 71.1% 0.7% 8.5% 0.6% 0.4% 14.0% 0.2% 1.0% 3.5%

Columbia 69.2% 0.8% 10.7% 0.7% 0.4% 14.2% 0.3% 1.1% 2.7%

Florence 73.4% 1.1% 7.1% 0.7% 0.4% 11.2% 0.5% 1.3% 4.4%

Greenville 68.6% 0.9% 10.8% 1.2% 0.6% 13.9% 0.3% 1.0% 2.6%

Myrtle Beach 68.5% 1.4% 9.9% 0.8% 0.2% 14.9% 0.6% 1.6% 2.1%

South Carolina 68.3% 1.5% 10.4% 0.8% 0.4% 14.1% 0.3% 1.2% 2.9%

NATION 63.3% 2.0% 12.9% 1.0% 1.2% 15.0% 0.9% 1.2% 2.5%

Percentage of Inpatient Diabetes Mellitus Cases, by Discharge Destination, 2011

1 “Other Facility” represents patients discharged or transferred to federal health care facilities, Medicare-certified long-term hospitals or critical-access hospitals.2 “Other” represents mental health/rehabilitation, shelters, hospice (home) and hospice (medical facility).

32 Managed Care Digest Series®, © 2013 sanofi-aventis U.S. LLC, A SANOFI COMPANY Data source: IMS Health © 2013

ALOS Average Charges1

Market 2010 2011 2010 2011

Charleston 5.1 4.7 $44,250 $42,209

Columbia 6.4 6.8 $44,338 $43,340

Florence 5.0 5.5 $40,005 $53,399

Greenville — 4.8 $36,810 $36,537

Myrtle Beach 5.2 4.4 $30,416 $27,724

South Carolina 5.3 4.6 $34,089 $35,614

NATION 4.3 4.3 $34,505 $36,624

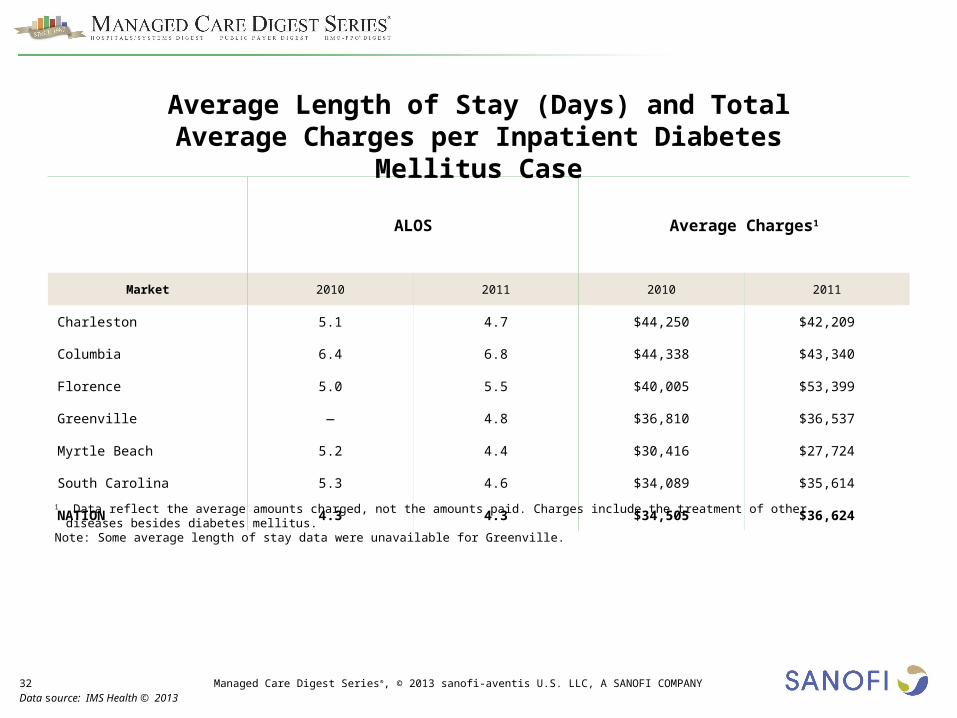
Average Length of Stay (Days) and Total Average Charges per Inpatient Diabetes Mellitus Case

1 Data reflect the average amounts charged, not the amounts paid. Charges include the treatment of other diseases besides diabetes mellitus.Note: Some average length of stay data were unavailable for Greenville.

33 Managed Care Digest Series®, © 2013 sanofi-aventis U.S. LLC, A SANOFI COMPANY Data source: IMS Health © 2013

Most Common Concomitant Diagnoses for Patients With a Primary Diagnosis of Diabetes Mellitus, 2011

South Carolina Hospitals

ICD-9 CODE Description Overall

401.9 Unspecified Essential Hypertension 21.1%

272.4 Other and Unspecified Hyperlipidemia 12.4%

584.9 Unspecified Acute Renal Failure 11.0%

276.51 Dehydration 8.3%

707.15 Ulcer of Other Part of Foot 7.7%

305.1 Nondependent Tobacco Use Disorder 6.9%

357.2 Polyneuropathy in Diabetes 6.7%

403.90Hypertensive Chronic Kidney Disease, Unspecified, with Chronic Kidney Disease, Stage I through Stage IV, or Unspecified 6.5%

NOTE: Most common concomitant diagnoses data are available down to the state level only.

34 Managed Care Digest Series®, © 2013 sanofi-aventis U.S. LLC, A SANOFI COMPANY Data source: IMS Health © 2013

Most Common Procedures for PatientsWith a Primary Diagnosis of Diabetes Mellitus, 2011

NOTE: Most common procedures data are available down to the state level only

South Carolina Hospitals

ICD-9 CODE Description Overall

39.95 Hemodialysis 7.5%

38.93 Venous Catheterization, Not Elsewhere Classified 7.0%

99.04 Transfusion of Packed Cells 6.5%

86.22 Excisional Debridement of Wound, Infection or Burn 3.0%

38.97 Central Venous Catheter Placement with Guidance 2.1%

88.48 Ateriography of Femoral and Other Lower Extremity Artery 1.7%

35 Managed Care Digest Series®, © 2013 sanofi-aventis U.S. LLC, A SANOFI COMPANY Data source: IMS Health © 2013

36 Managed Care Digest Series®, © 2013 sanofi-aventis U.S., A SANOFI COMPANY Data source: IMS Health © 2013

Claims Data (slides 5–26)

•Data for this presentation were generated by IMS Health for the Managed Care Digest Series® using health care professional and institutional insurance claims. Data for this presentation represent more than 7.2 million unique patients nationally in 2012 with a diagnosis of Type 1 or Type 2 diabetes. Data from physicians of all specialties and from all hospital types are included.

•IMS Health also gathers data on prescription activity from the National Council for Prescription Drug Programs (NCPDP). These data account for some 2 billion prescription claims annually, or more than 50% of the prescription universe. These prescription data represent the sampling of prescription activity from a variety of sources, including retail chains, mass merchandisers and pharmacy benefit managers. Cash, mail order, Medicaid and third-party transactions are tracked.

Hospital Procedure/Diagnosis (HPD) Discharge Data (slides 28–34):

•Demographic, utilization and charge data are derived from IMS Health’s HPD database. This database contains an extensive set of hospital inpatient discharge records, including actual diagnosis and procedure data for about 75% of all discharges nationwide (including 100% of Medicare-reimbursed discharges).

•IMS Health uses Medicare procedure counts and additional hospital-level information to estimate procedure counts for the remaining 25% of discharges—the non-Medicare hospital discharge information in non-reporting states.

•The HPD inpatient database also reports the numbers of procedures performed on patients discharged from a hospital.

•The hospital inpatient data provided are current as of calendar year 2011.

Methodology

37 Managed Care Digest Series®, © 2013 sanofi-aventis U.S. LLC, A SANOFI COMPANY Data source: IMS Health © 2013

Market Type 1 Diabetes Type 2 Diabetes

Charleston, SC 248 20,911

Columbia, SC 302 24,505

Florence, SC 170 10,980

Greenville, SC 499 42,406

South Carolina 1,690 155,833

NATION 141,620 7,139,402

Claims Data Sample Sizes


Recommended