Page 1
1
MARS MARS © ©
MULTIPURPOSE MULTIPURPOSE AADVANCED DVANCED RREACTOREACTORINHERENTLY-INHERENTLY-SSAFE AFE
Maurizio Cumo, Federico Santi
International Energy Workshop 2004Paris – June 24, 2004
Potential penetration in the European Market: Potential penetration in the European Market: An analysis with MARKAL modelAn analysis with MARKAL model
Page 2
2
The Future of Nuclear Power
21th Century Challenges for Nuclear Power
Cost: Long lifetime and modular, low-cost construction
Safety: Adverse Public perception
Waste: Management of long-term nuclear waste
Proliferation: Potential Security risk
The Future of Nuclear Power – An interdisciplinary MIT study
1000 GW new capacity by 2050 to keep nuclear power at the 1000 GW new capacity by 2050 to keep nuclear power at the current share (17%) in the electricity marketcurrent share (17%) in the electricity market
Page 3
3
MARS ©
Multipurpose Advanced ReactorInherently Safe
● Combined heat and power, and drinkable water production● Low investment cost ● Short construction time● Modularity for in-shop construction and on-site assembling ● Minimum waste production ● Low radiological dose ● Easy decommissioning
A small-size, inherently-safe Pressurized Water Reactor developed from 1983 at the University of Rome in collaboration
with other Italian and international organizations
Page 4
4
MARS © Safety Features
• IN-DEPTH DEFENSE AGAINST RADIOLOGICAL HAZARD FOR PERSONNEL AND POPULATION
• CAPABILITY TO MANAGE WITH EVEN SEVERE ACCIDENTS WITH NO RISK AND IMPACT ON POPULATION AND ENVIRONMENT
• RELIANCE ON PHYSICAL LAWS FOR ACTIVE INTERVENTION (“INHERENT AND PASSIVE SAFETY”) IN FAULTED OPERATING CONDITION
• NO SENSITIVITY TO HUMAN ERRORS
• EXTREMELY LIMITED PRODUCTION OF NUCLEAR WASTE
• NEGLIGIBLE DOSE TO PERSONNEL
Page 5
5
● MULTI-PURPOSE UTILIZATION
● PLANT SIMPLICITY
● USE OF PROVEN TECHNOLOGIES
● SHORT CONSTRUCTION TIME
● EASY AND FAST PLANT TESTING
● EASY REMOVAL OF COMPONENTS
● FAST DECOMMISSIONING
● EASY OPERATION AND MAINTENANCE
● REDUCED AND CERTAIN COSTS
MARS © Design Features & Data
PRESSURIZED LWR WITH SINGLE PRIMARY LOOP
● THERMAL POWER 600 MWt
● OPERATING PRESSURE 75 bar
● COOLANT FLOW-RATE 3227
kg/s
● INLET TEMPERATURE 214 °C
● OUTLET TEMPERATURE 254 °C
● FUEL RODS ARRAY 17x17
● FUEL BUNDLES 89
● CONTROL ROD CLUSTERS 45
Page 6
6
MARS © Pressurized, Double-Containment Primary Loop
MARS © Passive, Primary Loop Emergency Cooling
Page 7
7
MARS © Passive-Safety Cooling System
SEVERE ACCIDENTS ARE PHYSICALLY IMPOSSIBLE.
NEVERTHELESS ACCIDENTAL CORE MELTING HAS BEEN CONSIDERED AND THE CORE
COOLING ASSURED.
PRESSURIZED WATER IN PRIMARY LOOP DOUBLE CONTAINMENT MAKES IT POSSIBLE IN-VESSEL COOLING,
AND MANAGEMENT OF EVEN SEVERE ACCIDENTS
SEVERE ACCIDENTS
Page 8
8
MARS © Reactor Building
Page 9
9
MARS © New Construction Approach
PRESSURIZED CONTAINMENT OF PRINCIPAL COMPONENTS
FLANGED CONNECTIONS FOR PRIMARY LOOP AND COMPONENTS TO EASY
ASSEMBLING AND MAINTENANCE
LOCAL GASKET WELDING FOR CIRCUIT LEAK TIGHT
MINIMISE ON-SITE ASSEMBLING OPERATIONS
MAXIMIZE IN-SHOP FABRICATION
EASY PLANT DECOMMISSIONING
Page 10
10
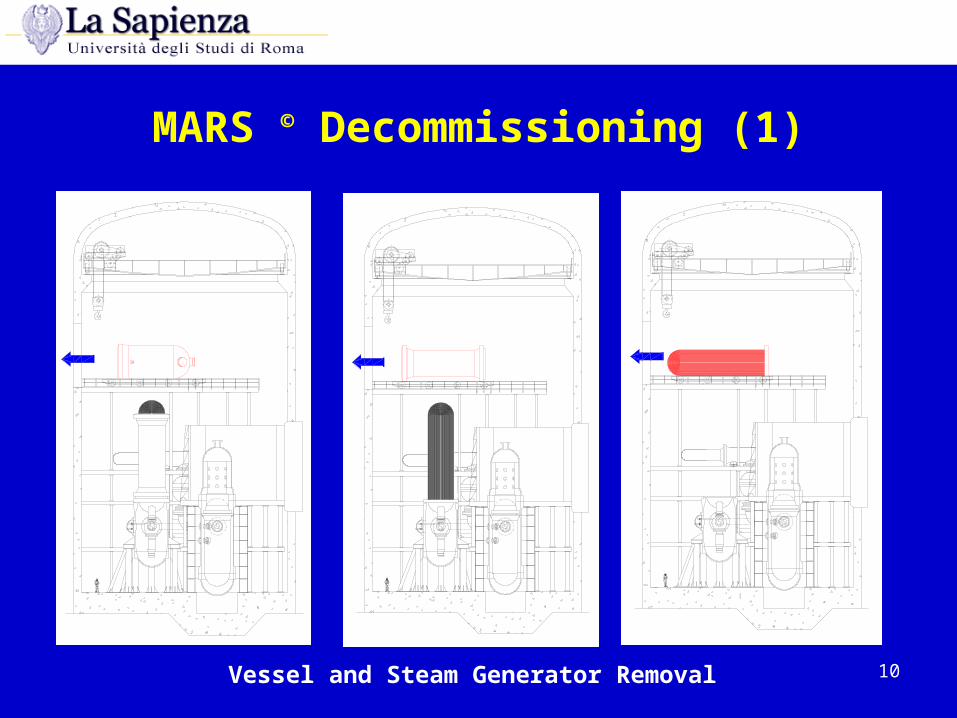
MARS © Decommissioning (1)
Vessel and Steam Generator Removal
Page 11
11
MARS © Decommissioning (2)
Removal of biological shield and internal structures of the reactor building
Page 12
12
MARS © Safety Analysis - Results
Maximum core damage probability
1.00E-14
1.00E-13
1.00E-12
1.00E-11
1.00E-10
1.00E-09
1.00E-08
1.00E-07
1 2 3 4 5 6 7 8
Accidental sequence number
Pro
bab
ilit
y (y
r-1)
5 - Loss of coolant from auxiliary systems6 - Steam generator tube rupture7 - Primary pump trip8 - Steam line break
1 - Primary pump stop2 - Relief/safety valves stuck open3 - S.G. Exchanged power degradation4 - Loss of on/off site power
Page 13
13
MARS © Waste Production (m3/y)
(1) cask filling(2) low-pressure compacting and cask filling(3) neutralization and cask filling(4) incineration and cask filling(5) high pressure compacting and cask filling(6) drying and cask filling
Page 14
14
MARS © Cost of Electricity ($/kWh)
0.020
0.025
0.030
0.035
0.040
0.045
0.050
0.055
0.060
10 20 30 40 50 60 70 80 90 100
Debt service duration (Year)
Pro
du
ctio
n c
ost
(U
S$/
kWh
)
7%
5%
Page 15
15
West EU MARKAL-ED Model
WEU MARKAL Model Geographical Coverage
AustriaBelgiumDenmarkFinlandFrance a
GermanyGibraltarGreeceGreenlandIcelandIrelandItaly b
LuxembourgMaltaNetherlandsNorwayPortugalSpainSwedenSwitzerland c
United Kingdom
a Includes Monacob Includes San Marino and Vatican Cityc Includes Liechtenstein
About 75 Mtoe/yr (TPES) more than EU-15
Total Primary Energy Supply in Western Europe - MARKAL Model (Mtoe)
0
300
600
900
1200
1500
1800
2100
2000 2005 2010 2015 2020 2025 2030
RenewablesNatural gasOilSolidsNuclear
Final Energy Consumption in Western Europe - MARKAL Model (Mtoe)
0
200
400
600
800
1000
1200
1400
2000 2005 2010 2015 2020 2025 2030
TransportationResidentialCommercialIndustrial
Energy Intensity in Western Europe (toe/2000 milions €)
0
20
40
60
80
100
120
140
160
180
200
2000 2005 2010 2015 2020 2025
PRIMES
MARKAL
Energy Intensity in the WEU:a comparison between MARKAL and PRIMES
Page 16
16
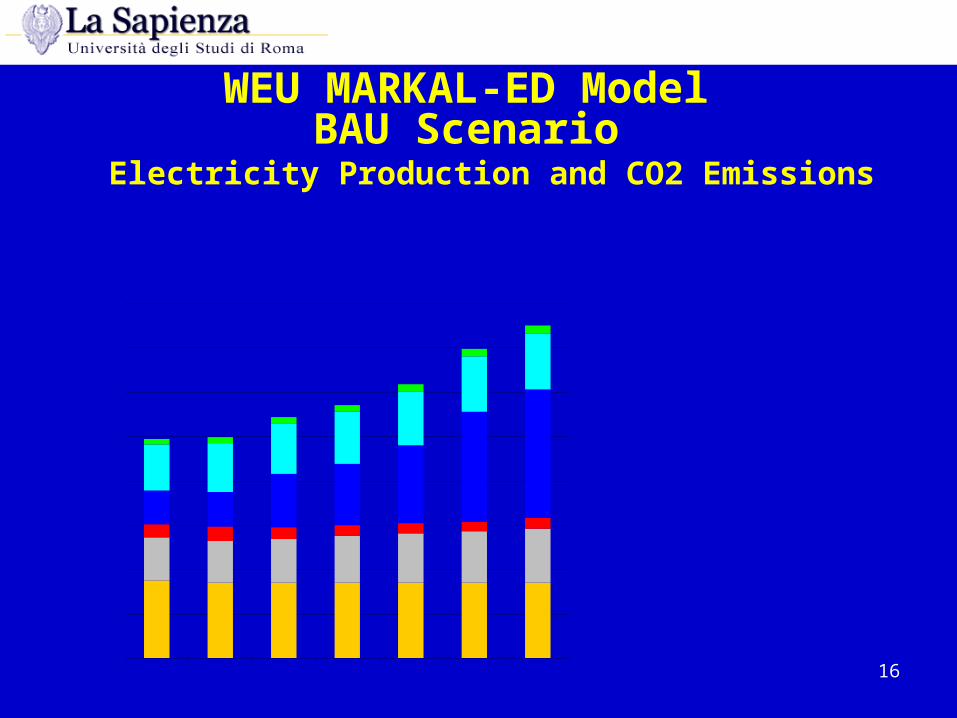
WEU MARKAL-ED Model BAU Scenario
Electricity Production and CO2 Emissions
WEU Markal Model - BASE CASEElectrcicty Production by Source (TWh)
0
500
1000
1500
2000
2500
3000
3500
4000
2000 2005 2010 2015 2020 2025 20300
200
400
600
800
1000
1200
1400
Other renewablesHydroNatural GasOilCoalNuclearCO2 Emissions (Mton)
Page 17
17
WEU MARKAL-ED Model MARS Scenario
Electricity Production and CO2 Emissions
WEU Markal Model - MARS ScenarioElectrcicty Production by Source (TWh)
0
500
1000
1500
2000
2500
3000
3500
4000
2005 2010 2015 2020 2025 20300
200
400
600
800
1000
1200
1400
Other renewablesHydroNatural GasOilCoalNew nuclear (MARS)Nuclear existingCO2 Emissions (Mton)
CO2 Emission Stabilization
Page 18
18
WEU MARKAL-ED Model CO2 Emissions and Total Energy System Cost
Electricity Sector CO2 Emission (Mt CO2/year)
0
200
400
600
800
1000
1200
1400
2000 2005 2010 2015 2020 2025 2030
Base Case
MARS Scenario
-26%
MARS Scenario Discounted Total Energy System Cost:-0,25% with respect to b.a.u. scenario
MARS Technology MARS Technology ==
CO2 Emission Reduction CO2 Emission Reduction Negative CostNegative Cost
Page 19
19
Power Sector Emission Reduction
Target
- 40% in 2030, compared to the b.a.u. Scenario;
+ 11% in 2030, compared to the year 2000 level.
STABILIZATION
WEU MARKAL-ED Model MARS vs. CO2 Emission Trading Scenario (1)
WEU Markal Model - Emission Trading ScenarioElectrcicty Production by Source (TWh)
0
500
1000
1500
2000
2500
3000
3500
4000
2005 2010 2015 2020 2025 20300
200
400
600
800
1000
1200
1400
Other renewablesHydroNatural GasOilCoalNuclearCO2 Emissions (Mton)
CO2 Emission Permits System (Black Certificates)
Top-Technologies: CCGT and renewables
Page 20
20
WEU MARKAL-ED Model MARS vs. CO2 Emission Trading Scenario (2)
The difference between the two CO2 emission reduction options
is around 60 €/t CO2, in terms of total (discounted) energy system cost (30 years)
MARS vs. Emission Trading Scenario: Average CO2 Emission Reduction Cost
(Total Energy System Cost, 30 years - €/t CO2)
-50
-40
-30
-20
-10
0
10
20
30
MARS Emission Trading
Estimated Emission Permit Price:
25 €/t CO2
To assign Emission Permits to MARS Power Plants:
an economic way to stimulate the construction
of MARS first movers
Page 21
21
WEU MARKAL-ED Model MARS + Renewables: a Low-Carbon Western European
Energy System
10% in 2010 (EU Directive target);
20% in 2030 (assumption).
WEU Markal Model - MARS ScenarioElectrcicty Production by Source (TWh)
0
500
1000
1500
2000
2500
3000
3500
4000
2005 2010 2015 2020 2025 20300
200
400
600
800
1000
1200
1400
Other renewablesHydroNatural GasOilCoalNew nuclear (MARS)Nuclear existingCO2 Emissions (Mton)
Renewable Energy Obligation (Green Certificates) Total Electricity Production from Non-Hydro Renewable
Energy Sources:
Page 22
22
WEU MARKAL-ED Model MARS + Renewables: a Low-Carbon Western European
Energy Systemonly MARS: CO2: – 26%; tot cost: – 0,25%; CO2 reduction av. cost: – 39 €/t CO2
only Green Certificates: CO2: – 30%; tot cost: + 0,84%; CO2 reduction av. cost: + 89 €/t CO2
MARS + Green Certificates: CO2: – 56%; tot cost: + 0,65%; CO2 reduction av. cost: + 39 €/t CO2
Electricity Sector CO2 Emission (Mt CO2/year)
0
200
400
600
800
1000
1200
1400
2000 2005 2010 2015 2020 2025 2030
Base Case
MARS + GreenCertificatesScenario
-56%
MARS + Green Certificates Scenario Discounted Total Energy System Cost:+0,65% with respect to b.a.u. scenario
!!!
RES policy already implemented
+ MARS option
= – 56% CO2 emission
from power sector in 2030
Page 23
23
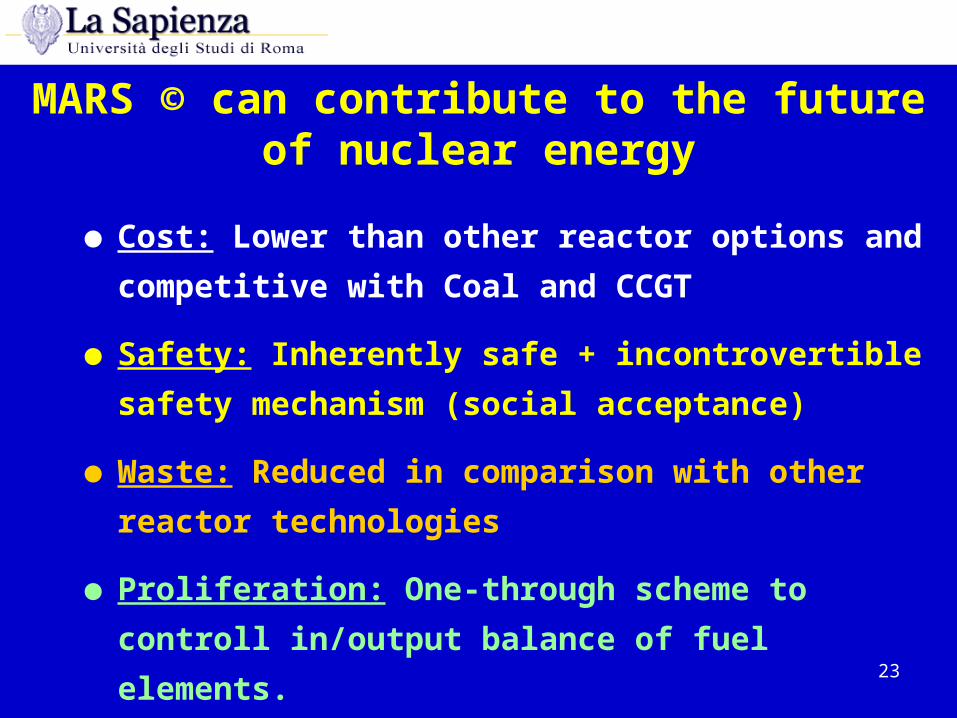
MARS © can contribute to the future of nuclear energy
● Cost: Lower than other reactor options and
competitive with Coal and CCGT
● Safety: Inherently safe + incontrovertible safety
mechanism (social acceptance)
● Waste: Reduced in comparison with other reactor
technologies
● Proliferation: One-through scheme to controll
in/output balance of fuel elements.
Page 24
24
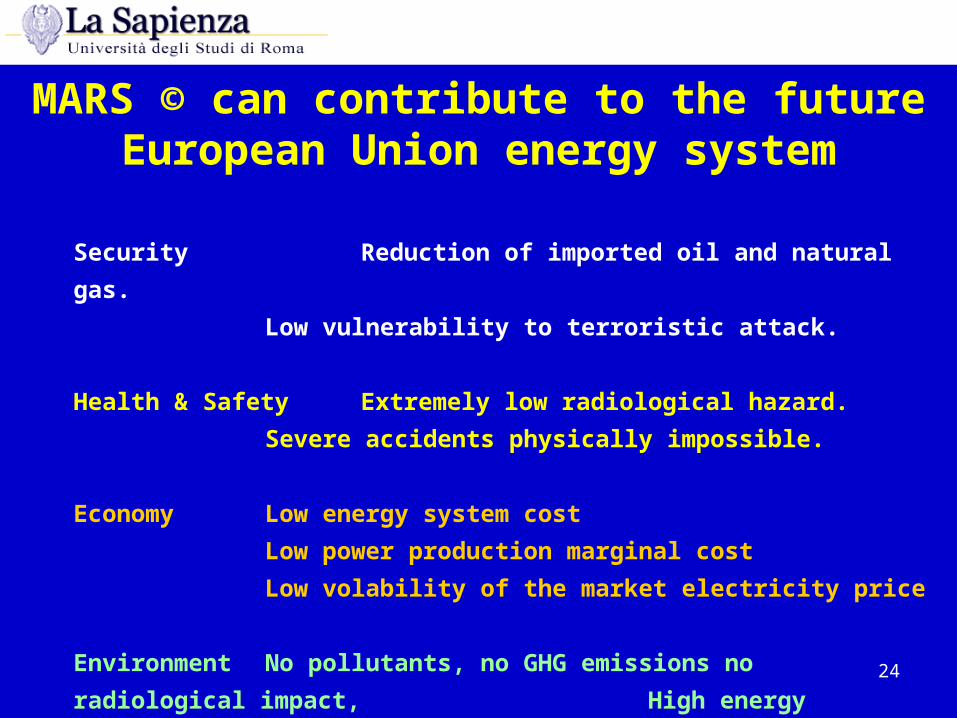
MARS © can contribute to the future European Union energy system
Security Reduction of imported oil and natural gas.
Low vulnerability to terroristic attack.
Health & Safety Extremely low radiological hazard.
Severe accidents physically impossible.
Economy Low energy system cost
Low power production marginal cost
Low volability of the market electricity price
Environment No pollutants, no GHG emissions no radiological impact,
High energy efficiency with CHP