1) Measure savings Make decisions on how to spend funds Make decisions how best to use acquired funds Acquire funds Track money spent. 2) Government entities – 5 Employees – 3 Prospective Investors – 2 Owners – 1 Banks – 4 3) 4) Owners and managers, employees/trade unions, financial institutions, prospective investors/financial analysts and government entities Activity Bookkeeping/Accounting Journalizing - Recording in books of prime entry; B Sorting and classifying source documents; B Preparing final accounts A Posting - sending from books of prime entry to ledger accounts; B Preparing trial balance – transfer balances from ledger accounts to a trial balance; B Making adjusting entries and correcting errors A Preparing adjusted trial balance A Analyzing final accounts A
Transcript
1) Measure savings
Make decisions on how to spend funds
Make decisions how best to use acquired funds
Acquire funds
Track money spent.
2) Government entities – 5
Employees – 3
Prospective Investors – 2
Owners – 1
Banks – 4
3)
4) Owners and managers, employees/trade unions, financial institutions, prospective investors/financial analysts and government entities
Activity Bookkeeping/Accounting
Journalizing - Recording in books of prime entry;
B
Sorting and classifying source documents; B
Preparing final accounts A
Posting - sending from books of prime entry to ledger accounts;
B
Preparing trial balance – transfer balances from ledger accounts to a trial balance;
B
Making adjusting entries and correcting errors
A
Preparing adjusted trial balance A
Analyzing final accounts A
5)
Prepare the Trial Balance 4
Prepare the Trading and Profit & Loss Account
5
Journalise 2
Analyse Source Documents 1
Prepare the Balance Sheet
6
Post to the Ledger 3
Multiple Choice
1. C 2. A 3. A 4. A 5. B
1) a) False b) True c) True d) False e) True
2) Recording into journals, updating stock, writing of cheques and Preparing payroll.
3) Problems caused by possible viruses or unauthorised entry into the system. Implement security systems, install software programmes in order to deter viruses or create backup systems.
4) The Income Statement (known as the Trading and Profit and Loss) used to determine the gross profit/loss and the net profit/loss over a period of time.
The Balance sheet describes a business’s financial position over a period of time.
The Cash Flow Statement identifies a firm’s cash inflows and cash outflows over a period of time.
Calculation of Cash Received from Credit Customer who pays within the discount period Total value of sale 50000 Trade discount 10% x 50000 5000 Amount due 45000 Cash discount 10% x 45000 4500 Total amount received 40500
5)
Journal Date Details Dr. Cr. 2005 $ $
1-Aug Trucks 250000 Fixtures 35000 Debtors 148000
Capital 383000 Loan from bank 50000 To record capital introduced.
4-Aug Computer 35000 Computers R Us Ltd 35000 To record the purchase of computer on credit.
Multiple Choice
1. D 2. A 3. A 4. D 5. B 6. C
1) Ledger accounts which accounts for revenues and expenses for example : wages, and advertising expenses and sales and commission received and others.
2) Real accounts consist of assets, liabilities and capital. Some examples may include premises, cash, bank overdraft, creditors or owner’s equity.
3) Real and personal accounts are carried forward to the next period.
4) (a) Transfer all expenses to the Income Statement.
(b) Transfer all revenue/income accounts to the Income Statement.
(c )Transfer the Profit or Loss from the Income Statement to the Capital account.
(d)Transfer drawings to the Capital account.
5)
General Journal
DATEDATE DETAILSDETAILS DebitDebit CreditCredit Income statementIncome statement 17 50017 500 Purchases Purchases 17 50017 500 Income StatementIncome Statement 2 0002 000 Insurance Insurance 2 000 2 000 Income StatementIncome Statement 300300 Discount al lowed Discount al lowed 300300 Discount receivedDiscount received 100100 Incom Income Statemente Statement 100100 Rent receivedRent received 1 0001 000 Income Statement Income Statement 1 0001 000 Income statementIncome statement 850850 Carriage inwards Carriage inwards 850850 Income StatementIncome Statement 450450 Carriage Carriage
outwardsoutwards 450450
Income statement Income statement 880880 Return inwards Return inwards 880880
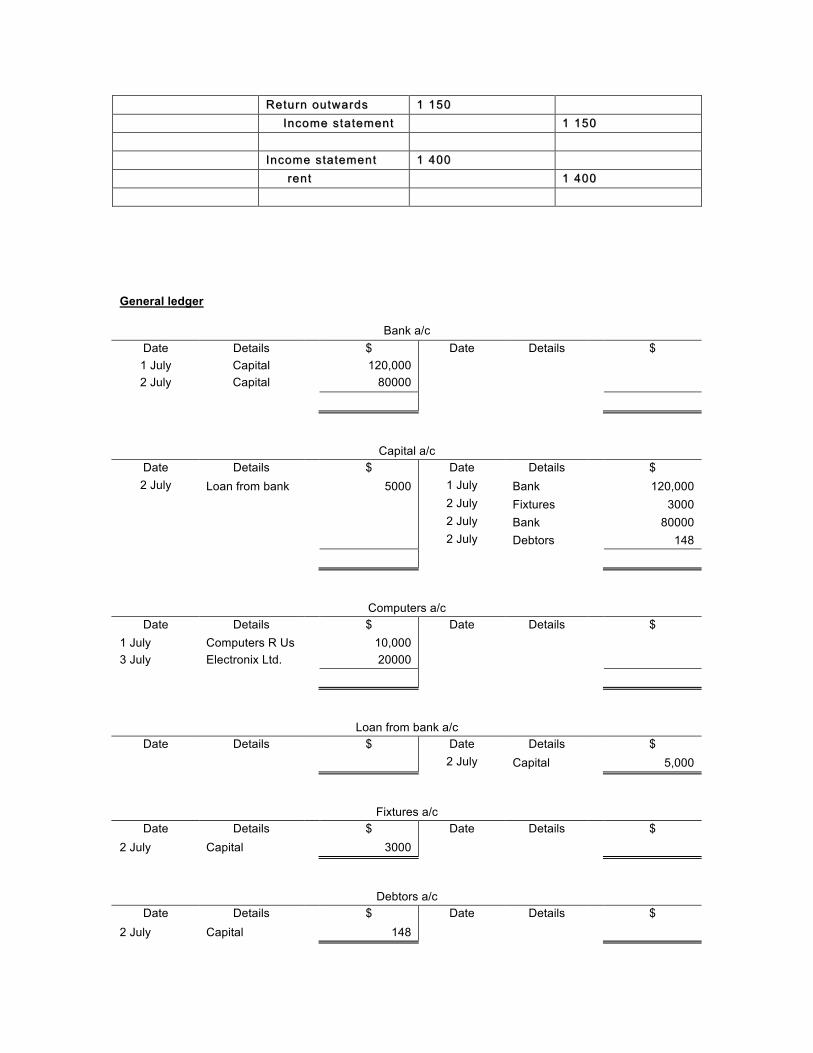
RetuRetu rn outwardsrn outwards 1 1501 150 Income statement Income statement 1 1501 150 Income statementIncome statement 1 4001 400 rent rent 1 4001 400
General ledger
Bank a/c Date Details $ Date Details $ 1 July Capital 120,000 2 July Capital 80000
Capital a/c Date Details $ Date Details $ 2 July Loan from bank 5000 1 July Bank 120,000
2 July Fixtures 3000 2 July Bank 80000 2 July Debtors 148
Computers a/c Date Details $ Date Details $
1 July Computers R Us 10,000 3 July Electronix Ltd. 20000
Loan from bank a/c Date Details $ Date Details $
2 July Capital 5,000
Fixtures a/c Date Details $ Date Details $
2 July Capital 3000
Debtors a/c Date Details $ Date Details $
2 July Capital 148
Music system a/c Date Details $ Date Details $
2 July Electronix Ltd. 4000
Purchases ledger
Computers R Us Ltd a/c Date Details $ Date Details $
1 July Computers 10,000
Electronix Ltd a/c Date Details $ Date Details $
3 July Computers 20,000 3 July Music system 4000
2)
Abigail’s Interior Designs Trial balance
as at 31 May 2009 Dr Cr
Bank 480,000
Capital 500,000
Purchases 25,000
Sales 3,000
Delivery van 150,000
Purchases ledger: P. Eagle 5,000
Purch. ledger: Super Motors Ltd. 150,000
Sales ledger: A. Ran 3,000
658,000 658,000
3) General Ledger
Postage/Stationery Date Details $ Date Details $ 2008
30-Apr Petty cash 45.20
Travel expenses Date Details $ Date Details $ 2008
30-Apr Petty cash 85.00
Purchases Ledger
Chris Broach Date Details $ Date Details $ 2008
30 Apr Petty cash 25.10
4.
Sales Journal
DATE CUSTOMER AMOUNT
2008 May 1
3
10
T. James
S. Games
K. Dart
TOTAL CREDIT SALES
5 000
2 000
1 500
$8 500
Sales Ledger
T. James a/c
2008 $ May 1 Sales 5 000
S. Games a/c
2008 $ May 3 Sales 2 000
K. Dart a/c
2008 $ May 10 Sales 1 500
5) a.
Purchases Journal Date Supplier name Invoice # Amount 2007 May
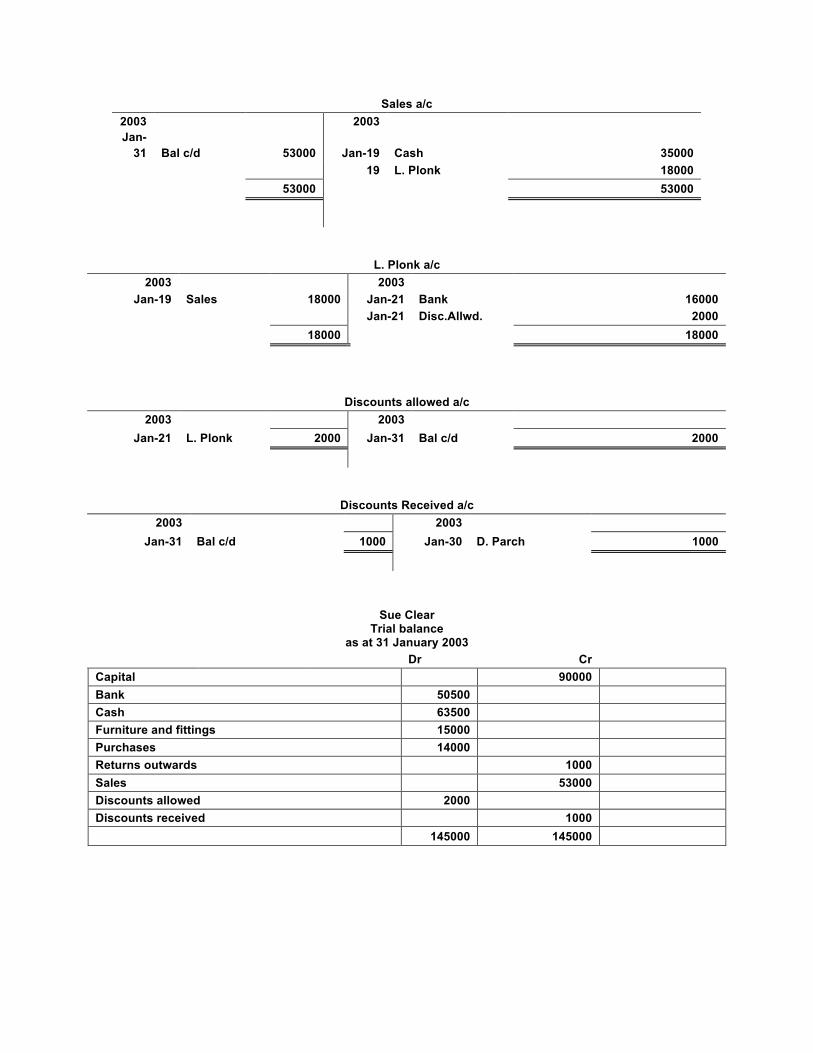
as at 31 January 2003 Dr Cr Capital 90000 Bank 50500 Cash 63500 Furniture and fittings 15000 Purchases 14000 Returns outwards 1000 Sales 53000 Discounts allowed 2000 Discounts received 1000 145000 145000
Multiple Choice
1. B 2. C 3. A 4. A 5. B 6. A
1) Reduces cost of sales.
2) Increases gross profit.
3) Reduces sales.
4) Recalculation of reported profits for the year ended 30th April, 2010
Incorrect profit $2 000 Less: Increase in purchases 5 100 Revised Loss $3 100 Restatement of fixed assets as at 30th April, 2010 Incorrect fixed assets $6 300 Less: Office desk purchased $5 100 Revised fixed assets $1 200
5)
Francis Income statement for the year ended 31 December, 2006 $ $ Sales 190576 Cost of sales Purchases 119832 Closing stock (12,408) 107,424 Gross profit 83,152 Expenses Salaries 56527 Motor expenses 2416 Rent 1894 Insurance 372 General expenses 85 61294 Net profit 21,858 Francis Balance sheet as at 31 December, 2006 Fixed assets $ $ Premises 95420 Motor vehicles 16594 112014 Current assets Inventory (aka Stock) 12,408 Debtors 26740 Bank 16519 Cash 342 56009 Current liabilities
Creditors 16524
39485 151499
Owner's equity ( Capital) At start of the period 138066 Net income 21,858 Drawings (8425) At end of the period 151499
6) M. Jackson
Income Statement
Sales 35 000
Return Inwards (2 000)
Net sales 33 000
Purchases 20 000
Carriage inwards 600
Returns outwards (1 000) (19 600)
Gross Profit 13 400
Discount received 200
13 600
Insurance 3 000
Motor expenses 5 000
Net Profit 8 000
5 600
M. Jackson Balance Sheet
Fixed Assets 12 000
Premises 7 000
Fixtures and Fittings 19 000
Current Assets
Debtors 6 100
Current Liabilities
Creditors (1 500)
Working capital 4 600
23 600
Capital 28 000
Net profit 5 600
Drawings (10 000)
23 600
Multiple Choice
1. A 2. D 3. B 4. A 5. B 6. D
Review Questions A 1) Depreciation is the means to calculate the loss n value of fixed assets. 2) Depreciation is calculated by using two methods :
(a) Straight line – (i) Cost of the fixed asset less estimated
Scrap/residual value/estimated useful Life of the fixed asset
(ii) Cost of the fixed asset x rate of Depreciation. (b) Reducing - Net book value of fixed asset x rate of depreciation. 3) The recording of Double entry bookkeeping is the same for the two methods – debit Depreciation
expense and credit Provision for depreciation of the fixed asset. 4) No, in the Profit and Loss account. 5) Depreciation expense in debited in the depreciation account and then transferred to the Profit and
Loss account. The provision for depreciation account balance is transferred to the Balance Sheet and deducted from the Fixed asset.
6)
Depreciation expense A/c Year 1 Provision for
depreciation 121500 Profit &
Loss 121500
Year 2 Provision for
depreciation 88695 Profit &
Loss 88695
Year 3 Provision for
depreciation 64747.35 Profit &
Loss 64747.35
Year 4 31-Dec Provision for
depreciation 47265.57 Profit &
Loss 47265.57
Year 5 Provision for
depreciation 34503.86 Profit &
Loss 34503.86
Provision for depreciation A/c
2000 Dec 31 Bal c/d 121500 Jan 1 Depreciation
Expense 121500
2001 Dec 31 Bal c/d 210195 Jan 1 Bal b/d 121500
Dec 31 Depreciation expense
88695
210195 210195
2002 Dec 31 Bal c/d 274942.35 Jan 1 Bal b/d 210195
Dec 31 Depreciation expense
64747.35
274942.35 274942.35
2003 Dec 31 Bal c/d
322207.92 Jan 1 Bal b/d 274942.35
Dec 31 Depreciation expense
44 7265.57
322207.92 322207.92
2004 356711.78
322207.92
34503.86
356711.78 356711.78
Dec 31 Bal c/d
Jan 1 Dec 31 2005 Jan1 Bal b/d
Bal b/d Depreciation expense
356711.78
Depreciation expense: Building (10% x 125 000) 12 500 Fixtures and fittings (10% x 42 500) 4 250 Machinery 25% x (62 750-15 800) 11 737.50
7)
Multiple Choice 1. A 2. C 3. C 4. C 5. B 6. C
(ii)
Provision for Depreciation:
Buildings 99,000
Machinery 27,538
Fixture and Fittings 12,750 Depreciation expense: Building 12500 Fixtures and fittings 4250 Machinery 11737.5 (iii)
Trial Balance (Extract)
Land 250,000
Building 125,000
Machinery 62,750
Fixtures and Fittings 42,500
Provision for Depreciation:
Buildings 99,000
Machinery 27,538
Fixture and Fittings 12,750 Depreciation expense: Building 12500 Fixtures and fittings 4250 Machinery 11737.5
1. D 2. A 3. B 4. B 5. C 6. A 7. D 8. B 9. A 10. D
Q1
Direct debits -This is where you give the creditor the right to obtain the money straight from your bank
account. This form of withdrawal is mainly used when there are different amounts to be paid each period (weekly, monthly, quarterly etc.)
Standing orders -Here, you instruct the bank to deduct a fixed amount every period. Useful for insurance and mortgage payments.
Overdraft interest -This will be deducted by the bank as a form of penalty for withdrawing more than you have in your account.
Dishonoured cheque – This is a cheque which had been received from a customer and deposited but has been discovered to be invalid. A cheque becomes invalid for several reasons including insufficient funds, improper information placed on the cheque (e.g. wrong date, improper signature, words and figures for the amount
Q2
Making deposits -This is shown by the word "deposit" in the statement. Direct credits - The opposite of a direct debit. Here you give the debtor the right to put money straight
into your account. For example salaries deposits, or dividends from investments Interest earned - This is money that you have gained by holding cash in the bank.
Q3
Big Doors Enterprises
(i) Bank reconciliation statement for the month ended 31 March, 2009
Bank statement balance $4500 Bank statement balance $2200 Less: Unpresented cheques $1500 Adjusted cash book balance $5200
(ii) $5200
Q4
Adjustment to cash book as at 31 January, 2007 Unadjusted balance per cash 26840 Direct credit 700 Bank charges (500) Dishonoured cheques (590) Adjusted cash book bank balance 26450
Q5
Amanda’s bank reconciliation statement as at 31 May, 2009
Adjusted cash book balance 2125 Add unpresented cheques 5000 Less deposits (1000) Bank statement balance 6125
Q6
(a)
Adjusted Cash Book balance 1050 Add direct credit 700 Less bank charges (500) Adjusted cash book balance 1250
(b)
Bank Reconciliation Statement Adjusted cash book balance 1250 Add unpresented cheques – R. Joseph 1750 Bank statement balance 3000
Multiple Choice
1. D 2. C 3. D 4. A 5. B 6. B
1. (a)
Simone and Catherine Partnership Company Profit and Loss Appropriation account
For the year ended June 30
Net Profit 46 000
Less: 10 000
Salary – Simone
Interest on Capital:
Simone 1 000
Catherine 2 500
3 500
13 500
32 500
Share of profit: Simone 9 286
Catherine 23 214 32 500
(b)
Simone and Catherine Current accounts
SIMONE CATHERINE SIMONE CATHERINE
Balance b/d 2 000 1 400 Salary 10 000
Drawings 7 500 12 750 Interest on capital 1 000 2 500
Simone and Catherine Partnership Company Balance Sheet As at June 30
Fixed assets 112 550
Current assets:
Stock 3 000
Debtors 14 000
17 000
Less current liabilities
Creditors 12 000
Bank loan 25 200 (37200)
(20 200)
92 350
Financed by
SIMONE CATHERINE
Capital accounts 20 000 50 000 70 000
Current accounts 10 786 11 564 22 350
92 350
2. (a)
Caleb and Garnet General Journal For July 1, 2012
DATE DETAILS DEBIT CREDIT
2012
July 1 cash 12 000
stock 24 000
debtors 2 250
furniture 6 000
premises 20 000
Motor vehicle 9 000
Bank overdraft 2 000
creditors 4 750
Capital: Caleb 32 500
Garnet 34 000
(b)
Caleb and Garnet Profit and Loss Appropriation account
For the period ending December 31, 2012
Net Profit 48 000
Less: Salary: Caleb 18 000
Garnet 13 200
Interest on capital: Caleb 813 31 200
Garnet 850
1 663
(32 863)
15 137
Share of profit:
Caleb 7 398
Garnet 7 739
15 137
(c) Caleb and Garnet
Balance Sheet (extract) As at December 31 2012
Caleb Garnet
Capital 32 500 34 000 66 500
Current 18 289 24 211 42 500
50 789 58 211 109 000
3. (a) Brendan, Kyle and Kwesi Partnership Company
Profit and Loss Appropriation Account For the year ending September 30, 2011
Net profit 120 000
Interest on drawings: Brendan 500
Kyle 100
Kwesi 200 800
Less: 120 800
Salary: Brendan 25 000
Kwesi 28 000
53 000
Interest on Capital:
Brendan 2 500
Kyle 2 000
Kwesi 3 000 (60 500)
60 300
7 500
Share of profit:
Brendan 20 100
Kyle 16 080
Kwesi 24 120 60 300
(b) Brendan, Kyle and Kwesi
Current Accounts
BRENDAN KYLE KWESI BRENDAN KYLE KWESI
Balance b/d 1 000 Balance
b/d 5 000 6 000
Drawings 5 000 1 000 2 000 Salary 25 000 28 000
Interest on drawings
500 100 200 Interest on
capital 2 500 2 000 3 000
Balance c/d 47 100 50 980 23 920 Share of
profit 20 100 16080 24120
52 600 52 080 27 120 52 600 52 080 27 120
4.
(a) (i) 5% (ii) $54 500
(b)
Justine, Keshaun and Kwame Capital accounts
For the year ended December 31, 2012 JUSTINE KESHAUN KWAME JUSTINE KESHAUN KWAME
Balance b/d
40 000 50 000 80 000
(c)
Justine, Keshaun and Kwame Current accounts
JUSTINE KESHAUN KWAME JUSTINE KESHAUN KWAME
Balance b/d
1 200 2 00 Balance b/d
1 600
Drawings 2000 3500 2500 Salary 12 000 9 000 6 000
Interest on drawings
200 350 250
Interest on capital
2 000 2 500 4 000
Balance c/d
20000 13050 11850 Share of
profit 6 600 6 600 6 600
22 200 18 180 16 600 22 200 18 100 16 600
Multiple Choice
1. A 2. B 3. C 4. D 5. C 6. C
1. Preference shares tend to have a fixed dividend percentage rate. Holders of these shares are paid before any other shareholders. The owners of these shareholders have no voting rights. Ordinary share holders are paid after the preference share holders. These owners have voting rights.
2. The holders of Ordinary shares are owners of a company whereas persons/companies who give debenture loans are creditors of a company.
3. Par value is the face value of a share whereas issue value is the price used when shares are first sold to the public.
4. (i) T (ii) T (iii) F (iv) F (v) F (vi) T (vii) F
5.
Date Details folio Dr Cr 2009 Jan-25 Cash 250000 Preference shares 250000 To record the issue of preference shares Jan-25 Cash 375000 Ordinary shares 375000 To record the issue of ordinary shares Jan-25 Cash 250000 Debentures 250000 To record the issue of debentures
Farrel Ltd Appropriation a/c
for year ended December 31 2009 Profit before interest 225000 Interest expense (250000 x .15) (-37500) 187500 Dividends: Preference (250000x 10%) 25000 Ordinary (375000 x 20%) 75000 -(100000) Retained profit at close 87500
Farrel Ltd Balance Sheet extract
as at December 31 2009 Authorised share capital 100,000 ordinary shares @ $5 each 500000 25000 10% preference shares @ $10 each 250000 750000
Issued share capital 75000 ordinary shares @ $5 each 375000 25000 preference shares @ $10 each 250000 Reserves Retained earnings 87500 712500 Long-term liabilities Debentures 250000 Current liabilities Interest owing 37500 Dividends owing 100000 137500
Multiple Choice 1. C 2. A 3. D 4. A 5. B 6. C
Q1 III Q2
a) Patronage refund b) One vote per member c) Compulsory capital retention d) Common characteristics
Q3 (a)
Grenada Plantain Co-operative Society Ltd General Journal
DATE DETAILS F DR CR 2005 Jan 1 Cash (500 x 100 x
5) 250 000
Share capital 250 000 To record the issue
of shares
(b)
Grenada Plantain Co-operative Society Ltd General Journal
DATE DETAILS F DR CR 2007 Jan 1 Cash (500 x 200 x
5) 500 000
Share capital 500 000 To record the issue
of additional shares
(c)
Share Capital a/c 2005 2005 Dec 31 balance c/d 250 000 Jan 1 cash 250 000 2006 2006 Dec 31 balance c/d 250 000 Jan 1 balance c/d 250 000 2007 2007 Dec 31 balance c/d 750 000 Jan 1 balance b/d 250 000 Jan 1 cash 500 000 2008 Jan 1 balance b/d 750 000 Q4
St. Barnabas Coconut Co-operative Society Limited Company Trading and Profit and Loss a/c
a) Capital b) Revenue c) Surplus d) Sports e) Benefits
Q2 Bung Jet Swimming Club Receipts and Payment a/c
For the month January 2006
Balance b/d 10 000 Purchase of swimming gears 1 500 Subscriptions 9 000 Deposit on swimming pool 15 000 Sale of swimming gears 6 000 Curry-que expenses 8 000 Sponsored swimming 10 000 Salaries 4 000 Curry-que 15 000 Refurbishment of swimming 10 000 50 000 Balance c/d 11 500 Balance b/d 11 500 50 000 Q3
Subscription a/c
Bal b/d 300 Receipts and Payments 12 000 Income and Expenditure 9 000 12 000 Bal c/d 2 700 Balance b/d 2 700 12 000
South East University Education Church Group Receipts and Payments a/c
For the year ended March 31st, 2007 Bal b/d 8 000 Bar purchases 4 000 Subscriptions 12 000 Water rates 1 000 Bar sales 8 000 Computer 5 000 Donations 3 000 Utilities 800 Lunch sales 2 000 Lunch expenses 800 33 000 Bal c/d 21400 Balance b/d 21 400 33000
South East University Education Church Group Bar Trading a/c
For the year ended March 31st, 2007
Bar sales 8 000 Stock 2 000 Purchases 4 000 Goods available for sale 6 000 Stock (2000) Cost of goods sold (4000) Gross Profit 4000
Q4 (a) Receipts and Payments a/c
Subscriptions 1 300 Club equipment 2 000 Sale of refreshments 1 000 Rent 500 Donations 1 000 Caterer for friendly match 1 500 Receipts from the friendly match 3 000 Electricity 600 Receipts from the curry-que 2 000 Balance c/d 3 700 8 300 8 300 Balance b/d 3 700 (b)
Subscriptions a/c
Income and expenditure 1 500 Cash 1 300 1 500 Balance c/d 200 Balance b/d 200 1 500 (c)
Giants Cycling Club Income and Expenditure a/c
For the month of November 30, 2007
Subscriptions 1 500 Sales of refreshments 1 000 Donations 1 000 Profit from the friendly match (3 000 – 1 500) 1 500 Receipts from the curry-que 2 000 7 000 Less: Rent 500 Electricity 600 (1 100) Surplus 5 900
Q5 (a)
Sales 6 000 Stock 1 000 Purchases 2 500 Goods available for sale 3 500 Stock 1 000 Cost of goods sold (2 500) Gross profit 3 500
(b)
Subscriptions a/c Balance b/d 100 Balance b/d 300 Income and expenditure 5 500 Receipts and payments 5 000 5 600 Balance c/d 300 Balance b/d 300 5 600 (c)
Southern Chess Club Income and expenditure account
For the year ending December 31, 2008
Gross profit b/d 3 500 Subscriptions 5 500 Proceeds from raffle 6 000 Entrance fees for class competition 4 000 19 000 Less: Tournament expenses 2 000 Electricity (500 + 300 800 Miscellaneous expenses 300 Donation to charity 1 000 Repairs to clubhouse 1 000 (5 100) Surplus 13 900
(d) Accumulated Fund (calculation)=
TOTAL ASSETS - TOTAL LIABILITIES (Cash + stock + subscriptions in arrears + clubhouse + games) – Subscriptions in advance
24 100 – 300 = 23 800
Southern Chess Club
Balance sheet As at December 31, 2008
FIXED ASSETS 10 000 Clubhouse 7 000 Games (5 000 + 2 000) 17 000 CURRENT ASSETS Stock 1 000 Cash 19 700 Subscriptions in arrears 300 21 000 Less current liabilities Electricity (300) 20 700 37 700 ACCUMULATED FUND At start 23 800 Surplus 13 900
37 700
Multiple Choice
1. A 2. D 3. B 4. B 5. D 6. D
Q1
a) Indirect b) work in progress, finished c) Direct d) Value
Q2
(a) NET PURCHASES Purchases of raw materials 400 000 Transportation inwards 1 000 Purchases returns (6 000) NET PURCHASES 395 000
(b)
RAW MATERIALS CONSUMED Opening stock of raw materials 50 000 Net purchases 395 000 Raw materials available for use 445 000 Less closing stock ( 30 000) Raw materials consumed 415 000
(c)
PRIME COST Cost of raw materials consumed 415 000 Direct wages 100 000 Add wages owing 2 000 102 000 PRIME COST 517 000
(d)
COST OF GOODS MANUFACTURED
Prime cost 517 000 Factory over head: Factory power 35 000 Factory insurance (3 000 – 1 000) 2 000 Other factory expenses 18 000 Factory machinery depreciation 15 000 Total factory overhead 70 000 Total manufacturing costs 587 000 Add opening work in progress 40 000 627 000 Less closing work in progress (20 000) Cost of goods manufactured 607 000
Q3 Prem Singh
Manufacturing a/c For the period ended December 31, 2007
Opening stock raw material 700 Purchases of raw materials 5 000 Available for use 5 700 Less raw materials closing stock (800) Cost of raw materials used 4 900 Production wages 5 000 Prime cost 9 900 Overheads: Factory machine maintenance 600 Factory power 300 Factory wages (4000 + 300) 4 300 Factory Rent 500 Factory insurance 400 Factory electricity 600 Depreciation on plant and machinery 1 000 Factory salaries 2 000 Total overheads 9 700 Total manufacturing costs 19 600 Add work in progress 900 20 500 Less work in progress 1 000) Cost of goods manufactured 19 500
Unit cost of chocolate Cost of goods manufactured = 19 500 = $9.75 Number of units produced 2 000
Multiple Choice
1. A 2. A 3. A 4. B 5. D 6. C
Q1
a) $13.50 b) $18
c) $15 d) $18
e) $36 f) $28
g) $21 h) $30
Q2
(a) Gross pay: $820 + $120 = $940
(b) Total deductions: $166.85
(c) Net pay: $773.15
Q3
Payroll Extract
Name of Regular Overtime Overtime Overtime Gross Deductions Net Employees Pay Hours Rate Pay Pay NIS PAYE Pay
NAME OF EMPLOYEE : J. Parker Department: Production $870.00 Earnings: Deductions: N.I.S. $43.50 Pension 21.75 Savings 43.50 P.A.Y.E. 80.48 Total Deductions 108.75 Net Pay $761.25
Q5
(a)
Payroll Register
Name of Regular Overtime Overtime Overtime Gross Deductions Net