21


| 1
MONETARY POLICY STATEMENT
The BI Board of Governors decided on 14th July 2015 to hold the BI Rate at 7.50%, while maintaining the Deposit Facility rate at 5.50% and the Lending Facility rate at 8.00%. The decision is congruent with efforts to control inflation within the target corridor of 4±1% in 2015 and 2016. The policy mix of Bank Indonesia is consistently directed towards maintaining macroeconomic stability, despite widespread global uncertainty, as well as preserving growth through accommodative macroprudential policy. Furthermore, Bank Indonesia constantly strengthens policy coordination with the government in terms of inflation control and expedites fiscal stimuli in order to catalyse economic growth. In addition, Bank Indonesia supports central and local government efforts to accelerate budget realisation, including infrastructure projects, while persevering with a variety of structural reforms as the key to a sounder domestic economic outlook.
Global growth remained towards the lower end of the previous projection amidst ubiquitous uncertainty blighting global financial markets. Weaker-than-expected growth stemmed from economic moderation in China along with flagging US economic indicators. Despite early signs of improvement, US economic projections were revised down on weak first quarter actuals, coupled with sluggish exports and investment. In addition, uncertainty regarding the FFR hike in the United States persisted. Economic moderation endured in China despite early signs of improving monetary indicators in line with the looser policy stance adopted. In contrast, the economy of Europe rallied as domestic demand surged amidst the undulations of the ongoing crisis in Greece. The sluggish global economy perpetuated sliding international commodity prices despite a gradual increase in the oil price. On global financial markets, uncertainty concerning the proposed FFR hike and the crisis in Greece as well as stock price shocks in China demonstrated that risks on global financial markets remain intense.
On the home front, domestic growth was projected to remain limited in the second quarter but then rebound thereafter in the third. Households were inclined to consume less as confidence ebbed, which was reflected by declining automotive and retail sales. In addition, central and local government spending also remained low, precipitating limited investment growth in line with delayed infrastructure realisation and weak investment in machinery and transportation equipment. Externally, limited export growth was projected due to an inauspicious global economy and persistently low international commodity prices. Moving forward, Bank Indonesia predicts economic growth to improve during the second semester of 2015 as infrastructure projects are implemented and banks extend more lending.
The Indonesia trade balance recorded a surplus again in June, predominantly due to a non-oil and gas surplus. The trade surplus improved the current account deficit in Q2/2015, which was projected at around 2.5% of GDP, improving on the 3.9% of GDP reported in the same period of the previous year. In terms of the financial account, foreign capital inflows surged despite global financial markets steeped in uncertainty. Accumulatively, foreign portfolio inflows to Indonesian financial markets up to June 2015 totalled US$4.7 billion. Consequently, the position of foreign exchange reserves at the end
TINJAUAN KEBIJAKAN MONETER MONETARY POLICY REVIEW
1

| 2
of June 2015 was US$108.0 billion, equivalent to 7.0 months of imports or 6.8 months of imports and servicing public external debt, which is well in excess of the international adequacy standard of three months.
The rupiah depreciated primarily on external factors. In June 2015, the rupiah depreciated by an average of 1.28% (mtm) to a level of Rp13,311 per US dollar. Externally, the rupiah was influenced by concerns over Greek restructuring negotiations as the deadline approached along with investor anticipation of the policy direction pursued by the Federal Reserve at the FOMC meeting in June 2015. Internally, growing demand for foreign exchange to repay debt and to make seasonal dividend payments in the second quarter exacerbated pressures on the rupiah. Moving forward, Bank Indonesia will continue to maintain rupiah stability in line with its fundamental value, thereby bolstering macroeconomic and financial system stability.
Inflationary pressures were less intense in June 2015 than previously thought. CPI inflation was recorded at 0.54% (mtm) or 7.26% (yoy) in June 2015. Consequently, headline inflation during the first semester of 2015 was kept low at just 0.96% (ytd). Core inflation was relatively controlled at 0.26% (mtm) or 1.99% (ytd) and 5.04% (yoy) in line with well-anchored inflation expectations. Based on actual inflation through to June 2015, Bank Indonesia remains upbeat that the inflation target for 2015 of 4±1% will be achieved.
Financial system stability was solid, underpinned by a resilient banking system and stable financial market performance. The banking industry remained resilient with credit, liquidity and market risks mitigated. A robust Capital Adequacy Ratio (CAR) persisted in May 2015, at 20.3%, well above the minimum 8% threshold. Meanwhile, non-performing loans (NPL) remained low and stable at 2.6% (gross) or 1.4% (net). In terms of the intermediation function, credit growth achieved 10.4% (yoy), relatively unchanged from the previous period. On the other hand, deposit growth at the end of May 2015 was 12.5% (yoy). Future credit growth is predicted to accelerate on the back of escalating economic activity and looser macroprudential policy instituted by Bank Indonesia.

| 3
THE ECONOMY AND MONETARY POLICY
Global Economic Performance
Global economic growth still trended towards the lower end of the previous projection amidst global financial markets blighted by ubiquitous uncertainty. Weaker-than-expected growth stemmed from economic moderation in China along with flagging US economic indicators. Despite early indications of recovery, the US economy is predicted to perform below the previous projection as a result of low first quarter actuals as well as torpid exports and investment. Congruously, uncertainty surrounding the magnitude and timing of the Federal Funds Rate (FFR) hike in the US endured. The economy of China continued to moderate despite several monetary indicators showing signs of improvement in line with the looser policy stance adopted. In contrast, the economy of Europe gained momentum on stronger domestic demand against the Greek crisis as a backdrop. The weaker-than-expected global economy perpetuated the international commodity price slide despite the global oil price gradually picking up. On global financial markets, uncertainty concerning the proposed FFR hike and the crisis in Greece as well as stock price shocks in China proved that intense risks continue to linger.
In general, US economic projections are lower than previously estimated due to weak first quarter actuals, coupled with flagging exports and investment. Exports continued to contract on broad US dollar appreciation and sluggish global demand. Furthermore, the trend of declining exports combined with growing imports confirmed the adverse impact of US dollar appreciation on the US economy (Graph 2.1). Meanwhile, non-residential investment also showed signs of slower growth, especially in the mining sector in line with the low oil price (Graph 2.2). Nonetheless, preliminary indications of US economic gains were observed. Domestically, after declining since January 2015, stronger retail sales evidenced flourishing demand. Moreover, disposable income and consumer spending also grew robustly. An increase in new orders along with a persistent manufacturing PMI and services PMI in the expansive zone revealed early signs of supply-side improvements.
The economy of China continued to moderate. The economic moderation is due to an export contraction, the magnitude of which subsided. In addition, low fixed asset investment (FAI) growth exacerbated the slowdown in China. Nevertheless, several monetary indicators showed initial signs of improvement due to the looser policy stance adopted through lower lending and deposit rates as well as application of a targeted reserve requirement ratio (RRR) that is expected to add RMB650 billion of liquidity to the banking sector. Congruent with looser policy, several monetary indicators were observed to improve, including growth of M2, new loans and aggregate financing.
2

| 4
Graph 2.1. US Export and Import Graph 2.2. US Non-Residential Investment
Conversely, the economy of Europe continued to recover, supported by growing domestic demand amidst the Greek crisis. Demand surged on growing consumption as retail sales escalated (particularly the non-food index). On the production side, manufacturing PMI increased, primarily on new orders. In line with stronger domestic demand, employment indices, predominantly in peripheral European countries, increased. Furthermore, the total labour force in Germany and France expanded but to a lesser degree.
The economies of Japan and India grew in accordance with previous projections. Demand remained weak in Japan, reflected by a PMI contraction, particularly on new orders, and confirmed by weaker department store sales. The decline in domestic demand was mirrored by a decrease in the production index. Despite sluggish demand, optimism in the Japanese economy stemmed from the labour market and consumer confidence as labour cash earnings increased and unemployment declined. In India, consumption and investment buoyed economic growth. PMI rebounded on new orders and production level, particularly in the utilities sector, coal and miscellaneous mining. Stronger car sales also demonstrated growing domestic demand. Despite higher inflation, consumer confidence in the economic outlook for India remained solid as a result of government-led structural reforms.
A sluggish global economy perpetuated the international commodity price slide despite a gradual increase in the global oil price. The significant decline in export commodity prices is expected to continue through 2015 due to broad US dollar appreciation combined with economic moderation in China. The prices of copper, tin and nickel were recently predicted to dip below initial projections, while the coal price is expected to slump in 2015, driven by a low natural gas price, Mercury and Air Toxic Standards, plans to impose higher import taxes on coal in South Korea on 1st July 2015 as well as plans in China to tighten coal quality standards on 1st July 2015.
On global financial markets, uncertainty surrounding the proposed FFR hike and the crisis in Greece as well as stock price shocks in China proved that risks continue to linger. Uncertainty over the FFR hike persisted due to current US economic conditions. The majority of market players predicted the FFR hike for September 2015, despite a growing number of market players favouring December. A Bloomberg survey, dated 11th June 2015, showed that the majority of respondents still expected the FFR hike to occur in Q3/2015, despite an increasing number leaning towards Q4/2015 (Graph 2.3). Meanwhile, implied probability indicates the FFR hike to take place in December 2015 or January 2016 (Graph 2.4). On the other hand, the possibility of the debt crisis in Greece triggering a sudden reversal of portfolio capital from emerging markets, including Indonesia, is considered

| 5
relatively limited. Nonetheless, the impact of stock price shocks in China on the financial sector and spillover to other countries demands vigilance.
Graph 2.3. Bloomberg Survey: FFR Graph 2.4. Current Implied Probabilities: FFR
Economic Growth
Limited economic expansion is projected in Indonesia for the second quarter, with growth subsequently rebounding in Q3/2015. Weak household consumption is expected in line with waning consumer confidence as automotive and retail sales dropped off. In addition, actual government spending was low at the central and regional levels, precipitating limited investment growth in line with slower-than-expected infrastructure project implementation and a lack of investment in machinery and transportation equipment. Externally, limited export growth was predicted consistent with the inauspicious global economy and persistently low international commodity prices. Bank Indonesia projects economic growth to pick up in the second semester on the back of infrastructure project implementation and greater bank lending.
Weak household consumption is predicted in line with declining consumer confidence. Weak household consumption is, indicated by a deepening contraction of retail and automotive sales (Graph 2.5), forcing retailers to trim sales targets up to yearend 2015. The Consumer Confidence Index (CCI) also decreased during the second quarter of 2015 (Graph 2.6). Additionally, limited income growth further stifled household consumption. The farmers’ terms of trade deteriorated (Graph 2.7) and real wages achieved limited growth.
Graph 2.5. BI Retail Sales Graph 2.6. Consumer Confidence Index

| 6
Graph 2.7. Farmers ToT, Real Construction
Labour Wages and Real Farmer Labour Wages
Limited investment growth is projected in line with slower infrastructure realisation than previously forecasted. The postponement of private and government infrastructure projects undermined construction investment, while non-construction investment also slumped, which was evident from the investment decline in machinery and transportation equipment. Declining investment in machinery was confirmed by less electricity consumption and decreasing imports of machinery and equipment since the middle of 2014 (Graph 2.8). Investment in transportation equipment contracted, as reflected by commercial vehicle sales that remained in negative territory (Graph 2.9). In addition, sales of heavy equipment continued to record a contraction.
Graph 2.8. Machine Investment and
Indicators Graph 2.9. Transportation Equipment and
Indicators
From an external standpoint, limited export growth is projected in line with the inauspicious global economy and persistently low international commodity prices (Graph 2.10). The protracted global economy undermined demand as world trade volume decreased, which subsequently maintained the downward export commodity price trend. Limited export growth was achieved due to stronger manufacturing exports, primarily CPO, and mining exports, particularly tin, which increased due to the base effect of the Mineral and Coal Mining (Minerba) Act.
Weak import growth is projected for the second quarter in response to lacklustre exports and domestic demand. Weak import growth is affecting all components through to May 2015 (Graph 2.11), including imports of raw materials that had previously enjoyed robust growth. An increasingly deep contraction hampered raw material imports, especially processed raw materials for industry. Meanwhile, imports of capital goods dropped off,

| 7
especially non-transportation equipment. Imports of consumer goods also declined in the form of processed foods and beverages to meet the household requirement.
Graph 2.10. Price Index of Non-Oil and
Gas Export Graph 2.11. Non-Oil & Gas Import Growth
(Real Value)
The majority of economic sectors experienced a slowdown. Weaker global and domestic demand undermined performance of the tradeable and non-tradeable sectors. In terms of the tradeable sector, the manufacturing industry indicated weaker growth, reflected by less electricity consumption and lower output according to the Purchasing Manager Index (PMI) survey. The output decline was attributed to fewer domestic and external (export) new orders. Furthermore, sluggish global demand also impacted the mining sector, especially coal, which suffered lower prices and therefore a production contraction. Concerning the non-tradeable sector, a downturn marred the trade, hotels and restaurants (THR) sector. In addition to weaker automotive sales, retail sales also tailed off.
Bank Indonesia projects stronger economic growth for the second semester of 2015. This is based on greater infrastructure project implementation and bank lending.
Indonesia Balance of Payments
A trade surplus is projected in June 2015, bolstered by a non-oil and gas surplus. The surplus would help narrowing the current account deficit in the second quarter to less than 2.5% of GDP, improving upon the 3.9% of GDP recorded in the same period of the previous year.
In terms of the financial account, foreign capital inflows surged despite widespread uncertainty on global financial markets. Non-resident investors booked net purchases of financial assets to the tune of US$1.49 billion in June 2015 (Graph 2.12). Accumulatively, foreign portfolio inflows to domestic financial markets totalled US$4.7 billion up to June 2015.

| 8
Graph 2.12. Foreign Capital Flows
The position of foreign exchange reserves in Indonesia at the end of June 2015 was recorded at US$108.0 billion. This figure is down from US$110.8 billion a month earlier due to increased spending on servicing public external debt as well as rupiah stabilisation measures in order to maintain macroeconomic and financial system stability. Consequently, forex reserves were equivalent to 7.0 months of imports or 6.8 months of imports and servicing public external debt, which is well in excess of the international standard of three months. Bank Indonesia considers the current position of foreign exchange reserves adequate to support external sector resilience and maintain sustainable economic growth moving forward.
Rupiah Exchange Rate
The rupiah depreciated due to external factors. In June 2015, the rupiah depreciated on average by 1.28% (mtm) to a level of Rp13,311 per US dollar from Rp13,141 previously. Point-to-point (ptp), the rupiah decreased in value by 0.81%, closing at Rp13,333 per US dollar (Graph 2.13). Notwithstanding, rupiah depreciation was relatively moderate compared to other currencies in the region (Graph 2.14). From an external perspective, the Greece debt crisis and investor anticipation concerning the FOMC meeting in June 2015 affected rupiah sentiment. External pressures eased, however, after the dovish FOMC announcement (Graph 2.15). On the home front, growing demand for foreign exchange to repay debt and for seasonal dividend payments during the second quarter placed pressures on the rupiah.
Graph 2.13. The Movement of Rupiah Graph 2.14. Regional Currencies

| 9
Rupiah depreciation in June 2015 was accompanied by less volatility than most other regional currencies. Volatility did increase at the beginning of the month following rupiah depreciation after Greece delayed its debt repayments. Thereafter, however, rupiah fluctuations eased, which mitigated volatility. Rupiah volatility in June 2015 was less severe than that experienced by other regional currencies, including the Turkish lira, Malaysian ringgit, South Korean won and Singaporean dollar (Graph 2.16).
Graph 2.15. Indonesia VIX & CDS Graph 2.16. Exchange Rate Volatility
Looking forward, Bank Indonesia will continue to maintain rupiah stability in line with its fundamental value, thereby supporting macroeconomic and financial system stability.
Inflation
Inflationary pressures were lower in June 2015 than originally predicted. CPI inflation in June was recorded at 0.54% (mtm) or 7.26% (yoy). Consequently, headline inflation for the first semester of 2015 remained low at 0.96% (ytd). Meanwhile, core inflation was controlled at 0.26% (mtm) or 1.99% (ytd) and 5.04% (yoy) in line with well-anchored inflation expectations (Graph 2.17).
Graph 2.17. Disaggregation of Inflation
Volatile food inflation escalated in line with a spike in demand for foodstuffs during Ramadan but the increase was lower than expected. In June 2015, volatile foods recorded inflation of 1.74% (mtm) or 8.83% (yoy), increasing from 1.52% (mtm) or 8.10% (yoy) in the previous month (Graph 2.18). Nevertheless, the increase in volatile food inflation was not as pronounced as predicted nor as high as during the holy fasting month

| 10
last year due to persistent government price stabilisation measures, both in national and regional level.
Volatile food inflation primarily affected chilli varieties, chicken meat and rice. Red chilli prices increased at the onset of the planting season, which coincided with stronger demand during Ramadan. Furthermore, more expensive imported feed due to ongoing rupiah depreciation since the beginning of the year along with producer restrictions on day-old chicks (DOC) raised the price of chicken meat. Similarly, a spike in demand during Ramadan, after the harvest season, inflated rice prices. Nevertheless, further price increases were prevented through government price stabilisation measures, including market operations and provision of cheap markets (Table 2.1).
Table 2.1. Volatile Food Inflation Contribution
Graph 2.18. Volatile Food Inflation/Deflation
Inflationary pressures stemmed from higher electricity rates and non-subsidised fuels but administered prices remained under control. In June 2015, administered prices recorded inflation of 0.26% (mtm) or 13.14% (yoy), which was lower than the 0.38% (mtm) or 13.35% (yoy) posted a month earlier as well as the 3-year historical average for Ramadan at 0.55% (mtm) (Graph 2.19). Inflationary pressures on administered prices originated from a tariff adjustment to residential electricity rates for houses with a capacity of greater than 2,200VA as well as a non-subsidised fuel price hike (Pertamax and Pertamax Plus). Furthermore, clove cigarettes also contributed to higher inflation in June 2015 (Table 2.2).
Table 2.2. Administered Prices Inflation Contribution
Graph 2.19. Administered Prices Inflation
Core inflation was relatively controlled in June 2015. Core inflation recorded at 0.26% (mtm) or 5.04% (yoy), increasing moderately from 0.23% (mtm) or 5.04% (yoy) in the previous month. Core inflation in June, however, was lower than the 3-year historical average for Ramadan at 0.72% (mtm). Non-traded core inflation climbed in June as a knock-on effect of higher food prices as demand spiked during the holy fasting month

| 11
(Graph 2.20). In contrast, traded core inflation noted a decline due to relatively light external pressures, specifically international commodity prices (Graph 2.21).
Graph 2.20. Nontraded Core Inflation Graph 2.21. Traded Core Inflation and External Factor
Inflation expectations in June and for the year of 2015 were well controlled. Additionally, inflation expectations during this year’s Ramadan period were generally better than for the past three years. Notwithstanding, inflation expectations for 2015 increased on higher-than expected actual inflation in May 2015. Based on the monthly Consensus Forecast for June 2015, inflation increased moderately from 6.1% (yoy) to 6.2% (yoy) (Graph 2.22). Conversely, the BI Consumer Survey and Retail Sales Survey for the upcoming three months indicated a decline in inflation expectations in line with seasonal factors in the wake of Ramadan and Eid-ul-Fitr (Graph 2.23).
Graph 2.22. Consensus Forecast Inflation Expectation (Monthly)
Graph 2.23. Retailer’s Inflation Expectation
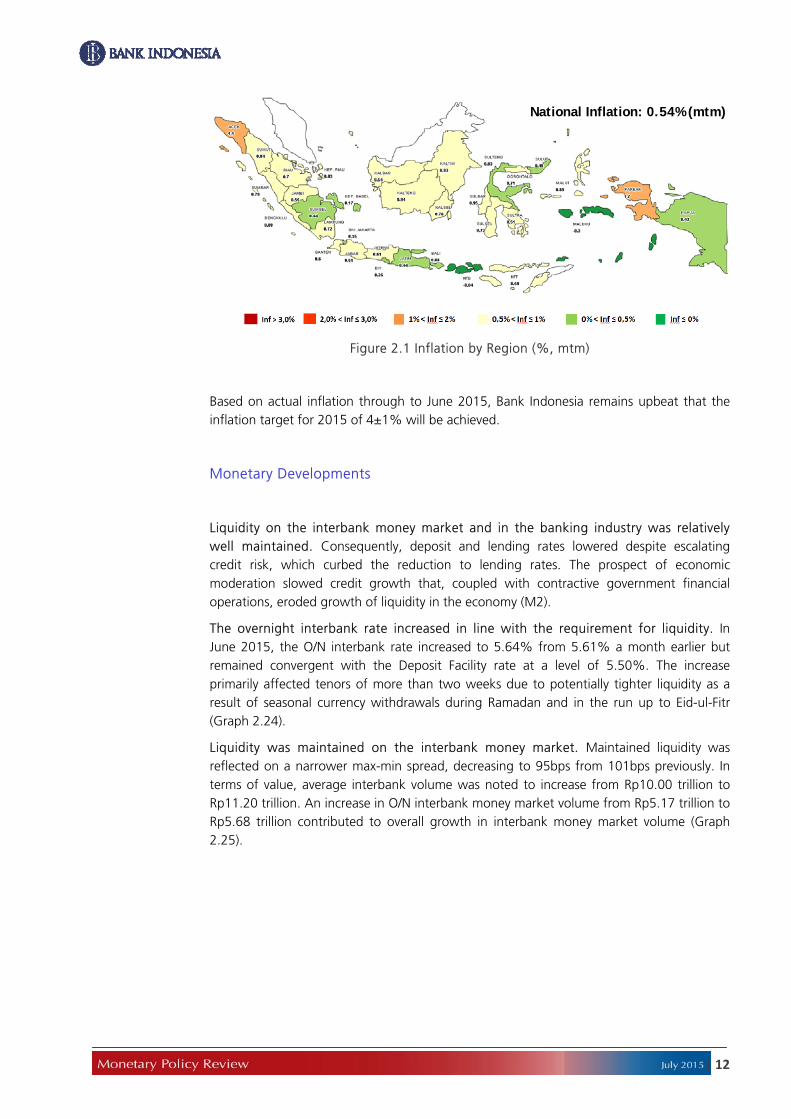
Nearly all regions contributed to escalating inflationary pressures in June 2015. Inflation in June 2015 is due to rising food prices in line with increased demand at the onset of Ramadan. In general, however, the inflation increase in most regions during the reporting month was lower than the 3-year average, with the exception of Kalimantan. Central Kalimantan and East Kalimantan contributed predominantly to rising inflation in Kalimantan area as a result of higher chicken meat and rice prices in both provinces. In contrast, inflation in Eastern Indonesia was lower than any other region due to deflation in West Nusa Tenggara and Maluku, which negated soaring inflation in several other provinces, such as West Papua and West Sulawesi (Figure 2.1). Harvests of several food commodities, including vegetables and shallots, at a number of production hubs in Eastern Indonesia helped bring inflation down compared to other regions.
| 12
Figure 2.1 Inflation by Region (%, mtm)
Based on actual inflation through to June 2015, Bank Indonesia remains upbeat that the inflation target for 2015 of 4±1% will be achieved.
Monetary Developments
Liquidity on the interbank money market and in the banking industry was relatively well maintained. Consequently, deposit and lending rates lowered despite escalating credit risk, which curbed the reduction to lending rates. The prospect of economic moderation slowed credit growth that, coupled with contractive government financial operations, eroded growth of liquidity in the economy (M2).
The overnight interbank rate increased in line with the requirement for liquidity. In June 2015, the O/N interbank rate increased to 5.64% from 5.61% a month earlier but remained convergent with the Deposit Facility rate at a level of 5.50%. The increase primarily affected tenors of more than two weeks due to potentially tighter liquidity as a result of seasonal currency withdrawals during Ramadan and in the run up to Eid-ul-Fitr (Graph 2.24).
Liquidity was maintained on the interbank money market. Maintained liquidity was reflected on a narrower max-min spread, decreasing to 95bps from 101bps previously. In terms of value, average interbank volume was noted to increase from Rp10.00 trillion to Rp11.20 trillion. An increase in O/N interbank money market volume from Rp5.17 trillion to Rp5.68 trillion contributed to overall growth in interbank money market volume (Graph 2.25).
National Inflation: 0.54% (mtm)

| 13
3
4
5
6
7
8
9
4
5
6
7
8
9
Mar‐13
Jun‐13
Sep‐13
Dec‐13
Mar‐14
Jun‐14
Sep‐14
Dec‐14
Mar‐15
Jun‐15
rPUAB O/N LF Rate
DF Rate BI Rate
% %
Graph 2.24. Overnight Interbank Market Rates
Graph 2.25. Overnight Interbank Market Rates & Vol DF O/N
The downward trend of bank deposit rate persisted, while lending rates were maintained. In May 2015, the weighted average deposit rate declined by 10bps to 8.29%, with the most notable decrease affecting term deposits of 1-6 months. Deposit rates were reduced due to ample rupiah liquidity. Meanwhile, lending rates were maintained in line with escalating credit risk against a backdrop of economic moderation. The weighted average lending rate was down by just 2 bps to 12.96%, primarily affecting working capital credit and investment credit. On the other hand, consumer loan rates continued to rise (Graph 2.26). In May 2015, rates on working capital credit and investment credit were down respectively by 3 bps and 2 bps, while the rate on consumer loans rose 3 bps. Stable lending rate and lower deposit rate precipitated a wider interest rate spread, expanding from 459 bps to 467 bps (Graph 2.27).
Graph 2.26. Loan Rates Graph 2.27. Bank Interest Rates Spread
Growth of liquidity in the economy (M2) decelerated compared to the previous period. In May 2015, the position of M2 was Rp4,287.7 trillion, growing 13.4% (yoy) in comparison to 14.9% (yoy) in April. By component, weaker M2 growth stemmed from both M1 (currency and rupiah checking accounts) as well as quasi money (third-party deposits consisting of term deposits and savings denominated in rupiah and a foreign currency as well as foreign currency checking accounts) (Graph 2.28). Slower M1 and quasi money growth was linked to the prospect of economic moderation, achieving 8.2% (yoy) and 15.1% (yoy) respectively, down from 9.0% (yoy) and 16.7% (yoy) in the preceding period (Graph 2.29).

| 14
Graph 2.28. Growth of M2 and Its Components
Graph 2.29. Growth of M1 and Its Components
Based on its determinants, slower M2 growth was attributable to contractive central government financial operations. In May 2015, central government financial operations contracted, as evidenced by a decline in net receivables to the central government from 32.9% (yoy) to 25.5% (yoy) (Graph 2.30), in line with an increase in national tax revenues. On the other hand, government spending was yet to increase significantly. Meanwhile, credit disbursed by the banking sector totalled Rp3,792.8 trillion, equivalent to 10.3% (yoy)1, which is relatively stable on the previous period.
Graph 2.30. Growth of M2 and
Its Contributing Factors
The Banking Industry
Financial system stability was maintained with support from a resilient banking system. Credit, liquidity and market risks were well mitigated. Furthermore, a robust Capital Adequacy Ratio (CAR) helped bolster the banking industry.
Growth of credit activity was still restrained during May in line with economic moderation. Credit growth achieved 10.40% (yoy) in May 2015, down slightly on the 10.42% (yoy) posted in April2. Investment credit and consumer loans grew respectively by 11.11% (yoy) and 9.71% (yoy), not as strong as the previous period when 11.21% (yoy)
1 Credit growth of 10.3% (yoy) in May 2015 was calculated based on the monetary concept, namely rupiah and foreign currency loans extended by commercial and rural banks (excluding bank branches operating internationally) to residents (excluding the central government). In contrast, credit growth according to the banking concept achieved 10.40% (yoy) in the same period. Pursuant to the banking concept, credit includes rupiah and foreign currency loans disbursed by commercial banks (including those operating internationally) to residents (including the central government) and non-residents. 2 Calculated based on the banking concept.

| 15
and 11.93% (yoy) were recorded. Conversely, working capital credit growth accelerated from 9.14% (yoy) to 10.44% (yoy) (Graph 2.31).
Credit growth slowed in a number of economic sectors during May 2015. The growth of credit allocated to the Trade Sector and Agricultural Sector decelerated correspondingly to 10.1% (yoy) and 13.5% (yoy). In addition, credit extended to the Utilities Sector and Transportation Sector contracted. By contrast, credit growth to the Mining, Manufacturing, Construction, Social Services and Corporate Services sectors expanded respectively to 16.2% (yoy), 16.7% (yoy), 28.1% (yoy), 19.3% (yoy) and 3.8% (yoy) in May 2015, signalling that the credit slowdown is coming to an end (Graph 2.32).
Graph 2.31. Credit Growth Graph 2.32. Sectoral Credit Growth
Deposit growth slowed in May 2015. Bank deposit grew by 12.45% (yoy), decelerating from the previous period. The slowdown was affecting term deposits and checking accounts, while savings accounts posted increase in growth. Term deposits and demand deposits grew respectively at 19.5% (yoy) and 10.0% (yoy), while savings accounts achieved 3.8% (yoy) compared to 3.3% (yoy) previously (Graph 2.33).
Graph 2.33. Deposit Growth
The banking industry remained resilient against a backdrop of limited economic growth, supported by mitigated credit risk and a robust Capital Adequacy Ratio (CAR). The Capital Adequacy Ratio (CAR) remained high in May 2015, namely at 20.28%, well above the minimum 8% threshold and reflecting tenacious banking sector resilience to economic shocks and distress. Meanwhile, non-performing loans (NPL) remained low and stable at around 2.60% (yoy) (Table 2.3).

| 16
Table 2.3. Banking Indicators
The Stock Market and Government Securities Market
The domestic stock market slumped on external sentiment in June 2015. The IDX Composite slid 306 points (-5.86%) to a level of 4,910.66 at the end of June (Graph 2.34). External sentiment stemmed from growing expectations of a Fed Funds Rate (FFR) hike combined with the ongoing Greek debt crisis, which exacerbated global concerns and triggered non-resident investors to sell. Domestically, inflation in May 2015 exceeded market expectations and spurred expectations of higher inflation in June, thereby prompting profit-taking amongst domestic investors.
The majority of global and regional stock exchanges experienced corrections due to external sentiment. The IDX Composite experienced a -5.86% correction, the highest in the region (compared to Vietnam, the Philippines, Thailand, Malaysia and Singapore). Other bourses in the region experienced a correction of between -0.2% and -5.9%.
Share prices in all economic sectors experienced price corrections. The most notable correction occurred in the agricultural sector (12.3%), followed by the manufacturing industry (9.3%) as well as the consumption sector and financial sector that declined respectively by 7.7% apiece (Graph 2.35).
Graph 2.34. IDX Composite and Global Stock Index
Graph 2.35. Sectoral Index June 2015
During June 2015, non-resident investors booked net sell on negative external sentiment coupled with minimal positive domestic sentiment. Non-resident investors booked net sell of Rp4.09 trillion in June 2015, up from Rp3.46 trillion (Figure 2.36), due

| 17
to growing expectations of a Fed Funds Rate hike this year along with mounting investor concerns over the Greek bailout. The resultant uncertainty triggered global concerns that prompted selling pressures, primarily amongst non-resident investors on the stock market. Furthermore, minimal positive sentiment at home exacerbated selling pressures and relatively high inflation in May pushed up expectations for June. Depreciatory pressures on the rupiah also drove sentiment together with concerns over economic moderation. Up to June 2015, the position of non-resident shareholdings represented 44.5% of the total compared to 45.3% a month earlier (Graph 2.37).
Congruous with stock market performance, the tradeable government securities (SBN) market also slumped, with yields of all tenors increasing. The bond market also declined due to external sentiment, which undermined the IDX Composite. External sentiment increased the perception of risk that led to higher yields on the bond market. Domestic investors also perceived higher inflation expectations to return in June and exchange rate pressures to persist. In June 2015, SBN yield jumped 12 bps from 8.10% to 8.22%. Short, medium and long-term yields increased 7 bps, 17 bps and 7 bps respectively to 7.84%, 8.31% and 8.54% (Graph 2.36).
Non-resident investors purchased tradeable government securities (SBN) on rising yields. Non-resident investors booked net purchases totalling Rp23.04 trillion, up significantly from Rp6.31 trillion in the previous month (Graph 2.38). Foreign investors exploited rising yields, with SBN prices already considered low and yields offering high returns. Foreign SBN holdings expanded primarily of medium and long-term tenors, increasing Rp14.5 trillion and Rp16.43 trillion respectively from the beginning of June. Conversely, short-tenor bonds experienced a Rp2.24 trillion decline (Graph 2.39).
Graph 2.36. IDX Composite Performance and Net Foreign Buy/Sell
Graph 2.37. Position of Non-resident Shareholdings
Graph 2.38. Government Bonds Yield and Net Foreign Buy/Sell (Monthly)
Graph 2.39. Foreign SBN Holdings

| 18
Nonbank Financing
Nonbank economic financing was noted to increase on the previous period. In June 2015, total financing through initial public offerings (IPO), rights issues, corporate bonds, medium-term notes (MTN), promissory notes and other financial instruments amounted to Rp16.5 trillion, exceeding the Rp11.7 trillion reported in May. By component, issuances of bonds followed by shares dominated nonbank financing (Table 2.5).
Table 2.5. Non-Bank Financing

| 19
MONETARY POLICY RESPONSES
The BI Board of Governors decided on 14th July 2015 to hold the BI Rate at 7.50%, while maintaining the Deposit Facility rate at 5.50% and the Lending Facility rate at 8.00%. The decision is congruent with efforts to control inflation within the target corridor of 4±1% in 2015 and 2016. The policy mix of Bank Indonesia is consistently directed towards maintaining macroeconomic stability, despite widespread global uncertainty, as well as preserving growth through accommodative macroprudential policy. Furthermore, Bank Indonesia constantly strengthens policy coordination with the government in terms of inflation control and expedites fiscal stimuli in order to catalyse economic growth. In addition, Bank Indonesia supports central and local government efforts to accelerate budget realisation, including infrastructure projects, while persevering with a variety of structural reforms as the key to a sounder domestic economic outlook.
3

| 20
The Monetary Policy Review (MPR) is published monthly by Bank Indonesia after the Board of Governors’ Meeting each January, March, April, June, July, September, October and December. This report is intended as a medium for the Board of Governors of Bank Indonesia to present to the public the latest evaluation of monetary conditions, assessment, and forecast for the Indonesian economy, in addition to the Bank Indonesia monetary policy response published quarterly in the Monetary Policy Report in April, July, October, and December. Specifically, the MPR presents an evaluation of the latest developments in inflation, the exchange rate, and monetary conditions during the reporting month and decisions concerning the monetary policy response adopted by Bank Indonesia.
For further information:Policy Regulation and Communication Division Monetary Policy Group Monetary Policy and Economic Policy Department Telp: +62 21 2981 6836/5726 Fax: +62 21 345 2489 Email: [email protected] Website: http//www.bi.go.id
The Board of Govenors: Agus D.W. Martowardojo – Governor Mirza Adityaswara – Senior Deputy Governor Ronald Waas – Deputy Governor Perry Warjiyo – Deputy Governor Hendar – Deputy Governor Erwin Rijanto – Deputy Governor


