1 Observations on the scaling of the streamwise velocity component in wall turbulence Jonathan Morrison Beverley McKeon Dept. Aeronautics, Imperial College Perry Symposium, Kingston May 2004 Perry Symposium, Kingston May 2004
Transcript
1
Observations on the scaling of the streamwise velocity component in
wall turbulence
Jonathan Morrison
Beverley McKeon
Dept. Aeronautics, Imperial College
Perry Symposium, Kingston May 2004Perry Symposium, Kingston May 2004
2
Synopsis• Self-similarity – what should we be looking for?• Log law: self-similar scaling - • Local-equilibrium approximation as a self-similar
energy balance in physical space.• Spatial transport – interaction between inner and
outer regions.• Self-similarity of energy balance appears as inertial
subrange in spectral space.• Consistent physical- and spectral- space views.• Self-similarity as a pre-requisite for universality.
uy,
3
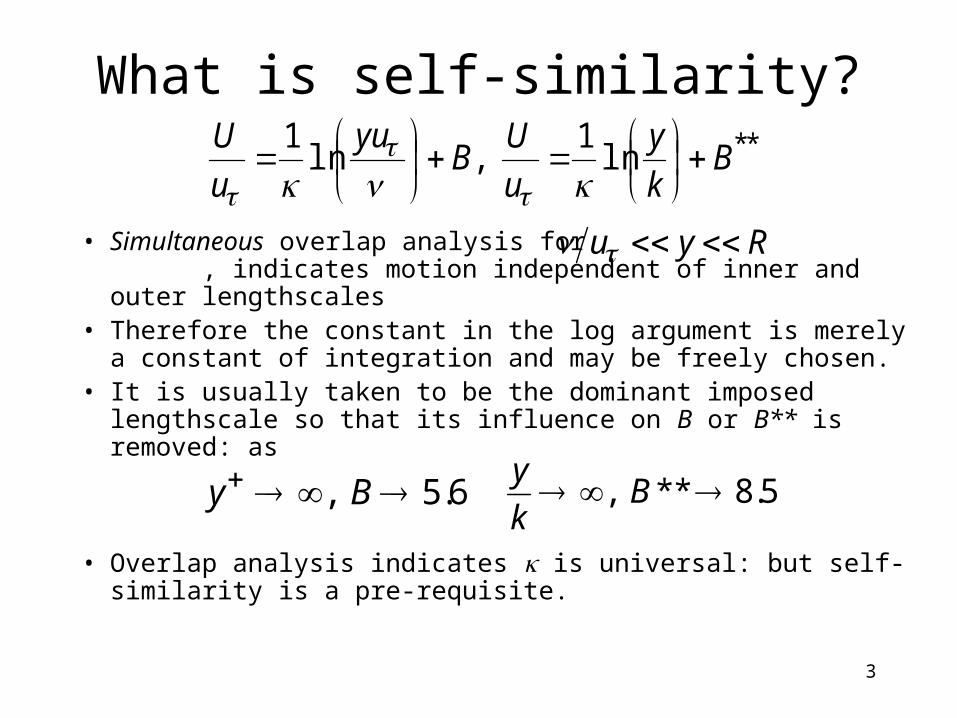
What is self-similarity?
• Simultaneous overlap analysis for , indicates motion independent of inner and outer lengthscales
• Therefore the constant in the log argument is merely a constant of integration and may be freely chosen.
• It is usually taken to be the dominant imposed lengthscale so that its influence on B or B** is removed: as
• Overlap analysis indicates is universal: but self-similarity is a pre-requisite.
6.5, By
**ln1
,ln1
Bk
y
u
UB
yu
u
U
5.8**, Bk
y
Ryu
4
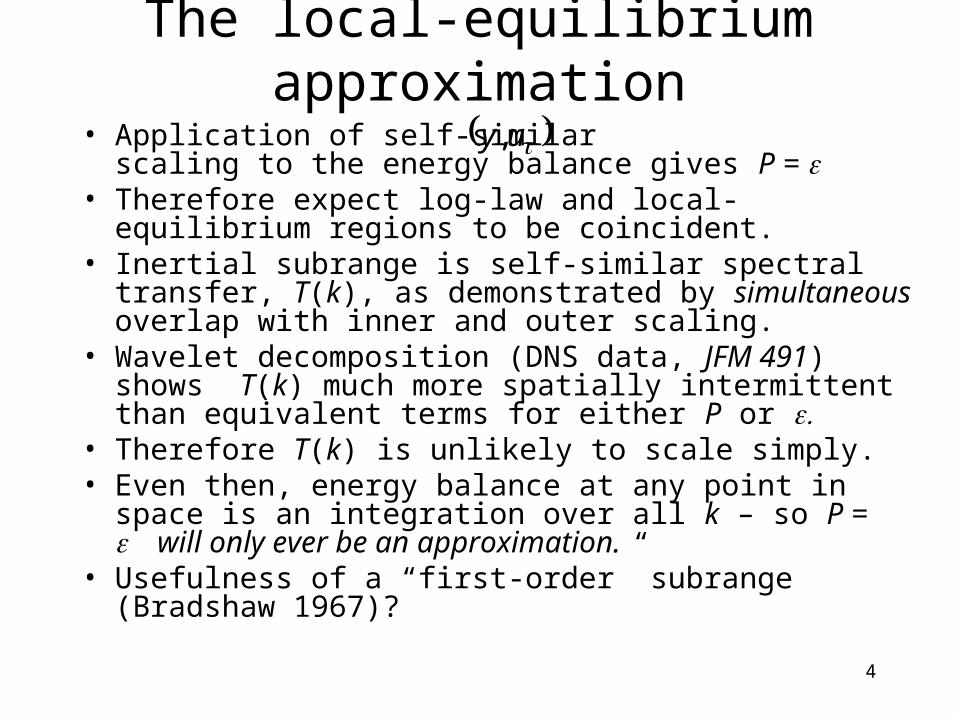
The local-equilibrium approximation
• Application of self-similar scaling to the energy balance gives P =
• Therefore expect log-law and local-equilibrium regions to be coincident.
• Inertial subrange is self-similar spectral transfer, T(k), as demonstrated by simultaneous overlap with inner and outer scaling.
• Wavelet decomposition (DNS data, JFM 491) shows T(k) much more spatially intermittent than equivalent terms for either P or
• Therefore T(k) is unlikely to scale simply.• Even then, energy balance at any point in space is an
integration over all k – so P = will only ever be an approximation.
• Usefulness of a “first-order” subrange (Bradshaw 1967)?
uy,
5
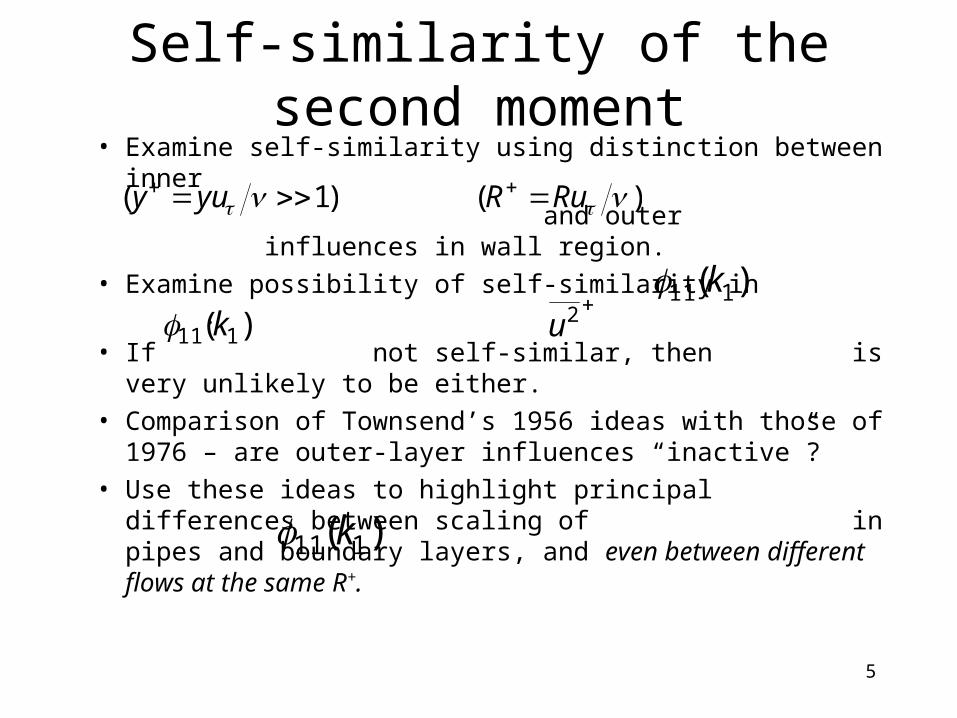
Self-similarity of the second moment• Examine self-similarity using distinction between inner
and outer influences in wall region.
• Examine possibility of self-similarity in .
• If not self-similar, then is very unlikely to be either.
• Comparison of Townsend’s 1956 ideas with those of 1976 – are outer-layer influences “inactive”?
• Use these ideas to highlight principal differences between scaling of in pipes and boundary layers, and even between different flows at the same R+.
)( 111 k)( 111 k
)1( yuy
)( 111 k
2u
)( RuR
6
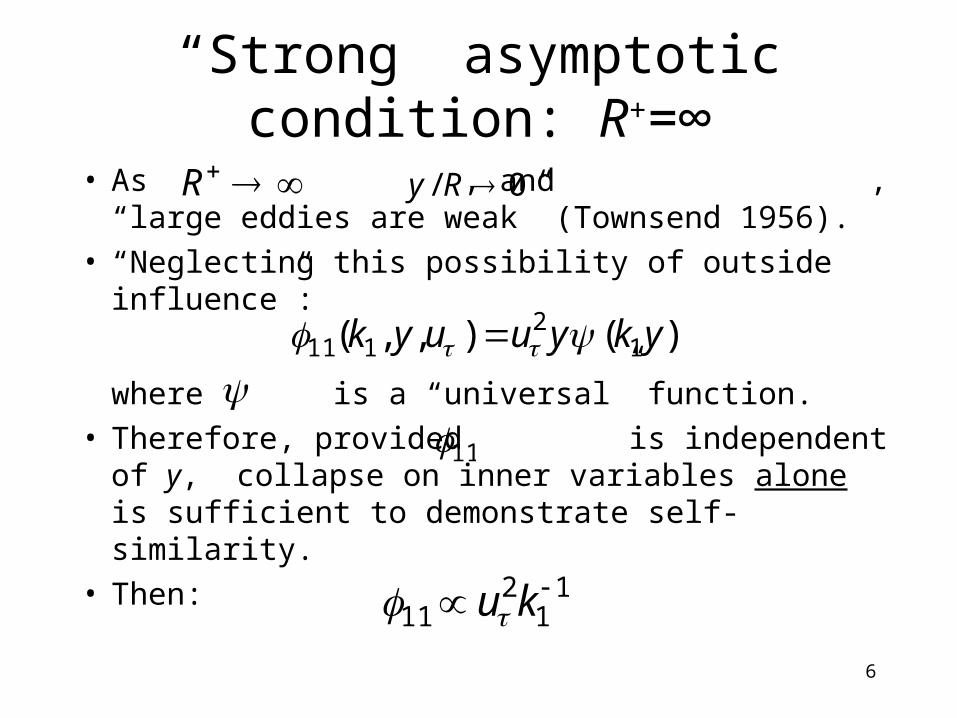
“Strong” asymptotic condition: R+=∞
• As , and , “large eddies are weak” (Townsend 1956).
• “Neglecting this possibility of outside influence”:
where is a “universal” function.• Therefore, provided is independent of y,
collapse on inner variables alone is sufficient to demonstrate self-similarity.
• Then:
R 0/ Ry
)(),,( 12
111 ykyuuyk
11
211
ku
11
7
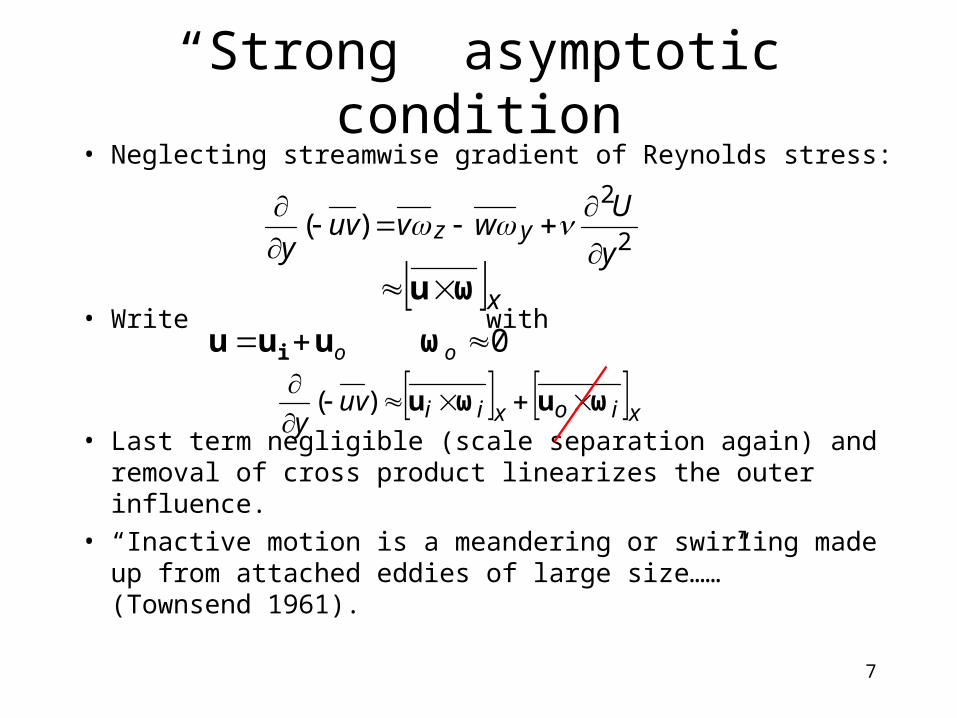
“Strong” asymptotic condition• Neglecting streamwise gradient of Reynolds stress:
• Write with
• Last term negligible (scale separation again) and removal of cross product linearizes the outer influence.
• “Inactive motion is a meandering or swirling made up from attached eddies of large size……” (Townsend 1961).
ouuu i
2
2)(
y
Uwvuv
yyz
xωu
0oω
xioxiiuvy
ωuωu
)(
8
Conclusions from“strong” asymptotic condition
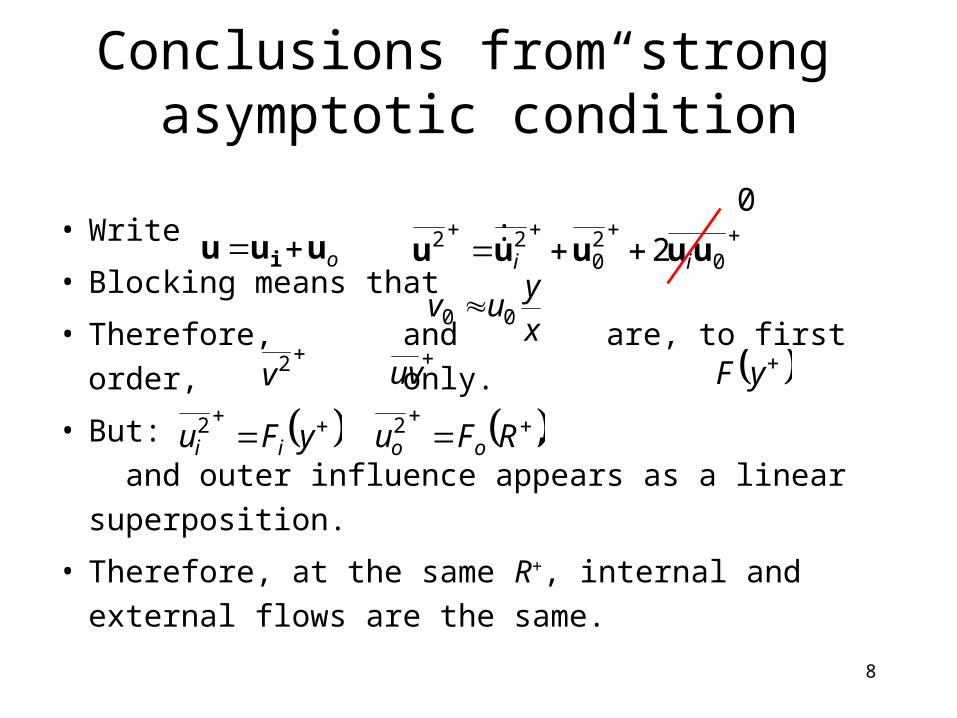
• Write :
• Blocking means that
• Therefore, and are, to first order, only.
• But: , and outer influence
appears as a linear superposition.
• Therefore, at the same R+, internal and external flows
are the same.
ouuu i
uv
2v yF
0
20
22 2 uuuuu ii
xy
uv 00
yFu ii
2 RFu oo
2
0
9
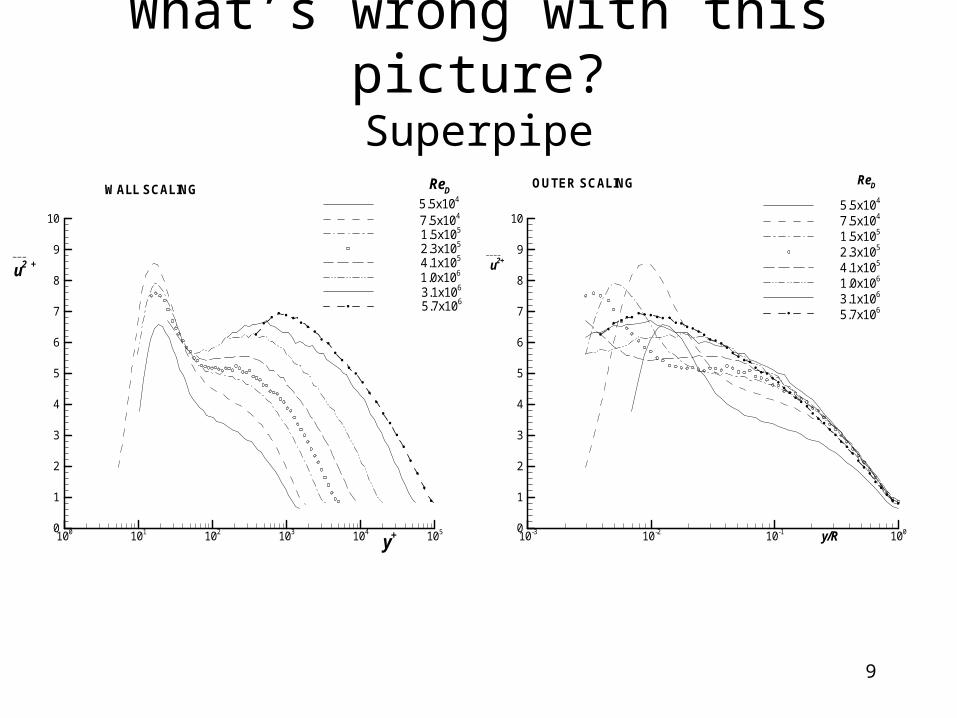
What’s wrong with this picture?Superpipe
100 101 102 103 104 1050
1
2
3
4
5
6
7
8
9
10
ReD
y+
___
u2 +
5.5x10⁴
7.5x10⁴
1.5x10⁵
2.3x10⁵
4.1x10⁵
1.0x10⁶
3.1x10⁶
5.7x10⁶
WALL SCALING
10-3 10-2 10-1 1000
1
2
3
4
5
6
7
8
9
10
____
u2+
y/R
ReD
5.5x10⁴
7.5x10⁴
1.5x10⁵
2.3x10⁵
4.1x10⁵
1.0x10⁶
3.1x10⁶
5.7x10⁶
OUTER SCALING
10
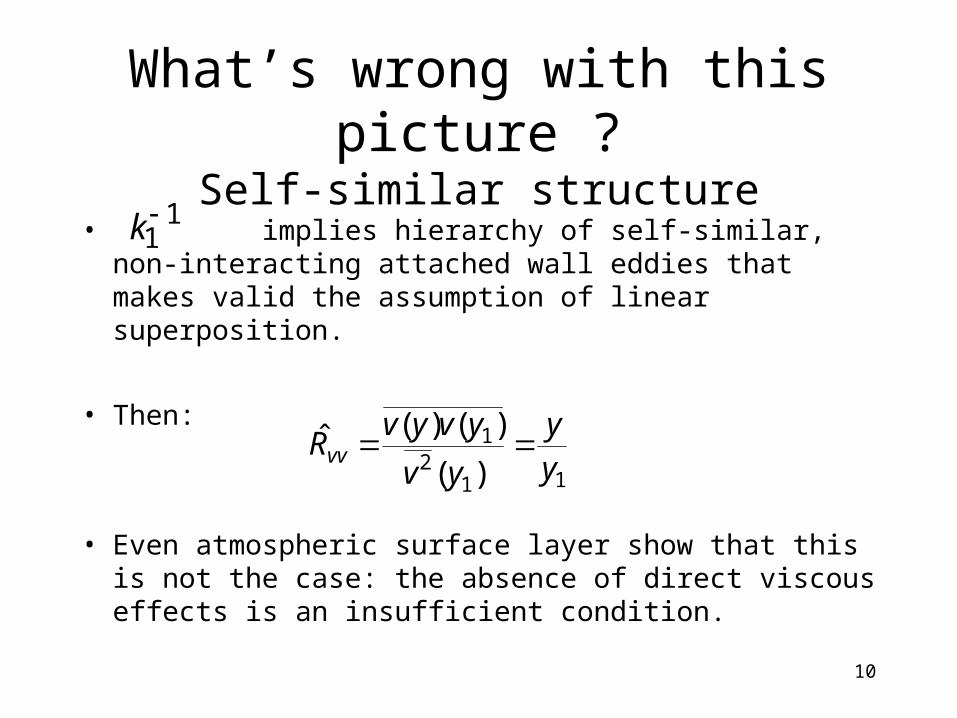
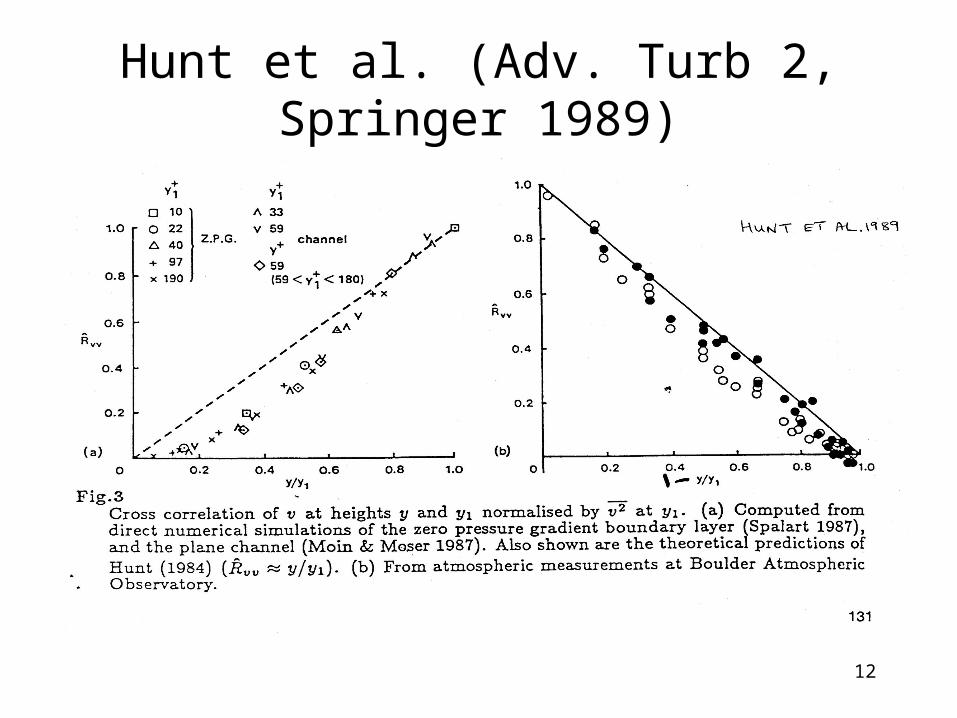
What’s wrong with this picture ?Self-similar structure
• implies hierarchy of self-similar, non-interacting attached wall eddies that makes valid the assumption of linear superposition.
• Then:
• Even atmospheric surface layer show that this is not the case: the absence of direct viscous effects is an insufficient condition.
112
1
)(
)()(ˆyy
yv
yvyvRvv
11k
11
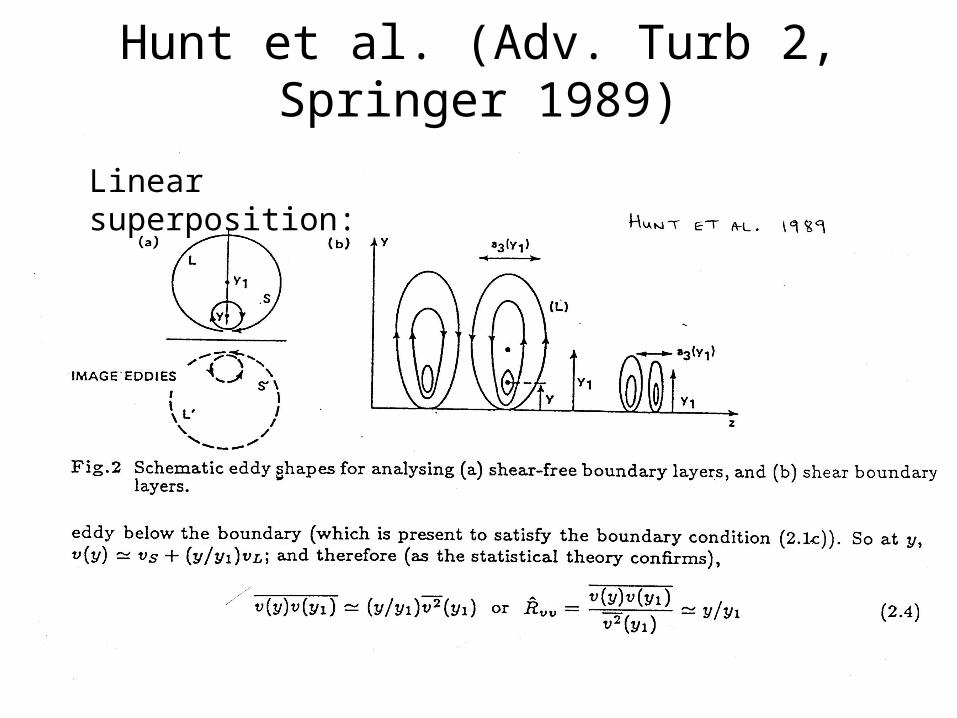
Hunt et al. (Adv. Turb 2, Springer 1989)
Linear superposition:
12
Hunt et al. (Adv. Turb 2, Springer 1989)
13
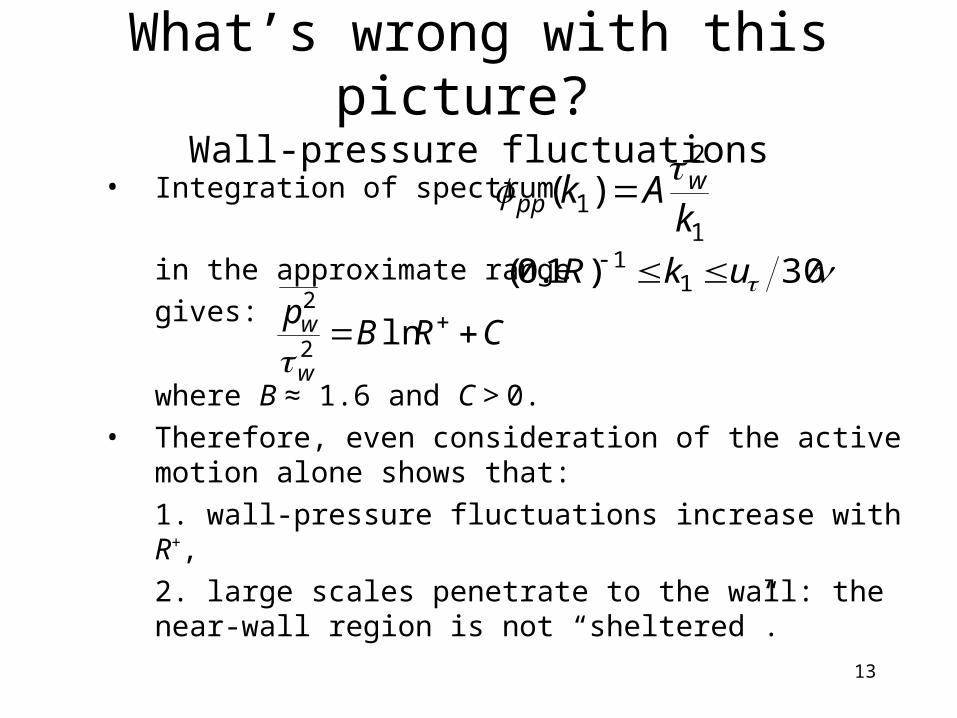
What’s wrong with this picture? Wall-pressure fluctuations
• Integration of spectrum
in the approximate range
gives:
where B ≈ 1.6 and C > 0.
• Therefore, even consideration of the active motion alone shows that:
1. wall-pressure fluctuations increase with R+,
2. large scales penetrate to the wall: the near-wall region is not “sheltered”.
1
2
1)(k
Ak wpp
30)1.0( 11 ukR
CRBp
w
w ln2
2
14
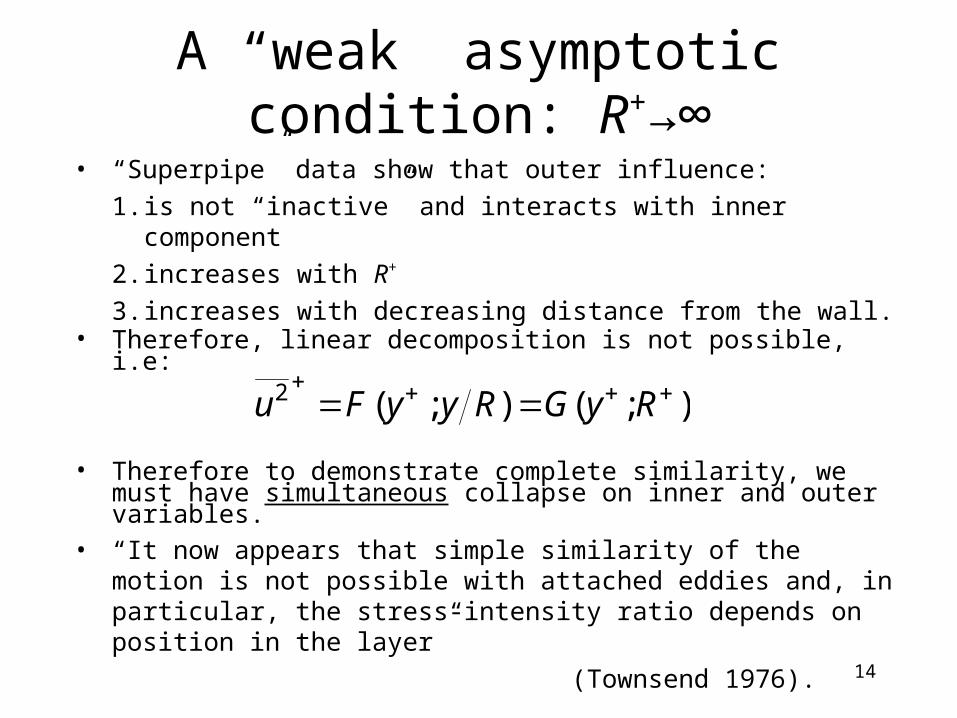
A “weak” asymptotic condition: R+→∞
• “Superpipe” data show that outer influence:
1. is not “inactive” and interacts with inner component
2. increases with R+
3. increases with decreasing distance from the wall.• Therefore, linear decomposition is not possible, i.e:
• Therefore to demonstrate complete similarity, we must have simultaneous collapse on inner and outer variables.
• “It now appears that simple similarity of the motion is not possible with attached eddies and, in particular, the stress-intensity ratio depends on position in the layer”
(Townsend 1976).
);();(2 RyGRyyFu
15
Superpipe spectra
10-1 100 101 102 103 1040
0.5
1
1.5
k1R
k1R (k1R)
u2
ReD=3.1M, R+=5.4x10⁴
ReD=5.7M, R+=1.0x10⁵
y/R y+
0.030 1.6x10³
0.051 2.7x10³
0.096 5.2x10³
0.030 3.0x10³
0.051 5.1x10³
0.096 9.6x10³
_________
- - - - -
10-3 10-2 10-1 100 101 102 1030
0.5
1
1.5
k1y
k1y (k1y)
u2
ReD=3.1M, R+=5.4x10⁴
ReD=5.7M, R+=1.0x10⁵
y/R y+
0.030 1.6x10³
0.051 2.7x10³
0.096 5.2x10³
0.030 3.0x10³
0.051 5.1x10³
0.096 9.6x10³
16
Laban’s Mills surface layer (Högström)
10-1 100 101 102 103 1040
0.5
1
1.5
2
3.1m
6.3m
"Sorbus" - Outer Scaling
8 hours sampling
z0=1.2 cm
500 m
k1
k1 (k1 )
u2
10-3 10-2 10-1 100 101 1020
0.5
1
1.5
2
3.1m
6.3m
"Sorbus" - Inner Scaling
8 hours sampling
z0=1.2 cm
500 m
k1y
k1y (k1 y )
u2
17
Observations
• Both the “strong” and “weak” asymptotic conditions lead to complete similarity.
• spectra in both the “superpipe” and the atmospheric surface layer show only incomplete similarity. In both cases, R+ is too low to show complete similarity.
• As the Reynolds number increases, the receding influence of direct viscous effects has to be distinguished from the increasing influence of outer-layer effects, because the inner/outer interaction is non-linear:
)( 111 k
);(2 RyyFu
18
Nature of the inner-outer interaction
• Streamwise momentum:
• The mesolayer defined by
• Balance of viscous and inertial forces gives length scale
• The energy balance in the mesolayer involves turbulent and
viscous transport, as well as production and dissipation.
• Since , a mesolayer exists at any R+.
• The lower limit to the log law should be expected to increase
approximately as .
21 Rm
Uwvuvy
yz2)(
0)(
uvy
RR 2
11
21
R
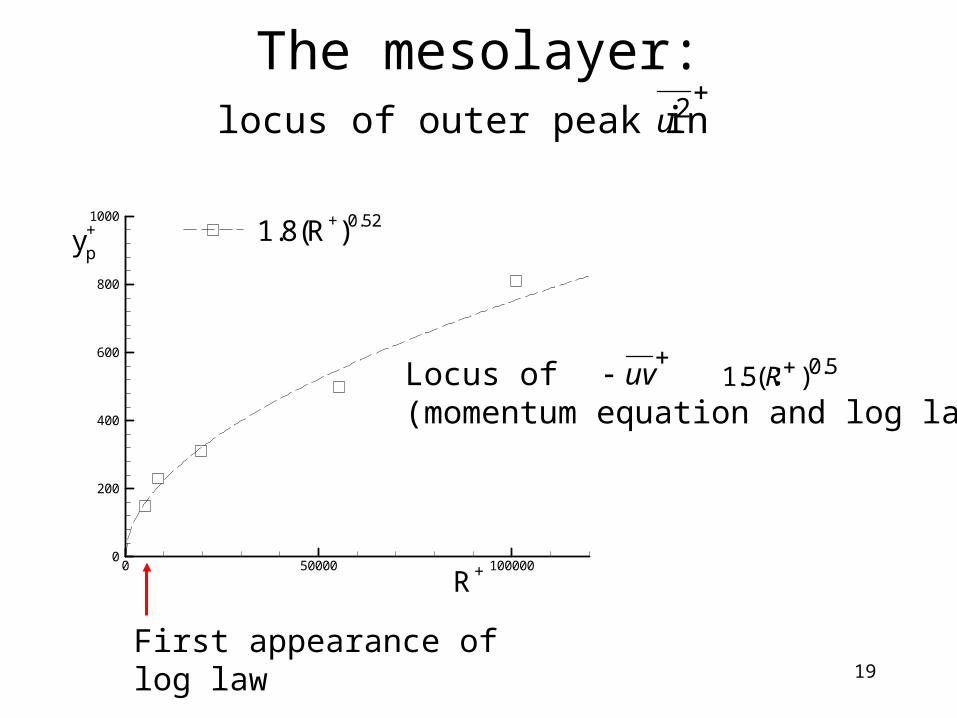
19
The mesolayer:locus of outer peak in
0 50000 1000000
200
400
600
800
1000
yp+
R+
1.8(R+)0.52
uv 5.0)(5.1 RLocus of :
(momentum equation and log law)
First appearance of log law
2u
20
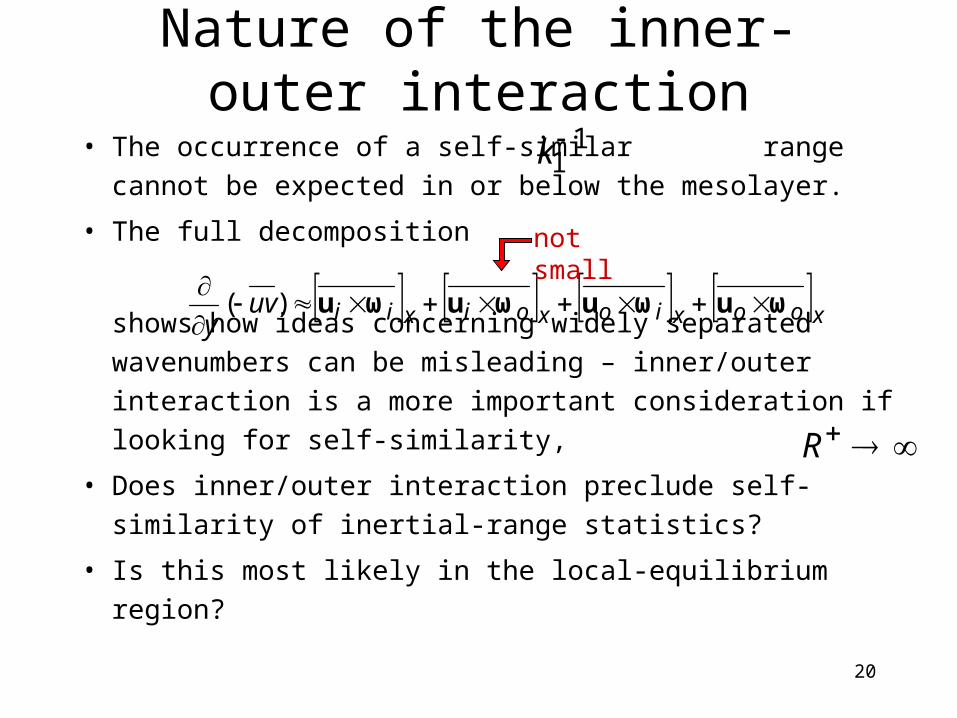
Nature of the inner-outer interaction
• The occurrence of a self-similar range cannot be
expected in or below the mesolayer.
• The full decomposition
shows how ideas concerning widely separated wavenumbers
can be misleading – inner/outer interaction is a more
important consideration if looking for self-similarity,
• Does inner/outer interaction preclude self-similarity of
inertial-range statistics?
• Is this most likely in the local-equilibrium region?
11k
xooxioxoixiiuvy
ωuωuωuωu
)(
not small
R
21
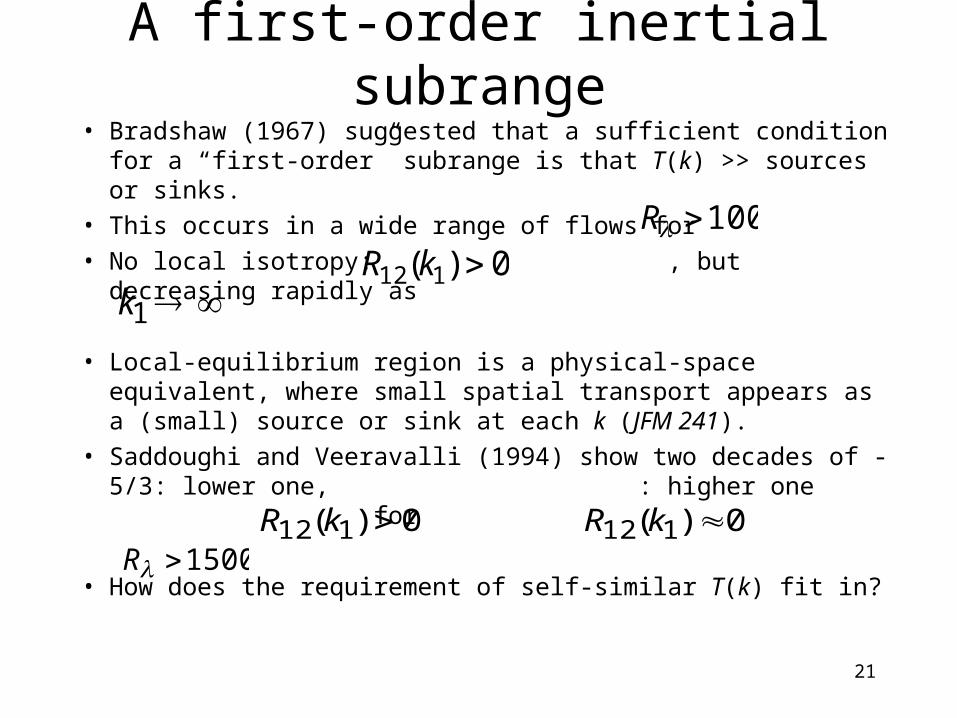
A first-order inertial subrange• Bradshaw (1967) suggested that a sufficient condition for a
“first-order” subrange is that T(k) >> sources or sinks.
• This occurs in a wide range of flows for
• No local isotropy: , but decreasing rapidly as
• Local-equilibrium region is a physical-space equivalent, where small spatial transport appears as a (small) source or sink at each k (JFM 241).
• Saddoughi and Veeravalli (1994) show two decades of -5/3: lower one, : higher one for
• How does the requirement of self-similar T(k) fit in?
100R
0)( 112 kR1k
0)( 112 kR1500R
0)( 112 kR
22
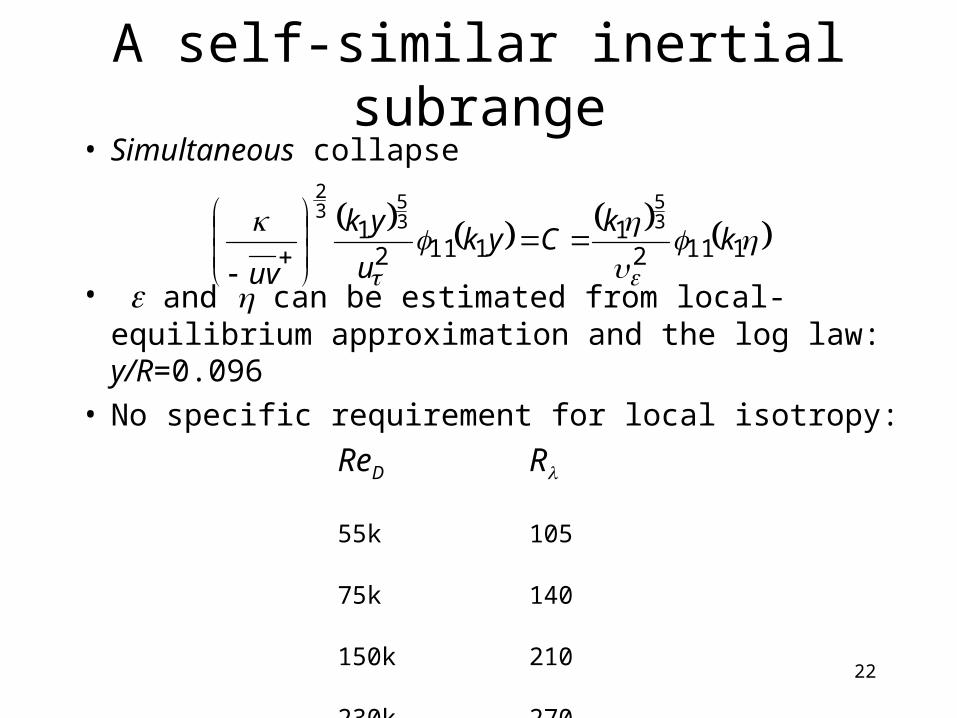
A self-similar inertial subrange• Simultaneous collapse
• and can be estimated from local-equilibrium approximation and the log law: y/R=0.096
• No specific requirement for local isotropy:
1112
11112
1 35
353
2
kk
Cyku
yk
uv
ReD R
55k 105
75k 140
150k 210
230k 270
1.0m 575
23
Inertial subrange scaling: u
outer scale
10-2 10-1 100 101 102 1030
0.1
0.2
0.3
0.4
0.5
0.6
ky 10-4 10-3 10-2 10-1 100 1010
0.1
0.2
0.3
0.4
0.5
0.655k75k150k230k1.02m
k
1562 y4 kHz
24
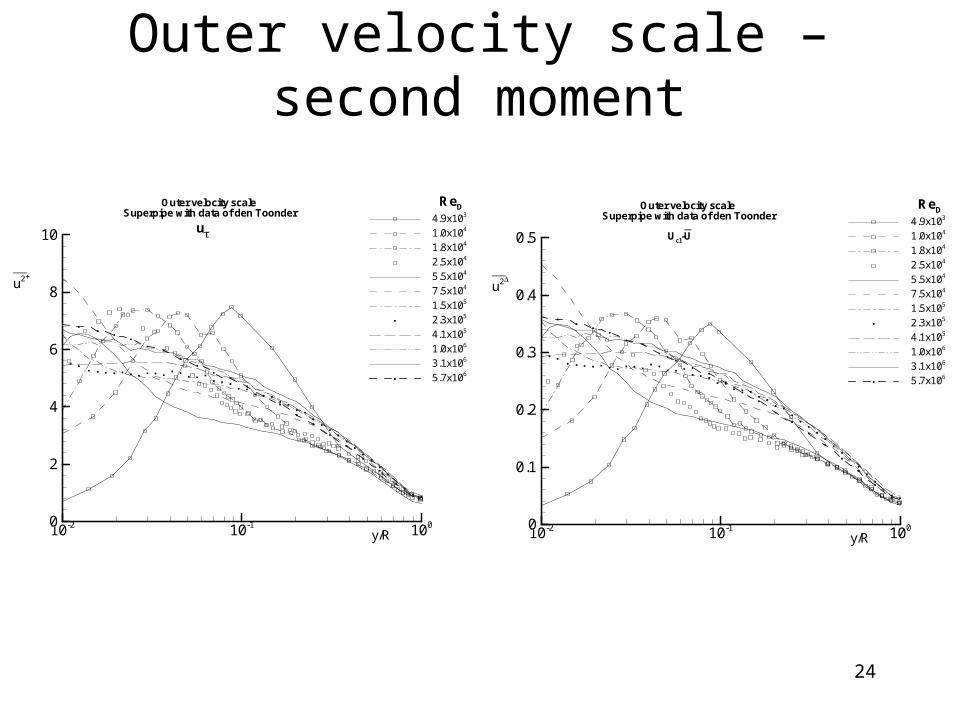
Outer velocity scale – second moment
10-2 10-1 1000
2
4
6
8
10
ReD
y/R
___
u2
4.9x10³
1.0x10⁴
1.8x10⁴
2.5x10⁴
5.5x10⁴
7.5x10⁴
1.5x10⁵
2.3x10⁵
4.1x10⁵
1.0x10⁶
3.1x10⁶
5.7x10⁶
Outer velocity scaleSuperpipe with data of den Toonder
u
10-2 10-1 1000
0.1
0.2
0.3
0.4
0.5
ReD
y/R
___
u2
4.9x10³
1.0x10⁴
1.8x10⁴
2.5x10⁴
5.5x10⁴
7.5x10⁴
1.5x10⁵
2.3x10⁵
4.1x10⁵
1.0x10⁶
3.1x10⁶
5.7x10⁶
Outer velocity scaleSuperpipe with data of den Toonder
Ucl-U__
25
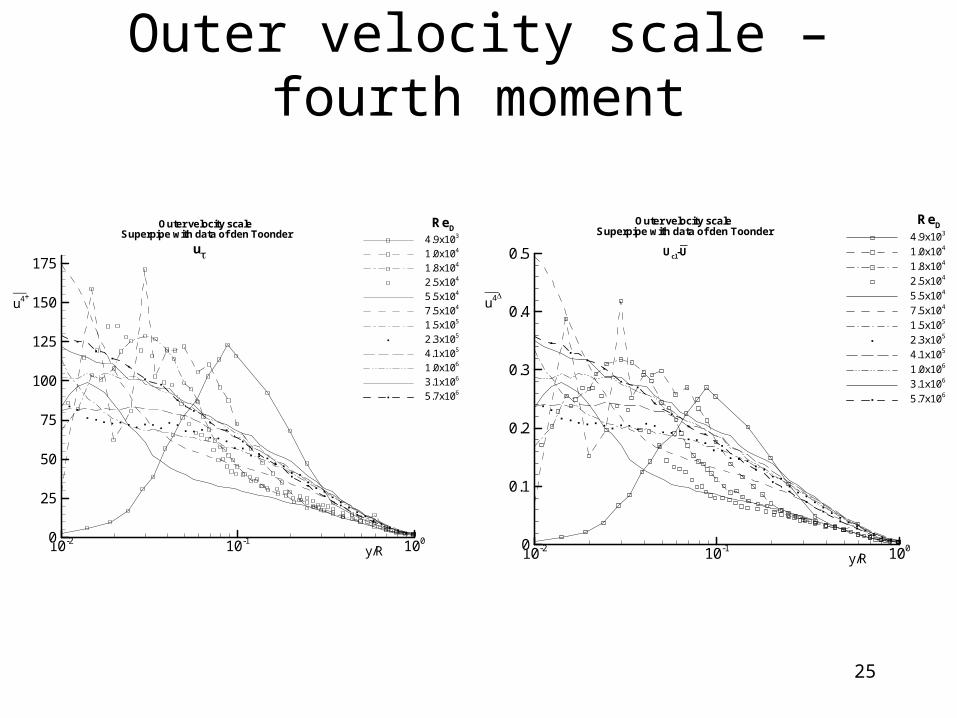
Outer velocity scale – fourth moment
10-2 10-1 1000
25
50
75
100
125
150
175
ReD
y/R
___
u4
4.9x10³
1.0x10⁴
1.8x10⁴
2.5x10⁴
5.5x10⁴
7.5x10⁴
1.5x10⁵
2.3x10⁵
4.1x10⁵
1.0x10⁶
3.1x10⁶
5.7x10⁶
Outer velocity scaleSuperpipe with data of den Toonder
u
10-2 10-1 1000
0.1
0.2
0.3
0.4
0.5
ReD
y/R
___
u4
4.9x10³
1.0x10⁴
1.8x10⁴
2.5x10⁴
5.5x10⁴
7.5x10⁴
1.5x10⁵
2.3x10⁵
4.1x10⁵
1.0x10⁶
3.1x10⁶
5.7x10⁶
Outer velocity scaleSuperpipe with data of den Toonder
Ucl-U__
26
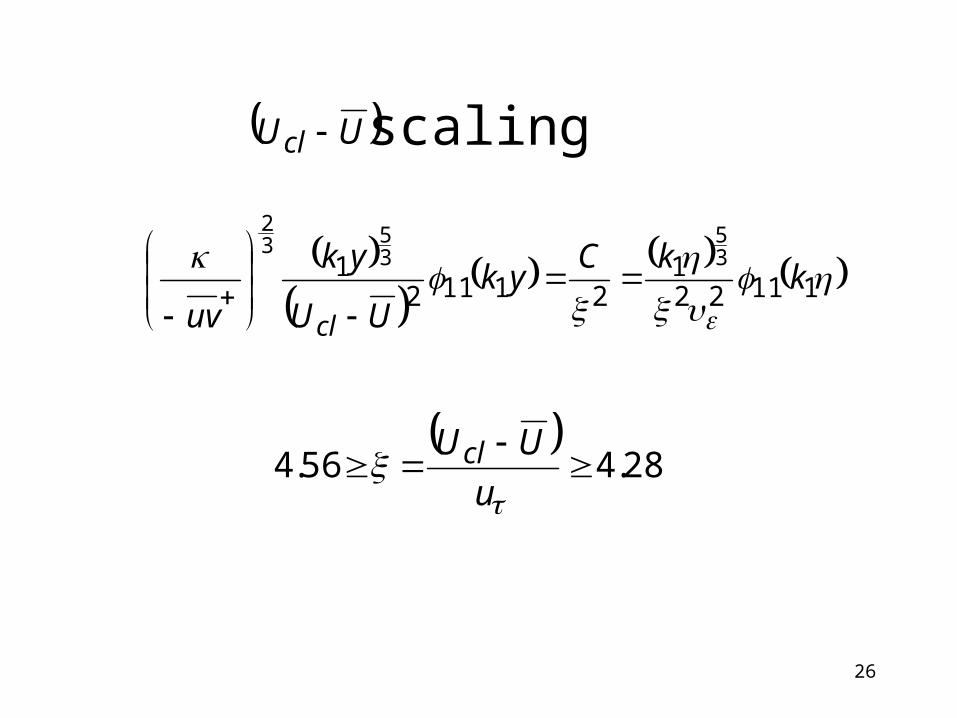
scaling
11122
121112
1 35
353
2
kkC
ykUU
yk
uv cl
UUcl
28.456.4
u
UUcl
27
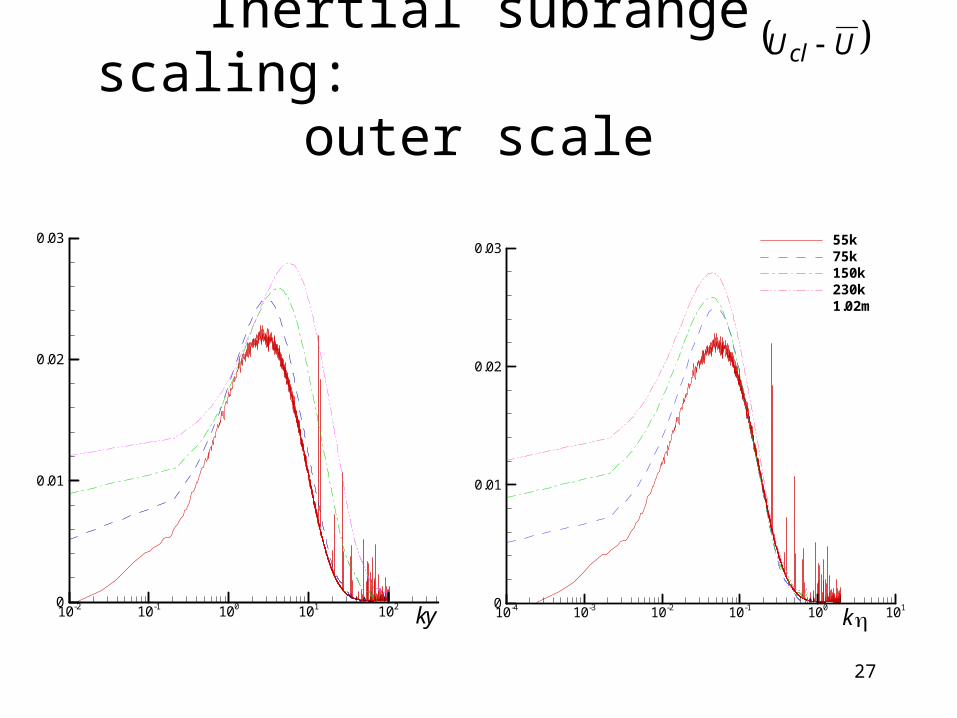
Inertial subrange scaling: outer scale
10-2 10-1 100 101 102 1030
0.01
0.02
0.03
ky
UUcl
10-4 10-3 10-2 10-1 100 1010
0.01
0.02
0.0355k75k150k230k1.02m
k
28
Conclusions - I
• Statistics in boundary layers at short fetch and high velocity will not be the same as those at long fetch and low velocity.
• and in pipes and boundary layers at the same R+ are not the same.
• “fully-developed pipe flow” does not appear to be a universal condition.
• But, self-similarity does lead to universal properties (log law, inertial subrange?), but R+=constant does not.
)( 111 k2u
29
Conclusions - II
• Inner/outer interaction dominates: “top-down” influence increases with increasing R+, and decreasing y/R.
• Mesolayer determines lower limit to log region.
• is a better velocity scale for
• The pressure velocity scale is only a second-order correction:– at R+ = 5000, 7%.
21~ R
UUcl 31075Re D
31
2
R
up
pu
30
Conclusions III • In local-equilibrium region, self-similar inertial
subrange appears above• Departures from self-similarity: retain -5/3 scaling,
but relax condition = constant (Lumley 1964):
where .• Then, if • Need to look in outer region: larger spatial transport,