Page 1
1 of 15
Government of Pakistan Prime Minister’s Office
National Disaster Management Authority (NDMA) ISLAMABAD
SITUATION REPORT ON ANTI-LOCUST OPERATIONS - 83
(UPTO 08 MAY 2020)
1. Locust Threat. As per FAO Desert Locust Situation Update dated 08 May 2020 (Annexure A), the
current situation continues to represent an unprecedented threat to food security and livelihoods in East
Africa. In addition, the Indo-Pakistan border area, Sudan, and perhaps the Sahel of West Africa face an
impending invasion from spring breeding areas. In Iran, hopper bands persist on the southwest coast and
near the Strait of Hormuz. Adult groups have laid eggs in Sistan - Baluchistan where surveys should be
intensified to detect hatching and band formation. In Pakistan, hopper and adult groups persist in
Baluchistan, adult groups have formed in the Indus Valley, and hopper groups and bands are present in
Punjab. Hopper groups, bands, and adult groups are present on the Indo-Pakistan border in Punjab of both
countries. Migration from the spring breeding areas in Baluchistan has commenced, and several immature
adult groups and swarms have appeared since 2 May in Rajasthan, India. Control operations continue in all
three countries. Increased monitoring and reporting are required in desert areas along both sides of
the Indo-Pakistan border.
2. Overall Situation. Anti-Locust Survey and Control Operation in collaboration with all relevant
stakeholders is in progress, with presence of Locust in following districts / areas:-
Serial Province Prone
Districts
Reported Presence in
Districts (24 Hours)
Remaining
Districts
Reported Presence in
Districts
(24 Hours)
a. Balochistan 11 10
(Khuzdar, Awaran, Nushki,
Chaghi, Gawadar, Kech,
Panjgur, Kharan, Washuk,
Quetta)
22 15
(Barkhan, Dera Bughti,
Duki, Harnai, Jhal
Magsi, Bolan, Kalat,
Kohlu, Mastung,
Naseerabad, Pishin,
Sibi, Sohbat Pur, Zohb,
Ziarat)
c. KP 14 5
(Tank, South Waziristan,
North Waziristan, Lakki
Marwat, Karak)
20 3
(Nowshera, Orakzai,
Khyber)
b. Punjab 13 6
(Bhakkar, Khushab,
Layyah, Jhang, Mianwali,
Okara)
23 2
(Attock, Chakwal)
d. Sindh 8 2
(Khairpur, Tharparkar)
22 1
(Jamshoro)
e. Total 46 23 87 21
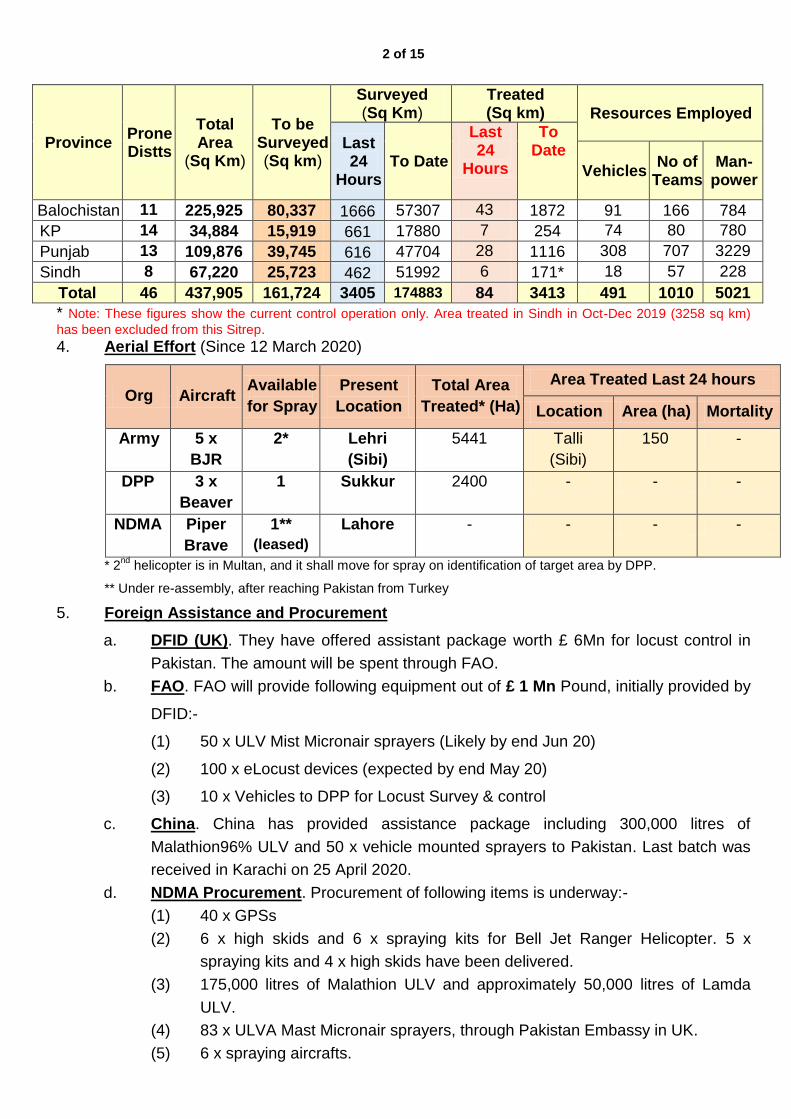
3. Summary - Survey & Control Operation. Province-wise update on survey and control in
prone districts during Stage-1 from 9 March to date as per NAP-DL-20 based on latest SUPARCO
Habitat Analysis is as under (District-wise detailed report for Survey at Annexure B and Control
at Annexure C):-
Page 2
2 of 15
Province Prone Distts
Total Area
(Sq Km)
To be Surveyed (Sq km)
Surveyed (Sq Km)
Treated (Sq km) Resources Employed
Last 24
Hours To Date
Last 24
Hours
To Date
Vehicles No of
Teams Man-
power
Balochistan 11 225,925 80,337 1666 57307 43 1872 91 166 784
KP 14 34,884 15,919 661 17880 7 254 74 80 780
Punjab 13 109,876 39,745 616 47704 28 1116 308 707 3229
Sindh 8 67,220 25,723 462 51992 6 171* 18 57 228
Total 46 437,905 161,724 3405 174883 84 3413 491 1010 5021
* Note: These figures show the current control operation only. Area treated in Sindh in Oct-Dec 2019 (3258 sq km)
has been excluded from this Sitrep.
4. Aerial Effort (Since 12 March 2020)
Org Aircraft Available
for Spray
Present
Location
Total Area
Treated* (Ha)
Area Treated Last 24 hours
Location Area (ha) Mortality
Army 5 x
BJR
2*
Lehri
(Sibi)
5441 Talli
(Sibi)
150 -
DPP 3 x
Beaver
1
Sukkur 2400 - - -
NDMA Piper
Brave
1**
(leased)
Lahore - - - -
* 2nd
helicopter is in Multan, and it shall move for spray on identification of target area by DPP.
** Under re-assembly, after reaching Pakistan from Turkey
5. Foreign Assistance and Procurement
a. DFID (UK). They have offered assistant package worth £ 6Mn for locust control in
Pakistan. The amount will be spent through FAO.
b. FAO. FAO will provide following equipment out of £ 1 Mn Pound, initially provided by
DFID:-
(1) 50 x ULV Mist Micronair sprayers (Likely by end Jun 20)
(2) 100 x eLocust devices (expected by end May 20)
(3) 10 x Vehicles to DPP for Locust Survey & control
c. China. China has provided assistance package including 300,000 litres of
Malathion96% ULV and 50 x vehicle mounted sprayers to Pakistan. Last batch was
received in Karachi on 25 April 2020.
d. NDMA Procurement. Procurement of following items is underway:-
(1) 40 x GPSs
(2) 6 x high skids and 6 x spraying kits for Bell Jet Ranger Helicopter. 5 x
spraying kits and 4 x high skids have been delivered.
(3) 175,000 litres of Malathion ULV and approximately 50,000 litres of Lamda
ULV.
(4) 83 x ULVA Mast Micronair sprayers, through Pakistan Embassy in UK.
(5) 6 x spraying aircrafts.
Page 3
3 of 15
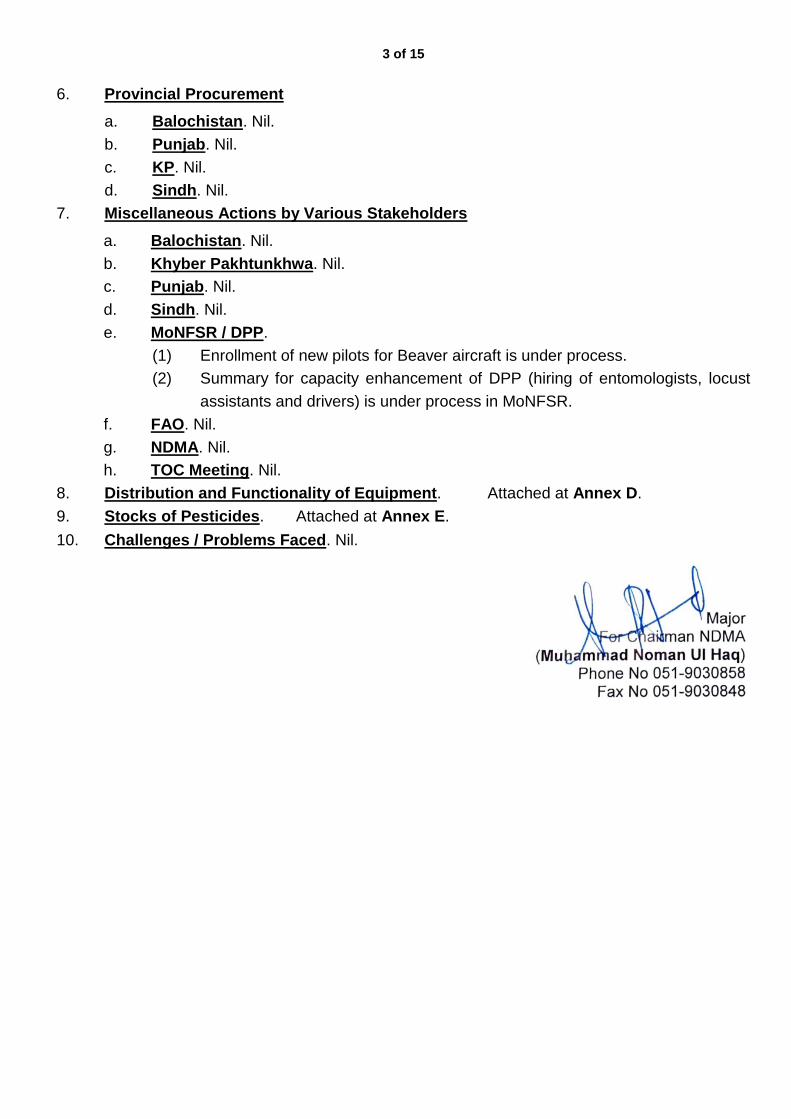
6. Provincial Procurement
a. Balochistan. Nil.
b. Punjab. Nil.
c. KP. Nil.
d. Sindh. Nil.
7. Miscellaneous Actions by Various Stakeholders
a. Balochistan. Nil.
b. Khyber Pakhtunkhwa. Nil.
c. Punjab. Nil.
d. Sindh. Nil.
e. MoNFSR / DPP.
(1) Enrollment of new pilots for Beaver aircraft is under process.
(2) Summary for capacity enhancement of DPP (hiring of entomologists, locust
assistants and drivers) is under process in MoNFSR.
f. FAO. Nil.
g. NDMA. Nil.
h. TOC Meeting. Nil.
8. Distribution and Functionality of Equipment. Attached at Annex D.
9. Stocks of Pesticides. Attached at Annex E.
10. Challenges / Problems Faced. Nil.
Page 4
4 of 15
Annex “A” Current Global Situation
Page 5
5 of 15
Global Forecast
Page 7
7 of 15
Annex “B”
DISTRICT-WISE LOCUST FIELD SURVEILLANCE
# Districts
Locust Field Survey Resources Employed
Area Surveyed
Last 24 hrs (ha)
Total Area Surveyed
(ha)
Locust (Yes / No w/ area in ha)
State (Stat / Mov)
Life Stage Vehicles
No. of Teams
Manpower
M / I / N Req Aval Req Aval Req Aval
BALOCHISTAN
1. Khuzdar 10400 453,332 Yes Moving N 4 4 4 4 26 26
2. Awaran 6300 247,670 Yes Moving M 2 1 2 2 12 12
3. Nushki 18470 598,299 Yes Static N 6 4 6 6 34 34
4. Dalbandin / Chaghi 18000 585,830 Yes Moving I / N 6 6 6 6 34 34
5. Gawadar 18000 485,100 Yes Moving / Static M / N 10 8 10 10 58 58
6. Lasbella / Uthal 15000 509,900 No - - 8 4 8 8 44 44
7. Kech 6400 447,587 Yes Moving M / N 8 8 8 8 48 48
8. Panjgur 4350 180,340 Yes Static N 4 4 4 4 25 25
9. Kharan 4500 375,265 Yes Static I / N 6 4 6 6 38 38
10. Washuk 8500 114,524 Yes Static I 2 2 2 2 15 15
11. Quetta 9000 324,100 Yes Moving M 4 2 4 4 26 26
12. Barkhan 450 98,280 Yes Moving M 3 3 6 6 24 24
13. Dera Bughti 1050 51,615 Yes Static N 3 6 6 6 24 24
14. Duki 45 5,099 Yes Static M 3 1 4 4 16 16
15. Harnai 250 16,945 Yes Moving / Static M / N 3 1 2 2 8 8
16. Jaffar Abad 244 15,539 No - - 3 3 4 4 16 16
17. Jhal Magsi 100 7,813 Yes Moving M / N 3 2 4 4 16 16
18. Kachi / Bolan 500 68,496 Yes Moving N 3 3 6 6 24 24
19. Kalat 40 49,640 Yes Moving M 3 1 6 6 24 24
20. Killa Abdullah 76 6,082 No - - 3 2 4 4 16 16
21. Killa Saifullah 850 157,800 No - - 3 2 6 6 24 24
22. Kohlu 400 3,720 Yes Moving / Static M / N 3 1 4 4 16 16
23. Loralai 0 37,830 No - - 3 2 4 4 16 16
24. Mastung 254 44,847 Yes Moving M 3 3 6 6 24 24
25. Musakhail 50 2,185 No - - 3 3 4 4 16 16
26. Naseerabad 41987 635,166 Yes Moving N 3 1 6 6 24 24
27. Pishin 200 85,700 Yes Moving M 3 2 6 6 24 24
28. Sherani 0 12,291 No - - 3 1 4 4 16 16
29. Sibi 400 37,180 Yes Static M / I 3 1 4 4 16 16
30. Surab 0 16,400 No - - 3 1 6 6 16 16
Page 8
8 of 15
# Districts
Locust Field Survey Resources Employed
Area Surveyed
Last 24 hrs (ha)
Total Area Surveyed
(ha)
Locust (Yes / No w/ area in ha)
State (Stat / Mov)
Life Stage Vehicles
No. of Teams
Manpower
M / I / N Req Aval Req Aval Req Aval
31. Sohbat Pur 200 10,421 Yes Moving M 3 1 4 4 24 24
32. Zhob 500 38,481 Yes Moving / Static M / N 3 2 6 6 24 24
33. Ziarat 35 7,220 Yes Moving / Static M / N 3 2 4 4 16 16
TOTAL 166551 5,730,697 - - - 126 91 166 166 784 784 KHYBER PAKHTUNKHWA
1. Dera Ismail Khan 5000 85045 N 0 0 2 2 2 2 10 10
2. Tank 3300 67930 Y (85 ha) Static N 2 1 2 2 10 10
3. South Waziristan 2500 202690 Y (30 ha) Static N 4 2 4 4 27 27
4. North Waziristan 8200 101700 Y Both M / N 3 1 3 3 15 15
5. Lakki Marwat 5000 296000 Y( 400 ha) Static N 2 1 2 2 10 10
6. Bannu 3200 104330 N 0 0 2 2 2 2 10 10
7. Karak 3400 122010 Y Move M 2 2 2 2 10 10
8. Kohat 1440 51865 N 0 0 3 2 3 3 15 15
9. Kurram 5400 86400 N 0 0 2 1 2 2 10 10
10. Hangu 2000 56766 N 0 0 2 1 2 2 10 10
11. Nowshera 4950 177455 Y ( 01 ha) Static N 2 2 2 2 10 10
12. Orakzai 4930 123698 Y Static N 2 2 2 2 10 10
13. Peshawar 4990 162820 N 0 0 5 2 5 5 40 40
14. Khyber 6500 138952 Y Static N 2 1 2 2 10 10
15. Bajaur 5300 10300 N 0 0 2 1 2 2 10 10
TOTAL 66110 1787961 37 23 37 37 207 207
PUNJAB
1. Bhakkar 1645 140202 821 Moving
N (4TH-5th instar)+Immature flyers
0 6 0 6 0 33
2. Khushab 4228 227335 1200 Stat / Mov N 8 4 6 17 50 45
3. Rajanpur 4158 121259 No - - 4 12 0 8 60 30
4. DG Khan 1230 959511 No - - 0 2 0 9 80 132
5. Layyah 2440 282929 265 Moving I+N 3 8 0 7 55 20
6. Jhang 6250 228236 1230 Moving
Hopper Adults
4 2 0
17 0
43
7. Mianwali 14195 259843 55 Moving Mature 2 4 0 3 0 104
8. Okara 8 9277 7.6 Static N 0 4 25 20 0 64
9. Sahiwal 0 6289 No - 0 2 9 3 5 12 36
10. Pakpattan 770 102433 No _ 0 0 6 0 43 0 190
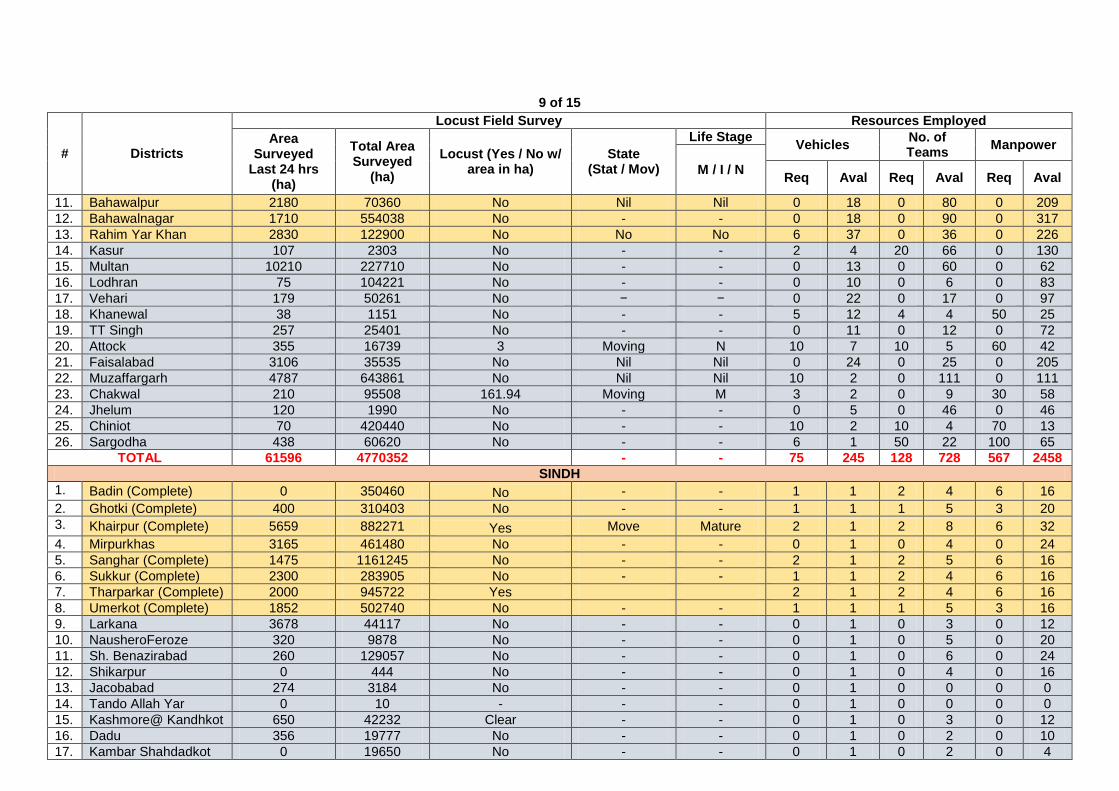
Page 9
9 of 15
# Districts
Locust Field Survey Resources Employed
Area Surveyed
Last 24 hrs (ha)
Total Area Surveyed
(ha)
Locust (Yes / No w/ area in ha)
State (Stat / Mov)
Life Stage Vehicles
No. of Teams
Manpower
M / I / N Req Aval Req Aval Req Aval
11. Bahawalpur 2180 70360 No Nil Nil 0 18 0 80 0 209
12. Bahawalnagar 1710 554038 No - - 0 18 0 90 0 317
13. Rahim Yar Khan 2830 122900 No No No 6 37 0 36 0 226
14. Kasur 107 2303 No - - 2 4 20 66 0 130
15. Multan 10210 227710 No - - 0 13 0 60 0 62
16. Lodhran 75 104221 No - - 0 10 0 6 0 83
17. Vehari 179 50261 No − − 0 22 0 17 0 97
18. Khanewal 38 1151 No - - 5 12 4 4 50 25
19. TT Singh 257 25401 No - - 0 11 0 12 0 72
20. Attock 355 16739 3 Moving N 10 7 10 5 60 42
21. Faisalabad 3106 35535 No Nil Nil 0 24 0 25 0 205
22. Muzaffargarh 4787 643861 No Nil Nil 10 2 0 111 0 111
23. Chakwal 210 95508 161.94 Moving M 3 2 0 9 30 58
24. Jhelum 120 1990 No - - 0 5 0 46 0 46
25. Chiniot 70 420440 No - - 10 2 10 4 70 13
26. Sargodha 438 60620 No - - 6 1 50 22 100 65
TOTAL 61596 4770352 - - 75 245 128 728 567 2458
SINDH
1. Badin (Complete) 0 350460 No - - 1 1 2 4 6 16
2. Ghotki (Complete) 400 310403 No - - 1 1 1 5 3 20
3. Khairpur (Complete) 5659 882271 Yes Move Mature 2 1 2 8 6 32
4. Mirpurkhas 3165 461480 No - - 0 1 0 4 0 24
5. Sanghar (Complete) 1475 1161245 No - - 2 1 2 5 6 16
6. Sukkur (Complete) 2300 283905 No - - 1 1 2 4 6 16
7. Tharparkar (Complete) 2000 945722 Yes 2 1 2 4 6 16
8. Umerkot (Complete) 1852 502740 No - - 1 1 1 5 3 16
9. Larkana 3678 44117 No - - 0 1 0 3 0 12
10. NausheroFeroze 320 9878 No - - 0 1 0 5 0 20
11. Sh. Benazirabad 260 129057 No - - 0 1 0 6 0 24
12. Shikarpur 0 444 No - - 0 1 0 4 0 16
13. Jacobabad 274 3184 No - - 0 1 0 0 0 0
14. Tando Allah Yar 0 10 - - - 0 1 0 0 0 0
15. Kashmore@ Kandhkot 650 42232 Clear - - 0 1 0 3 0 12
16. Dadu 356 19777 No - - 0 1 0 2 0 10
17. Kambar Shahdadkot 0 19650 No - - 0 1 0 2 0 4
Page 10
10 of 15
# Districts
Locust Field Survey Resources Employed
Area Surveyed
Last 24 hrs (ha)
Total Area Surveyed
(ha)
Locust (Yes / No w/ area in ha)
State (Stat / Mov)
Life Stage Vehicles
No. of Teams
Manpower
M / I / N Req Aval Req Aval Req Aval
18. Matiari 7800 16600 No 0 1 0 2 0 4
19. Jamshoro 16000 16000 Yes 158 Move Mature 0 1 0 4 0 16
TOTAL 46189 5199175 - - - 10 19 12 70 36 274
Note: M = Mature, I = Immature & N = Nymph
Annex “C”
DISTRICT-WISE LOCUST CONTROL OPERATIONS
Districts
Control Area Pesticide Used (L) Last 24Hrs Total Pesticide Used (L) Resources Employed
Sprayed Last 24 Hrs (ha)
Total Area Sprayed
(ha)
Balance Area to be Sprayed
(ha)
Malathion ULV
Lambda Cyhalothrin
Malathion ULV
Lambda Cyhalothrin
Veh / Heli
No. Teams
Manpower
BALOCHISTAN
Khuzdar 150 7320 - 50 0 3540 3050 4 4 20
Awaran 15 1023 - 0 15 993 30 1 2 10
Nushki 273 8158 - 73 0 3705 3665 4 6 30
Dalbandin / Chagai 170 14760 - 70 0 8370 4000 6 6 30
Gawadar 130 14450 - 30 0 8830 4000 8 10 50
Lasbella 0 0 - 0 0 0 0 4 8 40
Kech / Turbat 190 10723 - 51 5 6800 5000 8 8 40
Panjgur 145 11298 - 45 0 7467 3000 4 4 20
Kharan 530 35993 - 0 30 15000 7940 4 6 35
Washuk 630 13487 - 130 0 3072 3375 2 2 10
Quetta 0 1872 - 0 0 1872 0 2 4 20
Barkhan 110 2547 - 30 0 1270 994 3 6 24
Dera Bughti 700 12972 - 0 35 4000 4450 6 6 24
Duki 45 1090 - 0 45 1000 90 1 6 24
Harnai 8 825 - 8 0 825 0 1 6 24
Jaffar Abad 0 180 - 0 0 180 0 3 6 24
Jhal Magsi 0 5160 - 0 0 2000 3200 2 6 24
Kachi / Bolan 650 9145 - 0 50 2000 4750 3 6 24
Kalat 7 212 - 0 7 188 24 1 3 24
Killa Abdullah 0 0 - 0 0 0 0 2 6 24
Killa Saifullah 0 0 - 0 0 0 0 2 6 24
Kohlu 0 200 - 0 0 200 0 1 6 24
Page 11
11 of 15
Districts
Control Area Pesticide Used (L) Last 24Hrs Total Pesticide Used (L) Resources Employed
Sprayed Last 24 Hrs (ha)
Total Area Sprayed
(ha)
Balance Area to be Sprayed
(ha)
Malathion ULV
Lambda Cyhalothrin
Malathion ULV
Lambda Cyhalothrin
Veh / Heli
No. Teams
Manpower
Loralai 0 2020 - 0 0 1170 850 2 6 24
Mastung 60 7335 - 60 0 2745 2590 3 6 24
Musakhail 0 0 - 0 0 0 0 3 6 24
Naseerabad 21 4097 - 0 21 1928 2065 1 6 24
Pishin 89 10178 - 0 89 1000 5117 2 6 24
Sherani 0 0 - 0 0 0 0 1 6 24
Sibi 350 3155 - 0 50 1335 860 1 6 24
Surab 0 1150 - 0 0 790 360 1 6 24
Sohbat Pur 30 6657 - 30 0 2620 3000 1 6 24
Zhob 0 450 - 0 0 446 0 2 6 24
Ziarat 0 790 - 0 0 790 0 2 6 24
TOTAL 4303 187247 - 577 347 84136 62410 91 189 833
KHYBER PAKHTUNKHWA
Dera Ismail Khan 0 7725 0 0 0 0 1756 3 3 39
Tank 190 3420 85 0 37 0 887 3 3 39
South Waziristan 30 1230 0 0 20 0 850 3 3 52
North Waziristan 50 3070 143 0 35 0 1022 3 3 39
Lakki Marwat 236 6013 224 0 128 60 4317 6 3 39
Bannu 0 3 0 0 0 0 2 3 3 39
Karak 42 201 0 0 34 0 165 3 3 39
Kohat 0 1223 0 0 0 0 476 8 3 39
Kurram 0 28 0 0 0 0 68.5 3 3 40
Hangu 0 7 0 0 0 0 35 3 3 39
Nowshera 0 397 1 0 3 0 250 3 3 39
Orakzai 40 744 70 0 20 0 622 3 3 39
Peshawar 0 89 0 0 0 0 88 2 2 26
Khyber 40 1215 0 0 15 0 711 2 2 26
Bajaur 30 60 0 0 30 0 60 2 3 39
TOTAL 658 25425 523 0 322 60 11309.5 50 43 573
PUNJAB
Bhakkar 821 19817 0 0 291 0 6990 23 5 153
Khushab 959 16138 241 130 232 530 4569 8 8 210
Rajanpur 0 26187 0 0 0 9930 2828 0 0 0 DG Khan 0 325.24 0 0 0 0 1066 0 0 0 Layyah 160 3347 105 0 34 0 808 18 3 138
Page 12
12 of 15
Districts
Control Area Pesticide Used (L) Last 24Hrs Total Pesticide Used (L) Resources Employed
Sprayed Last 24 Hrs (ha)
Total Area Sprayed
(ha)
Balance Area to be Sprayed
(ha)
Malathion ULV
Lambda Cyhalothrin
Malathion ULV
Lambda Cyhalothrin
Veh / Heli
No. Teams
Manpower
Jhang 746 13516.29 484 0 209 0 3861 4 10 223
Mianwali 55 287 0 0 10 0 143 5 2 40
Okara 8 5394.4 0 0 1 280 2198 4 16 64
Sahiwal 0 553.39 0 0 0 0 371.06 0 0 0 Pakpattan 0 143.038 0 0 0 0 200.29 0 0 0 Bahawalpur 0 0 0 0 0 0 1052 0 0 0 Bahawalnagar 0 1982 0 0 0 0 1293 0 0 0 Rahim Yar Khan 0 23022 0 0 0 1950 2281 0 0 0 Kasur 0 0 0 0 0 0 4 0 0 0 Multan 0 0 0 0 0 0 24 0 0 0 Lodhran 0 42 0 0 0 0 58 0 0 0 Vehari 0 97 0 0 0 0 18 0 0 0 Khanewal 0 0 0 0 0 0 456 0 0 0 TT Singh 0 116 0 0 0 0 82 0 0 0 Attock 3 445.642 0 0 0.75 0 43 7 5 42
Faisalabad 0 0 0 0 0 0 0 0 0 0 Muzaffargarh 0 150 0 0 0 0 126 0 0 0 Chakwal 56 56 105 0 40 0 40 2 2 25
Jhelum 0 0 0 0 0 0 0 0 0 0 Chiniot 0 0 0 0 0 0 0 0 0 0 Sargodha 0 0 0 0 0 0 0 0 0 0
TOTAL 2808 111619 935 130 817.75 12690 28511.35 71 51 895
SINDH
Badin 0 0 0 0 0 0 0 0 0 0
Ghotki 0 5170 0 0 0 0 850 0 0 0
Khairpur 300 810 0 0 60 0 550 1 2 8
Mirpurkhas 0 0 0 0 0 0 0 0 0 0
Sanghar 0 6 0 0 0 0 5 0 0 0
Sukkur 0 800 0 0 0 0 70 0 0 0
Tharparkar 100 275 0 0 10 0 100 1 2 8
Umerkot 0 119 0 0 0 0 35 0 0 0
Shikarpur 0 10 0 0 0 0 10 0 0 0
Jacobabad 0 478 0 0 0 0 497 0 0 0
Tando Allah Yar 0 4 0 0 0 0 4 0 0 0
Kashmore@ Kandhkot 0 7341 0 0 0 4490 2214 0 0 0
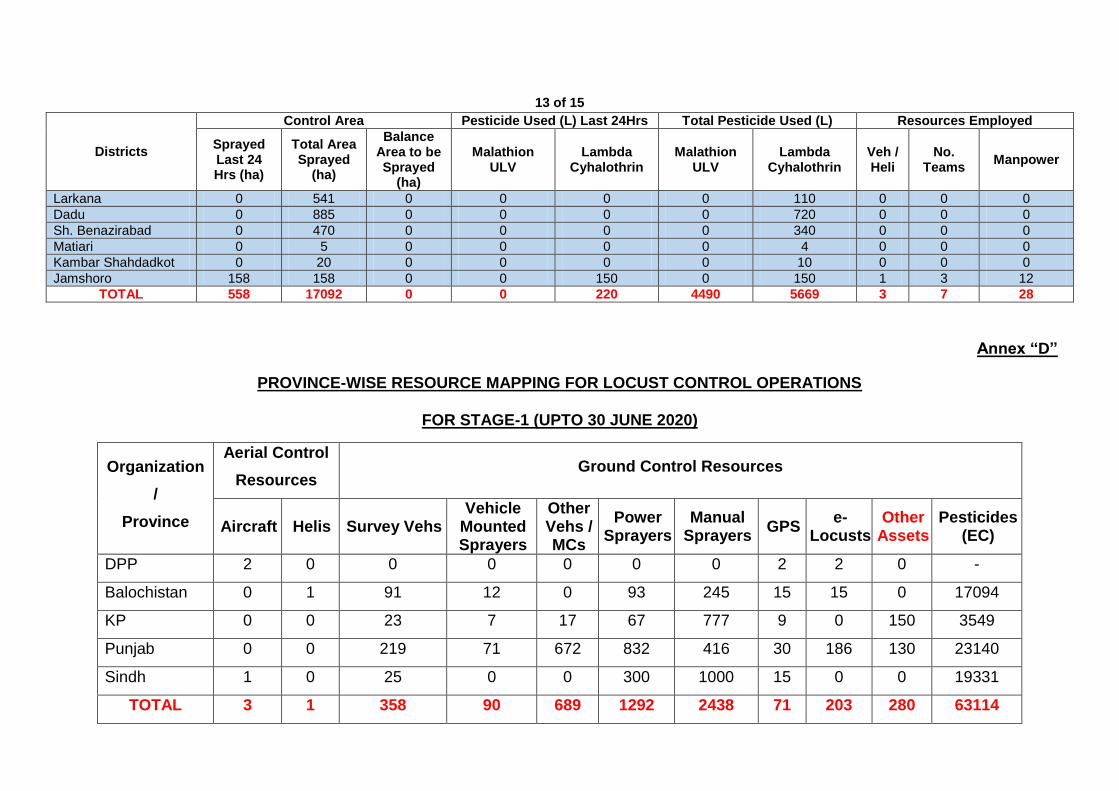
Page 13
13 of 15
Districts
Control Area Pesticide Used (L) Last 24Hrs Total Pesticide Used (L) Resources Employed
Sprayed Last 24 Hrs (ha)
Total Area Sprayed
(ha)
Balance Area to be Sprayed
(ha)
Malathion ULV
Lambda Cyhalothrin
Malathion ULV
Lambda Cyhalothrin
Veh / Heli
No. Teams
Manpower
Larkana 0 541 0 0 0 0 110 0 0 0
Dadu 0 885 0 0 0 0 720 0 0 0
Sh. Benazirabad 0 470 0 0 0 0 340 0 0 0
Matiari 0 5 0 0 0 0 4 0 0 0
Kambar Shahdadkot 0 20 0 0 0 0 10 0 0 0
Jamshoro 158 158 0 0 150 0 150 1 3 12
TOTAL 558 17092 0 0 220 4490 5669 3 7 28
Annex “D”
PROVINCE-WISE RESOURCE MAPPING FOR LOCUST CONTROL OPERATIONS
FOR STAGE-1 (UPTO 30 JUNE 2020)
Organization
/
Province
Aerial Control
Resources Ground Control Resources
Aircraft Helis Survey Vehs Vehicle
Mounted Sprayers
Other Vehs / MCs
Power Sprayers
Manual Sprayers
GPS e-
Locusts Other
Assets Pesticides
(EC)
DPP 2 0 0 0 0 0 0 2 2 0 -
Balochistan 0 1 91 12 0 93 245 15 15 0 17094
KP 0 0 23 7 17 67 777 9 0 150 3549
Punjab 0 0 219 71 672 832 416 30 186 130 23140
Sindh 1 0 25 0 0 300 1000 15 0 0 19331
TOTAL 3 1 358 90 689 1292 2438 71 203 280 63114
Page 14
14 of 15
Annex “E” PESTICIDES AVAILABILITY - BALCOHISTAN
Districts EC Pesticide Availability
District EC Pesticide Availability
Required Received Consumed Balance Required Received Consumed Balance
Khuzdar 7000 6004 3050 2954 Kachi / Bolan 5000 4800 4750 50
Awaran 3500 1000 30 970 Kalat 2500 500 24 476
Nushki 4000 4000 3665 335 Killa Abdullah 2500 500 0 500
Dalbandin / Chaghi 5000 4800 4000 800 Killa Saifullah 2500 500 0 500
Gawadar 8000 5000 4000 1000 Kohlu 1500 800 0 800
Lasbella / Uthal 5000 1000 0 1000 Loralai 2000 1500 850 650
Kech 5000 5000 5000 0 Mastung 2000 3000 2590 410
Panjgur 4500 4000 3000 1000 Musakhail 1000 600 0 600
Kharan 8000 8000 7940 60 Naseerabad 5000 2500 2065 435
Washuk 4500 3500 3375 125 Pishin 5000 5500 5117 383
Quetta 3000 1000 0 1000 Sherani 500 500 0 500
Barkhan 5000 1000 994 6 Sibi 2000 1000 860 140
Dera Bughti 4500 4500 4450 50 Surab 1500 500 360 140
Duki 500 100 90 10 Sohbat Pur 3000 3000 3000 0
Harnai 2500 500 0 500 Zhob 2500 400 0 400
Jaffar Abad 5000 500 0 500 Ziarat 3000 500 0 500
Jhal Magsi 4000 3500 3200 300 Sub Total 41500 26100 19616 6484
Sub Total 79000 53404 42794 10610 Total 120500 79504 62410 17094
PESTICIDES AVAILABILITY - KP
Districts EC Pesticides in Liters EC Pesticides in Liters
Required Received Consumed Balance Required Received Consumed Balance
D.I. Khan 4000 1838 1756 82 Kurram 2400 138.5 68.5 70
Tank 3000 1300 887 413 Hangu 2000 500 35 465
South Waziristan 2400 1340 850 490 Nowshera 3000 350 250 100
North Waziristan 2550 1200 1022 178 Orakzai 2500 664 622 42
Lakki Marwat 5150 4951 4317 634 Peshawar 3000 156 88 68
Bannu 2000 395 2 393 Khyber 3000 740 711 29
Karak 2000 510 165 345 Bajaur 2000 260 60 200
Kohat 3000 516 476 40 0 0 0 0
Sub Total 24100 12050 9475 2575 Sub Total 17900 2808.5 1834.5 974
Total 42000 14858.5 11309.5 3549
Page 15
15 of 15
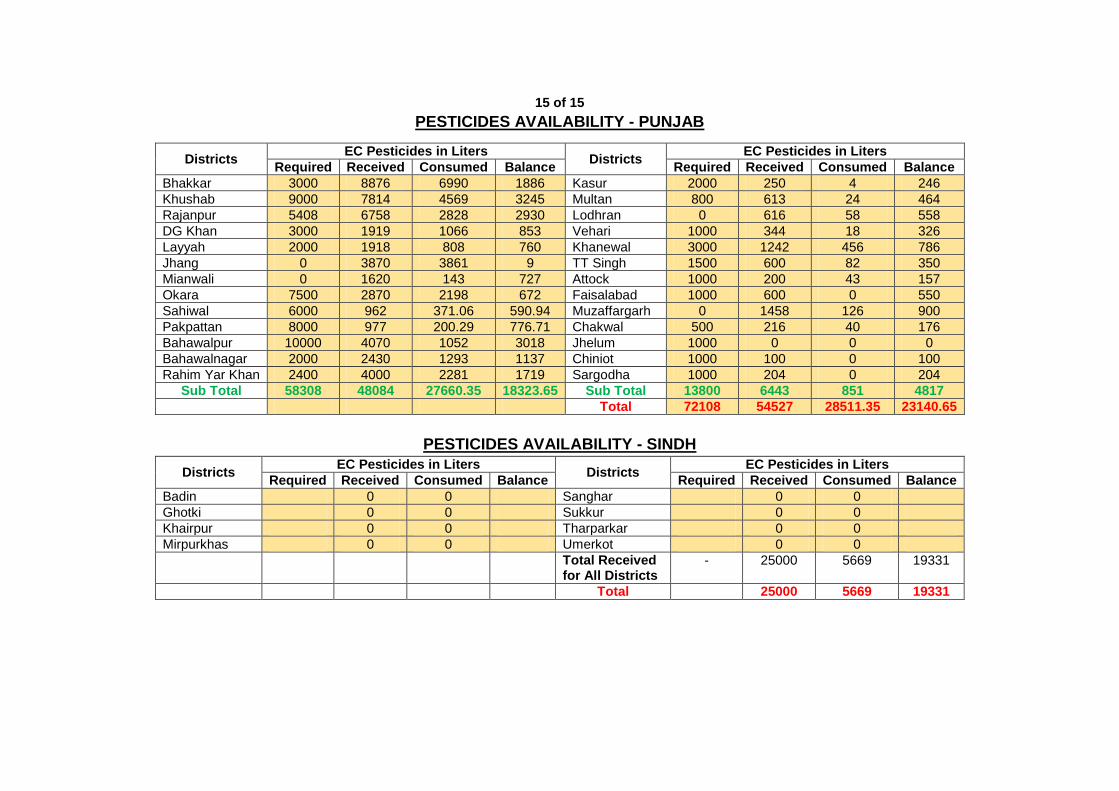
PESTICIDES AVAILABILITY - PUNJAB
Districts EC Pesticides in Liters
Districts EC Pesticides in Liters
Required Received Consumed Balance Required Received Consumed Balance
Bhakkar 3000 8876 6990 1886 Kasur 2000 250 4 246
Khushab 9000 7814 4569 3245 Multan 800 613 24 464
Rajanpur 5408 6758 2828 2930 Lodhran 0 616 58 558
DG Khan 3000 1919 1066 853 Vehari 1000 344 18 326
Layyah 2000 1918 808 760 Khanewal 3000 1242 456 786
Jhang 0 3870 3861 9 TT Singh 1500 600 82 350
Mianwali 0 1620 143 727 Attock 1000 200 43 157
Okara 7500 2870 2198 672 Faisalabad 1000 600 0 550
Sahiwal 6000 962 371.06 590.94 Muzaffargarh 0 1458 126 900
Pakpattan 8000 977 200.29 776.71 Chakwal 500 216 40 176
Bahawalpur 10000 4070 1052 3018 Jhelum 1000 0 0 0 Bahawalnagar 2000 2430 1293 1137 Chiniot 1000 100 0 100
Rahim Yar Khan 2400 4000 2281 1719 Sargodha 1000 204 0 204
Sub Total 58308 48084 27660.35 18323.65 Sub Total 13800 6443 851 4817
Total 72108 54527 28511.35 23140.65
PESTICIDES AVAILABILITY - SINDH
Districts EC Pesticides in Liters
Districts EC Pesticides in Liters
Required Received Consumed Balance Required Received Consumed Balance
Badin 0 0 Sanghar 0 0
Ghotki 0 0 Sukkur 0 0
Khairpur 0 0 Tharparkar 0 0
Mirpurkhas 0 0 Umerkot 0 0
Total Received for All Districts
- 25000 5669 19331
Total 25000 5669 19331