+ All Categories
Home > Documents > 1 of 32 © 2014 Pearson Education, Inc. Publishing as Prentice Hall CHAPTER OUTLINE 7 The Production...

1 of 32 © 2014 Pearson Education, Inc. Publishing as Prentice Hall CHAPTER OUTLINE 7 The Production...

Date post: 25-Dec-2015
Category:
Upload: chad-walter-greene
View: 217 times
Download: 0 times
Share this document with a friend
32
1 of © 2014 Pearson Education, Inc. Publishing as Prentice Hall CHAPTER OUTLINE 7 The Production Process: The Behavior of Profit-Maximizing Firms The Behavior of Profit-Maximizing Firms Profits and Economic Costs Short-Run versus Long-Run Decisions The Bases of Decisions: Market Price of Outputs, Available Technology, and Input Prices The Production Process Production Functions: Total Product, Marginal Product, and Average Product Production Functions with Two Variable Factors of Production Choice of Technology Looking Ahead: Cost and Supply Appendix: Isoquants and Isocosts
Transcript

1 of 32© 2014 Pearson Education, Inc. Publishing as Prentice Hall

CHAPTER OUTLINE

7The Production Process:

The Behavior ofProfit-Maximizing

Firms

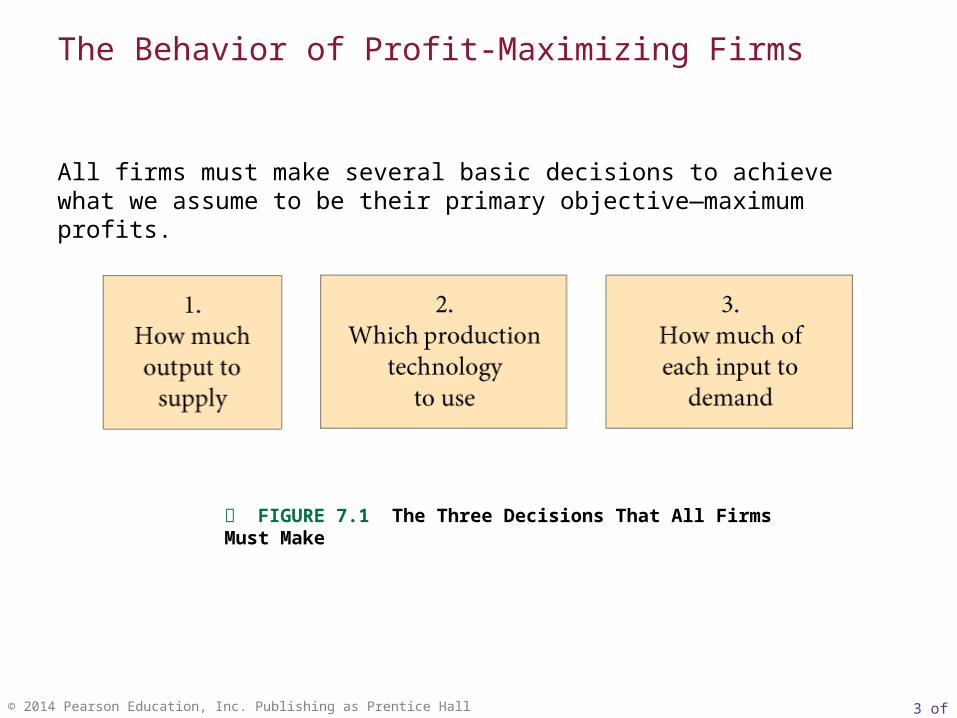
The Behavior of Profit-Maximizing FirmsProfits and Economic CostsShort-Run versus Long-Run DecisionsThe Bases of Decisions: Market Price of Outputs, Available Technology, and Input Prices

The Production ProcessProduction Functions: Total Product, Marginal Product, and Average ProductProduction Functions with Two Variable Factors of Production

Choice of Technology

Looking Ahead: Cost and Supply

Appendix: Isoquants and Isocosts

2 of 32© 2014 Pearson Education, Inc. Publishing as Prentice Hall

production The process by which inputs are combined, transformed, and turned into outputs.

firm An organization that comes into being when a person or a group of people decides to produce a good or service to meet a perceived demand.

3 of 32© 2014 Pearson Education, Inc. Publishing as Prentice Hall

All firms must make several basic decisions to achieve what we assume to be their primary objective—maximum profits.

FIGURE 7.1 The Three Decisions That All Firms Must Make

The Behavior of Profit-Maximizing Firms

4 of 32© 2014 Pearson Education, Inc. Publishing as Prentice Hall

profit The difference between total revenue and total cost.

profit = total revenue total cost

total revenue The amount received from the sale of the product (q x P).

Profits and Economic Costs

total cost The total of (1) out-of-pocket costs and (2) opportunity cost of all factors of production.

5 of 32© 2014 Pearson Education, Inc. Publishing as Prentice Hall

economic profit = total revenue total economic cost

The term profit will from here on refer to economic profit.

So whenever we say profit = total revenue total cost, what we really mean is

economic profit Profit that accounts for both explicit and opportunity costs.

6 of 32© 2014 Pearson Education, Inc. Publishing as Prentice Hall

normal rate of return A rate of return on capital that is just sufficient to keep owners and investors satisfied. For relatively risk-free firms, it should be nearly the same as the interest rate on risk-free government bonds.

TABLE 7.1 Calculating Total Revenue, Total Cost, and Profit

Initial Investment:

Market Interest Rate Available:

$20,000

0.10, or 10%

Total revenue (3,000 belts x $10 each) $30,000

Costs

Belts from Supplier $15,000

Labor cost 14,000

Normal return/opportunity cost of capital ($20,000 x 0.10) 2,000

Total Cost $31,000

Profit = total revenue total cost $1,000a

Normal Rate of Return

aThere is a loss of $1,000.

The way we treat the opportunity cost of capital is to add a normal rate of return to capital as part of economic cost.

7 of 32© 2014 Pearson Education, Inc. Publishing as Prentice Hall

short run The period of time for which two conditions hold: 1.The firm is operating under a fixed scale (fixed factor) of production2. firms can neither enter nor exit an industry.

long run That period of time for which there are no fixed factors of production: Firms can increase or decrease the scale of operation, and new firms can enter and existing firms can exit the industry.

Short-Run versus Long-Run Decisions

8 of 32© 2014 Pearson Education, Inc. Publishing as Prentice Hall

In the language of economics, a firm needs to know three things:

1. The market price of output.

2. The techniques of production that are available.

3. The prices of inputs.

Output price determines potential revenues. The techniques available tell me

how much of each input I need, and input prices tell me how much they will cost.

Together the available production techniques and the prices of inputs determine

costs.

The Bases of Decisions: Market Price of Outputs, Available Technology, and Input Prices

optimal method of production The production method that minimizes cost for a given level of output.

9 of 32© 2014 Pearson Education, Inc. Publishing as Prentice Hall

FIGURE 7.2 Determining the Optimal Method of Production

10 of 32© 2014 Pearson Education, Inc. Publishing as Prentice Hall

production technology The quantitative relationship between inputs and outputs.

labor-intensive technology Technology that relies heavily on human labor instead of capital.

capital-intensive technology Technology that relies heavily on capital instead of human labor.

The Production Process

11 of 32© 2014 Pearson Education, Inc. Publishing as Prentice Hall

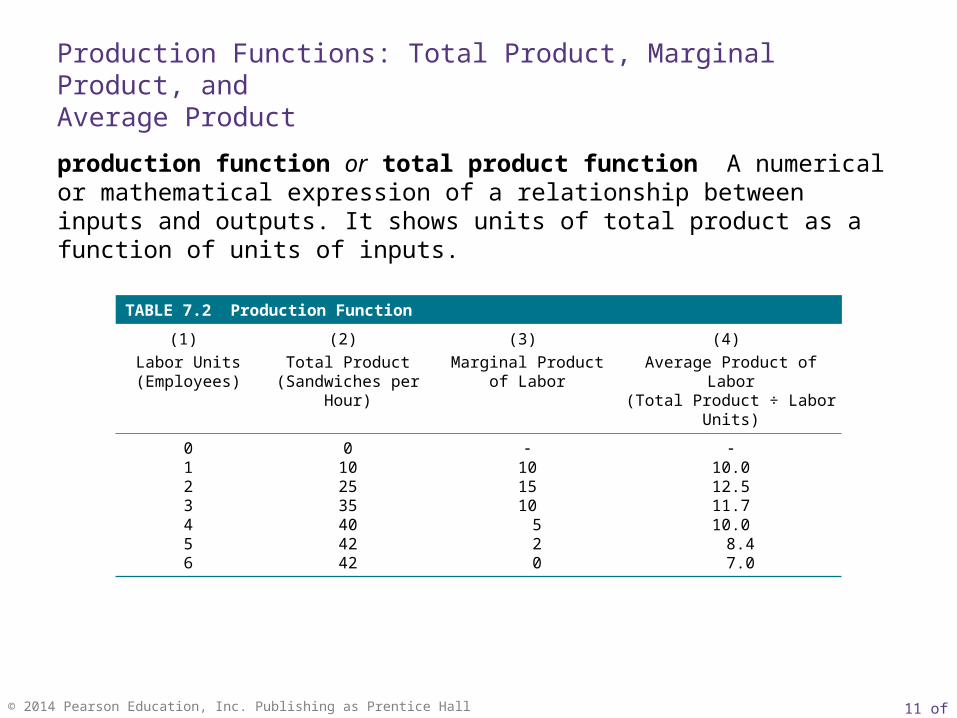
production function or total product function A numerical or mathematical expression of a relationship between inputs and outputs. It shows units of total product as a function of units of inputs.

TABLE 7.2 Production Function

(1)

Labor Units(Employees)

(2)

Total Product(Sandwiches per Hour)

(3)

Marginal Productof Labor

(4)

Average Product of Labor(Total Product ÷ Labor Units)

0123456

0102535404242

101510 5 2 0

10.012.511.710.0 8.4 7.0

Production Functions: Total Product, Marginal Product, andAverage Product

12 of 32© 2014 Pearson Education, Inc. Publishing as Prentice Hall

FIGURE 7.3 Production Function for Sandwiches

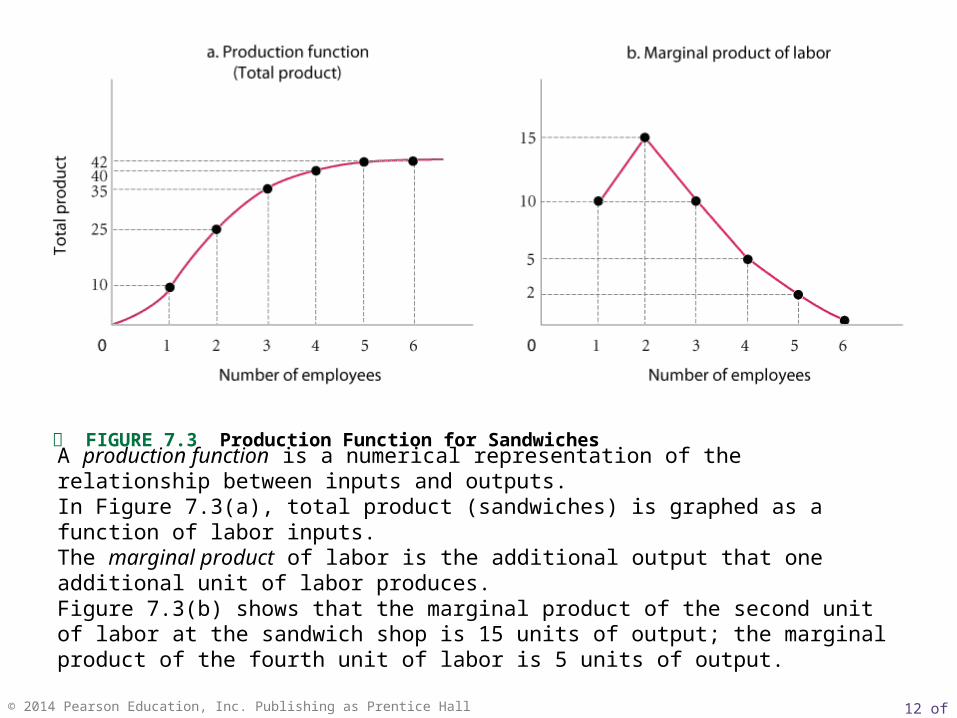
A production function is a numerical representation of the relationship between inputs and outputs.In Figure 7.3(a), total product (sandwiches) is graphed as a function of labor inputs.The marginal product of labor is the additional output that one additional unit of labor produces. Figure 7.3(b) shows that the marginal product of the second unit of labor at the sandwich shop is 15 units of output; the marginal product of the fourth unit of labor is 5 units of output.

13 of 32© 2014 Pearson Education, Inc. Publishing as Prentice Hall

marginal product The additional output that can be produced by adding one more unit of a specific input, ceteris paribus.

law of diminishing returns When additional units of a variable input are added to fixed inputs, after a certain point, the marginal product of the variable input declines.

Every firm will face diminishing returns, which always apply in the short run. This means that every firm finds it progressively more difficult to increase its output as it approaches capacity production.

Marginal Product and the Law of Diminishing Returns

14 of 32© 2014 Pearson Education, Inc. Publishing as Prentice Hall

15 of 32© 2014 Pearson Education, Inc. Publishing as Prentice Hall

average product The average amount produced by each unit of a variable factor of production.

total productaverage product of labor

total units of labor

Marginal Product versus Average Product

If marginal product is above average product, the average rises; if marginal product is below average product, the average falls.

16 of 32© 2014 Pearson Education, Inc. Publishing as Prentice Hall

FIGURE 7.4 Total Average and Marginal Product

Marginal and average product curves can be derived from total product curves. Average product is at its maximum at the point of intersection with marginal product.

17 of 32© 2014 Pearson Education, Inc. Publishing as Prentice Hall

Production Functions with Two Variable Factors of Production

Inputs work together in production. Capital and labor are complementary inputs.

Additional capital increases the productivity of labor—that is, the amount of output produced per worker per hour.

This simple relationship lies at the heart of worries about productivity at the national and international levels. Building new, modern plants and equipment enhances a nation’s productivity.

In the last decade, China has accumulated capital (that is, built plants and equipment) at a very high rate. The result is growth in the average quantity of output per worker in China.

18 of 32© 2014 Pearson Education, Inc. Publishing as Prentice Hall

In farming, as in manufacturing, we need a given combination of labor and capital to produce output, here a crop.

In the 1990s, an area of Ghana changed from an exclusive reliance on maize as the agricultural crop to the development of pineapple farms.

The choice of how much fertilizer to use was highly dependent on how much fertilizer their more successful neighbor farmers used.

Social learning obviously plays a role in the diffusion of manufacturing technology as well.

Learning about Growing Pineapples in Ghana

E C O N O M I C S I N P R A C T I C E

THINKING PRACTICALLY

1. In many high-tech firms, executives must sign non-compete agreements, preventing them from working for a competitor after they stop working for their current firm. These agreements are much less common in mature manufacturing firms. Why?

THINKING PRACTICALLY

1. In many high-tech firms, executives must sign non-compete agreements, preventing them from working for a competitor after they stop working for their current firm. These agreements are much less common in mature manufacturing firms. Why?

19 of 32© 2014 Pearson Education, Inc. Publishing as Prentice Hall

TABLE 7.3 Inputs Required to Produce 100 Diapers Using Alternative Technologies

Technology Units of Capital (K) Units of Labor (L)

ABCDE

2346

10

106432

TABLE 7.4 Cost-Minimizing Choice among Alternative Technologies (100 Diapers)

(1)Technology

(2)Units of Capital (K)

(3)Units of Labor (L)

Cost = (L X PL) + (K X PK)

(4) (5)PL = $1PK = $1

PL = $5PK = $1

ABCDE

2346

10

106432

$12989

12

$52 33 24 21 20

Choice of Technology

Two things determine the cost of production: (1) technologies that are available and (2) input prices. Profit-maximizing firms will choose the technology that minimizes the cost of production given current market input prices.

20 of 32© 2014 Pearson Education, Inc. Publishing as Prentice Hall

The trucking business gives us an opportunity to think about choice among technologies in a concrete way.

Modern technology, in the form of on-board computers, allows a modern trucking firm to monitor driving speed and instruct drivers.

How Fast Should a Truck Driver Go?

E C O N O M I C S I N P R A C T I C E

Fuel Price $3.50 $4.00 $4.50

Drive Fast $124.98 $133.33 $141.63

Drive Slowly $126.67 $133.33 $139.99

THINKING PRACTICALLY

1. When gasoline prices rise, accident rates fall. Provide two reasons this might be true.

THINKING PRACTICALLY

1. When gasoline prices rise, accident rates fall. Provide two reasons this might be true.

21 of 32© 2014 Pearson Education, Inc. Publishing as Prentice Hall

22 of 32© 2014 Pearson Education, Inc. Publishing as Prentice Hall

Looking Ahead: Cost and Supply

So far, we have looked only at a single level of output.

One of our main objectives in the next chapter is to determine the amount that a competitive firm will choose to supply during a given time period.

23 of 32© 2014 Pearson Education, Inc. Publishing as Prentice Hall

average product

capital-intensive technology

firm

labor-intensive technology

law of diminishing returns

long run

marginal product

normal rate of return

optimal method of production

production

production function or total product function

production technology

profit (economic profit)

short run

total cost (total economic cost)

total revenue

Profit = total revenue – total cost

s of labortotal unit

ucttotal prodaboroduct of lAverage pr

R E V I E W T E R M S A N D C O N C E P T S

24 of 32© 2014 Pearson Education, Inc. Publishing as Prentice Hall

This chapter has shown that the cost structure facing a firm depends on two key pieces of information: (1) input (factor) prices and (2) technology. This Appendix presents a more formal analysis of technology and factor prices and their relationship to cost.

CHAPTER 7 APPENDIX

Isoquants and Isocosts

New Look at Technology: Isoquants

25 of 32© 2014 Pearson Education, Inc. Publishing as Prentice Hall

isoquant A graph that shows all the combinations of capital and labor that can be used to produce a given amount of output.

FIGURE 7A.1 Isoquants Showing All Combinations of Capital and Labor That Can Be Used to Produce 50, 100, and 150 Units of Output

TABLE 7A.1 Alternative Combinations of Capital (K) and Labor (L) Required to Produce 50, 100, and 150 Units of Output

QX = 50 QX = 100 QX = 150

K L K L K L

A

B

C

D

E

1

2

3

5

8

8

5

3

2

1

2

3

4

6

10

10

6

4

3

2

3

4

5

7

10

10

7

5

4

3

26 of 32© 2014 Pearson Education, Inc. Publishing as Prentice Hall

FIGURE 7A.2 The Slope of an Isoquant Is Equal to the Ratio of MPL to MPK

Slope of isoquant:

K

L

MP

MP

L

K

marginal rate of technical substitution The rate at which a firm can substitute capital for labor and hold output constant.

K MPK = L MPL

For output to remain constant, the loss of output from using less capital must be matched by the added output produced by using more labor.

27 of 32© 2014 Pearson Education, Inc. Publishing as Prentice Hall

isocost line A graph that shows all the combinations of capital and labor available for a given total cost.

FIGURE 7A.3 Isocost Lines Showing the Combinations of Capital and Labor Available for $5, $6, and $7

An isocost line shows all the combinations of capital and labor that are available for a given total cost.

Factor Prices and Input Combinations: Isocosts

(PK K) + (PL L) = TC

Substituting our data for the lowest isocost line into this general equation, we get

28 of 32© 2014 Pearson Education, Inc. Publishing as Prentice Hall

FIGURE 7A.4 Isocost Line Showing All Combinations of Capital and Labor Available for $25

Slope of isocost line:

One way to draw an isocost line is to determine the endpoints of that line and draw a line connecting them.

Factor Prices and Input Combinations: Isocosts

29 of 32© 2014 Pearson Education, Inc. Publishing as Prentice Hall

FIGURE 7A.5 Finding the Least-Cost Combination of Capital and Labor to Produce 50 Units of Output

Profit-maximizing firms will minimize costs by producing their chosen level of output with the technology represented by the point at which the isoquant is tangent to an isocost line. Here the cost-minimizing technology—3 units of capital and 3 units of labor—is represented by point C.

Finding the Least-Cost Technology with Isoquants and Isocosts

30 of 32© 2014 Pearson Education, Inc. Publishing as Prentice Hall

FIGURE 7A.6 Minimizing Cost of Production for qX = 50, qX = 100, and qX = 150

Plotting a series of cost-minimizing combinations of inputs—shown in this graph as points A, B, and C— on a separate graph results in a cost curve like the one shown in Figure 7A.7.

FIGURE 7A.7 A Cost Curve Shows the Minimum Cost of Producing Each Level of Output

31 of 32© 2014 Pearson Education, Inc. Publishing as Prentice Hall

K

L

K

L

P

P

MP

MP isocost of slope isoquant of slope

At the point where a line is just tangent to a curve, the two have the same slope. At each point of tangency, the following must be true:

Thus,

K

L

K

L

P

P

MP

MP

Dividing both sides by PL and multiplying both sides by MPK, we get

K

K

L

L

P

MP

P

MP

The Cost-Minimizing Equilibrium Condition

32 of 32© 2014 Pearson Education, Inc. Publishing as Prentice Hall

isocost line

isoquant

marginal rate of technical substitution

1. Slope of isoquant:

2. Slope of isocost line:

K

L

MP

MP

L

K

A P P E N D I X R E V I E W T E R M S A N D C O N C E P T S


Recommended