1 Distinctiveness of Farmers of the Middle: A Preliminary Report on the Missouri Farm Poll, 2006 Harvey James, Agricultural Economics Mary Hendrickson, Rural Sociology University of Missouri What’s New in Sustainable Agriculture February 26, 2007 Funded by USDA grant number 2005-35618- 15672
Transcript
1
On the Distinctiveness ofFarmers of the Middle:
A Preliminary Report on the Missouri Farm Poll, 2006
Harvey James, Agricultural Economics
Mary Hendrickson, Rural Sociology
University of Missouri
What’s New in Sustainable AgricultureFebruary 26, 2007
Funded by USDA grant number 2005-35618-15672
2
3
Some background
Most U.S. farms are family farms, which the USDA defines as “proprietorships, partnerships, or family corporations that do not have hired managers”. In 2003, 98.3% of US farms were “family farms.”
Most farms have annual sales <$250,000 91.2% of US farms 96.2% of Missouri farms (2002)
Generally farms with gross annual sales between $100,000 and $250,000, although technically “not scale determined” but rather “scale related” Any farm falling “between the vertically integrated,
commodity markets and the direct markets,” but farms between $100-$250K vulnerable
Source: Kirschenmann et al, Why Worry About the Agriculture of the Middle, http://www.agofthemiddle.org, 2003; USDA ERS 2005 Family Farm Report
http://www.kelderfarm.com/
9
Why worry?
Emerging dualistic system where … Small farms focus on producing differentiated products
catering directly to consumer markets Large farms focus on the global commodity markets
“if present trends continue, [middles] farms … will likely disappear in the next decade.”
Source: Kirschenmann et al, Why Worry About the Agriculture of the Middle, http://www.agofthemiddle.org, 2003
10
Why worry?
“Farmers of the Middle” are different, but in an important way: They provide “social and environmental
benefits” “good land stewardship is a high priority”
Land stays in family Ecological knowledge is handed down
generation to generation Farmers expected to take care of land,
animals, environment, community, and provide for food security
Source: Kirschenmann et al, Why Worry About the Agriculture of the Middle, http://www.agofthemiddle.org, 2003
American Gothic, Grant Wood, 1930
11
Research questions
There is a perception and even expectation that “farmers of the middle” are different in ways important and unique to agriculture and society.
Are “farms of the middle” different from small and large farms?
If so, how? Do these farms reflect our perceptions of them as good stewards?
12
Description of study
Surveyed 3,000 Missouri farmers early 2006 from population of all farmers with total farm sales at least $10,000 in 2005 (population is 41% of all MO farms)
Stratified random sample (by farm sales) to allow comparison across groups
Heads-up postcard, two mailings 2941 surveys deliverable, 692 returned (23.5%) This report looks at agricultural producers only (519
in current sample), thus excluding landowners, etc
Dependent Variable:How unacceptable these ethical scenarios are
VariableHarmful(N=388)
Unlawful(N=410)
Bad form(N=373)
Frequency ns – –
Impossible rules – ns ns
Satisfied life ns ns ns
Control over life + + ns
Satisfied finances ns ns –
Concerned finances ns ns +
Diversification ns ns +
Age category + + ns
Church attendance ns + ns
Male – ns –
Note: Something “improves farmer ethics” (i.e., causes farmers to consider the ethical problem less acceptable) if the sign of the coefficient is positive.
37
Bottom line
Based on initial descriptive statistics, we can conclude that in some respects “farmers of the middle” are different from other farmers.
However, we cannot conclude that they have particularly strong, unique or noteworthy attitudes or inclinations with respect to environmental, socialor animal stewardship.
If anything we suspect there is a relative degree of anxiety among farmers of the middle, probably resulting from structural and economic conditions in agriculture.
38
What does this mean to you?
Do these findings reflect what you see happening in agriculture in Missouri?
Is it appropriate for us to believe that “farmers of the middle” ought to take a greater interest in ecological stewardship, community well-being or animal welfare?
Such farmers are already facing significant economic pressures resulting from industrialization, globalization, and the like. Do our perceptions that “farmers of the middle” are unique and special add to the pressures they feel?
39
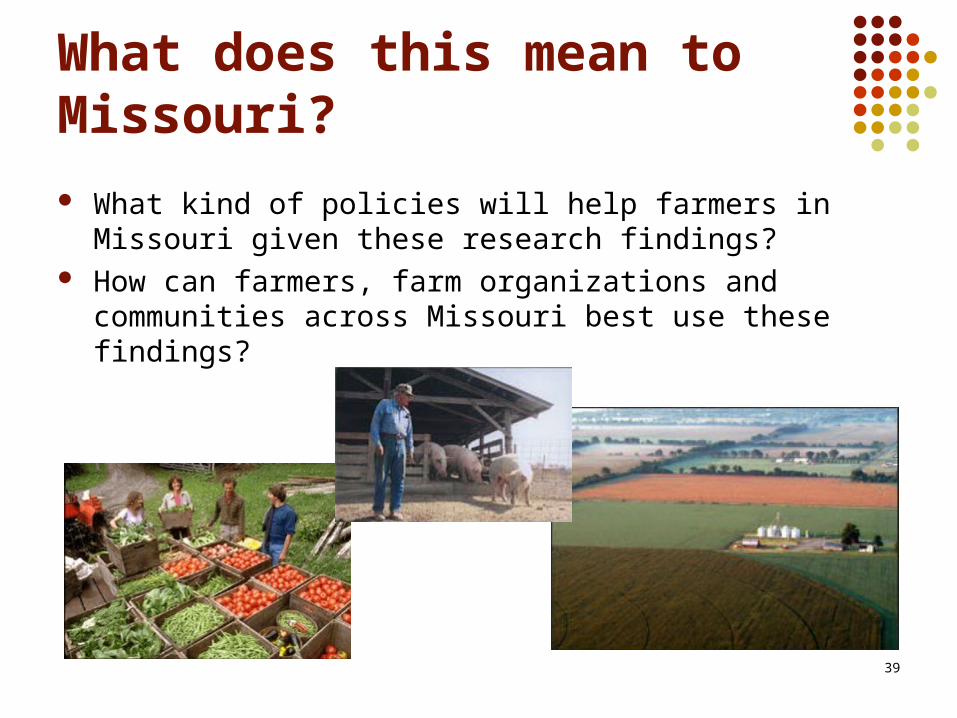
What does this mean to Missouri?
What kind of policies will help farmers in Missouri given these research findings?
How can farmers, farm organizations and communities across Missouri best use these findings?