1 ON THE NATURE AND SIGNIFICANCE OF COLLUSIVE PRICE LEADERSHIP by Leo SLEUWAEGEN (INCAP- K.U. Leuven)· ABSTRACT / With the help of a simple analytical model we are able to analyze and to further clarify the conditions for collusive price leadership as they were originally devised by Jesse Markham. Within the confines of this model we show how col- lusion increases price cost margins, but at the same time decreases concentration in the industry. INdustry and Company Analysis Program, University of Louvain. I am grateful to Raymond De Bondt, Denis de Crombrugghe, and two anonymous referees for suggestions which have considerably improved the exposition of the arguments in·this paper.
Transcript
1
ON THE NATURE AND SIGNIFICANCE OF COLLUSIVE PRICE LEADERSHIP
by
Leo SLEUWAEGEN
(INCAP- K.U. Leuven)·
ABSTRACT /
With the help of a simple analytical model we are able to
analyze and to further clarify the conditions for collusive
price leadership as they were originally devised by Jesse
Markham. Within the confines of this model we show how col-
lusion increases price cost margins, but at the same time
decreases concentration in the industry.
INdustry and Company Analysis Program, University of
Louvain. I am grateful to Raymond De Bondt, Denis de
Crombrugghe, and two anonymous referees for suggestions
which have considerably improved the exposition of the
arguments in·this paper.
2
On the nature and si ificance of collusive rice leadershi
1. Introduction
The price leadership model has recently regained a renewal
of interest among industrial economists. Research centers
around the basic problem of who will adopt the positions of
leaders and followers in the industry, and to what extent a
cartel of price leaders will be stable (see, e.g. Ono
(1978), Boyer and Moreaux (1982), d'Aspremont et al. (1983),
Donsimoni and McLeod (1984)). Also the /dynamical im-
plications of the model are the subject of intense debate
(Geroski and Jacquemin ( 1984)). However, these studies did
not always produce unequivocal results. Much of the
controversy about some of the results seems to depend on the
particular assumptions made about the behaviour of firms
-within the industry. In this connection the ongoing debates
focusing on collusive price leadership sometimes overlook
some of the basic conditions characterizing the emergence of
this type of market arrangement, as they were originally
devised by Jesse Markham (1951).
The aim of this paper is to exposit some arguments which
illustrate the importance of Markham's original conditions.
We consider this analysis necessary, because the importance
of these conditions seems not to have been fully appreciated
3
in subsequent research, as revealed by some of the comments
responding to Markham's original article (e.g. Oxtenfeldt
(1952), Lanzilotti (1957)).
In section 2 of the paper we show the effect of enforcing
collusion among the leading firms in the industry on the de
gree of monopoly power in the industry. The relationship im
plies a combined effect of two different concentration mea
sures, the concentration ratio ( Ck, k being the number of
dominant firms) and the Hirschman-Herfindahl (H) index. We
show that the explicit distinction between these two
different concentration measures is not trivial, but becomes
crucially important for highly concentrated i~dustries where
few large firms dominate the industry. In section 3 we
analyze how concentration may create incentives to collude.
However, concentration ,as a structural quantity measure, is
no exogenous determinant of performance. In section 4 we
show how concentration is endogenously determined by
oligopolistic conduct within the industry. By numerically
solving the model we then illustrate how strict enforcing of
co 11 us ion among the members of the dominant carte 1 w i 11
entail higher profits with lower concentration in the
industry.
4
In the new view on the relationship between market structure
and performance oligopolistic conduct plays a predominant
role. However, in spite of the recognition of the importance
of conduct, very few studies have analyzed the behavioural
motivations of the firms within the industry. A well known
and early exception to this observation is Stigler (1964)
who asserted that oligopolists are profit maximizers and,
consequently, will prefer the collusive solution above all
others. However, because of the tendency of individual firms
to 'chisel', i.e. to engage in secret price cutting in
order to increase individual market shares and profits, the
actual outcome - 1n the market may be different from the
collusive equilibrium. In Stigler's view the problem of
enforcing the joint profit maximizing solution is thus
considered to be an information (detection) problem. Based
upon this view, John Cubbin (1982) related the set of stable
industry price-cost margins to the degree of imperfection of
collusion, measured in terms of reaction probabilities or
retaliation lags reflecting information defects.
Although the model has more relevance for product-differen
tiated industries, it is interesting to apply Cubbin's model
to the collusive price-leadership model. Particularly, this
approach enables us to illustrate the importance of the five
conditions for the occurence of this type of oligopoly , as
they where originally devised by Jesse Markham. Apparently,
5
because of the lack of analytical tools, the importance of
some of the conditions seemed not to have been fully
appreciated by those who commented upon their relevance.
To show this, assume that there are n firms and that the k
largest dominate the industry. Denoting quantity by q and
price by p, q. = F(p) represents the global demand function
to the industry, and qc = G(p) the supply function of the
competitive fringe. The demand function facing the dominant
group can then be written as qo = q - qc = F ( p) - G ( p) .
Next define the quantities [dF(p)/dp] [p/F(p)] = and
[p/G(p)] [dG(p)/dp] = E as respectively the absolute value of
elasticity of industry demand and the elasticity of supply
of the co~petitive fringe.
Under these conditions it follows that the elasticity of de-
mand for the k largest (dominant) firms equals (see Saving
(1970)):
~D = l (~ + (1- Ck)E)
Ck
(l)
In line with Cubbin's analysis, we now assume that all lea-
ding firms believe that they can increase their profits by
lowerl.ng their price (increasing the quantity sold), and
expect that with a certain probability a others will not
react by retaliatory price reductions. The resulting
(leading firm's) price-cost margin will equal a weighted
6
combination of the (noncooperative) Cournot and perfect col-
lusive outcome with a as the weight factor:
Ai = l [a+ (l - a)soi]
~D
i = i:, ... ,k (2)
where SDi = qi/qo, firm i's share of the quantity sold by
the dominant group
Result (2) can also be obtained from a conjectural variation
model (see Clark and Davies (1982)). Without discussing the-
se different approaches here, the essence of a in the model
lays in its role ~s characterising the degree of (apparent
or implicit) collusion in the industry.
Since the n-k remaining firms of the competitive fringe act
as price-takers their corresponding Lerner index necessarily
equals zero, or Ai = 0; i =k + 1' ... ' n. By weighting the
Lerner index for the k dominant firms and the n-k remaining
firms with their respective market shares we obtain the
following measure of monopoly power for the industry:
n
A = ~ SiA i i = l
k
= aCk 2 + ~ +
( 3)
where Hk = ~ Si2 the truncated (leading firm component of i = 1
the) Hirschman-Herfindahl index. If (as Hause (1977) did)
one assumes competitive fringe firms to be very small, Hk n
7
:'1 approximately equals H = ~ s12 the ordinary Hirschman-
i = l Herfindahl index. Below we shall discuss this in more
detail.
It can easily be seen from relation (3) that with a = 1
Saving's collusive result holds, and with a = 0 Hause
(1977). Encaoua and Jacquemin's (1980) non-collusive
(Cournot) result holds. With 0 < a < 1, we have a partially
collusive equilibrium, which amounts to a weighted average
of the two extreme solutions. Moreover, for Ck approaching
one, relation (3) reduces to the basic (no competitive
fringe) oligopoly model (see Cubbin (1983)). /
With respect to the discussion which of the two
concentration measures, H (approximating Hk for k<n) or Ck-
squared, is more appropriate to explain price-cost margins,
we find that relation (3) provides a more flexible
specification, involving a weighted combination of both
measures, with a the empirically estimable weight.
Distinguishing the roles of the separate concentration
measures is not trifling, as is sometimes suggested in the
literature, but becomes crucially important to assess
industry performance for these industries where the leading
firms hold a large share of the market. The point is
illustrated in Figure 1 for the four-firm concentration
ratio.
/
8
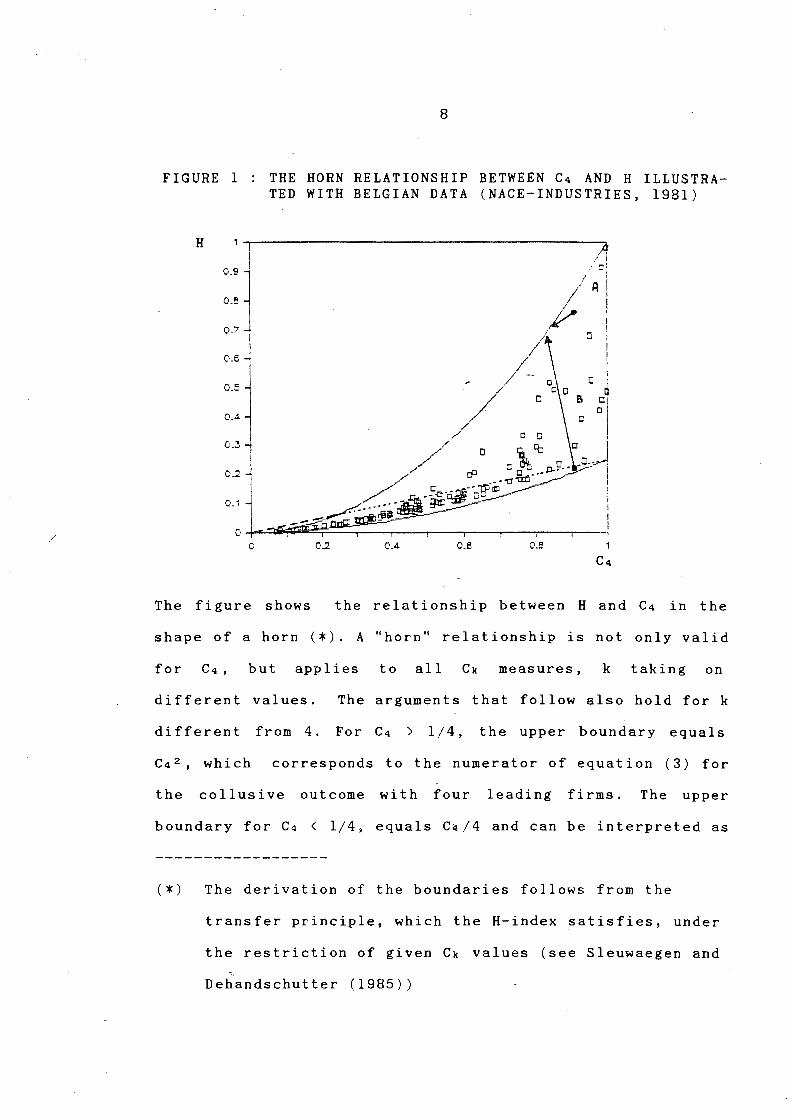
FIGURE 1 THE HORN RELATIONSHIP BETWEEN C4 AND H ILLUSTRATED WITH BELGIAN DATA (NACE-INDUSTRIES, 1981)
H
The figure shows the relationship between H and C4 in the
shape of a horn (*). A "horn" relationship is not only valid
for C4, but applies to all Ck measures, k taking on
different values. The arguments that follow also hold for k
different from 4. For C4 > 1/4, the upper boundary equals
C42, which corresponds to the numerator of equation (3) for
the collusive outcome with four leading firms. The upper
boundary for C4 < l/4, equals C4/4 and can be interpreted as
(*) The derivation of the boundaries follows from the
transfer principle, which the H-index satisfies, under
the restriction of given Ck values (see Sleuwaegen and
Dehandschutter (1985))
9
a conditional (upon C4) number equivalent H value (see
Adelman (1969)). Because of this relevance we have extended
the line over the whole range of C4 values. The lower
boundary of the horn is given by C~/4, or the H index when
all 4 leading firms hold eqt!al shares of the market. It
should be noticed that both the upper boundary
1/4) and the lower boundary are the same for H4 and H since
the maximum and minimum H assume the contribution of the
remaining n-4 firms to approach zero. For C4 < l/4 the upper
boundary of H4 is C4 2 • Clearly, for the sample of Belgian
industries displayed in figure 1 ,C4 and H are not in
approximate linear relation to each other, and hence are not
easily exchange~ble as explanatory variables for pric~-cost
margins .
3. Incentives to collude.
Recognizing that the effect of collusion on industry profi-
tability depends on the oligopolistic structure of the in-
dustry this, however, involves only one prerequisite con-
dition for collusive price leadership to emerge and to be-
come effective. In an early contribution to the subject
Jesse Markham (1951) devised five different conditions for
collusive price leadership to come about (1951). These con-
ditions are (i), the industry must be tightly oligopolistic,
(ii) there must be effective barriers to entry in the
10
industry, (iii) products are to be close substitutes, (iv)
demand must be relatively inelastic and (v) individual cost
curves must be sufficiently similar.
In two important comments, O~tenfeld (1952) and Lanzillotti
(1957) argued that these conditions are not straightforward
to interpret. In the opinion of these authors, they are par
ticularly restrictive and at the same time, incomplete in
their capacity of defining a unique set of equilibrium con
ditions for collusive price-leadership.
However, without spelling out all the details of these
criticisms, it seems to us that the commenters did not fully
exploit Markham's arguments leading to /the right
interpretation of the term "prerequisite conditions" As
the real source of collusive arrangement Markham emphasized
the "identity between the long term interests of each
individual firm and those of the industry as a whole". It is
from this basic provision that the relevance of the five
more specific conditions should be interpreted.
The congruence of the individual firm's interests with those
of the industry will be closer the more concerted action in
the indus try does result in 1 arger benefits. In Markham's
argumentation, these potential profits constitute the hig
hest incentive for firms to collude. Thus one should analyse
the significance of the five conditions in their relation
ship with these potential profits. As we shall demonstrate,
11
formula (3) together with Figure 1 provide two convenient
tools to do so.
The denominator of formula (3) implies that industry profits
will be larger the lower is industry demand elasticity
(condition iv) and the higher are barriers to entry which
limit the magnitude of the competitive fringe supply elas
ticity e (condition ii). Also the interpretation of condi
tion (iii) poses no particular problems. When the firm's
product is sufficiently differentiated from rivals, price
interdependence is low and the firm shapes its own industry.
The real controversy around Markham's conditions arose from
conditions (i) and (v): the oligopolistic /structure and the
similarity of the cost curves of the firms in the industry.
Therefore, the analysis presented here may be most helpful
with respect to these two conditions.
Figure (1) shows that for low levels of concentration, non
coopers t i ve ( Cournot) behaviour corresponding to the Hk-
index, or collusive behaviour corresponding to Ck2, makes
little difference for industry performance. According to
formula (3) it is only in the wide zones of the horn, for
high Ck values, that collusion can yield these high industry
returns compared to Cournot behaviour. The emphasis in the
previous sentence is on "can" since the outcome is really
dependent upon the different positions of the firms. If the
shares of the large firms are very unequally distributed
...
12
resulting in a high value of the Hk index within the horn,
Cournot or collusive behaviour would, following formula
(3), make little difference in terms of industry returns. In
some particular cases, most 1 ike 1 y to occur in the very
high concentration zones collusion may even decrease
industry returns, provided that collusion makes the
concentration ratio to decrease (as will be formally shown
in the next paragraph).
From Figure (1) we can derive, however, that the phenomenon
of negative collusion effects on industry price cost mar
gins, is only likely to occur in these industries with high
Hk values for given Ck values. This ~s illustrated with ar
row A (lowest Hk = H index possible) and arrow B (high Hk
index) indicating the possible effects of collusion. Case A
implies a very large increase in industry profits while for
case B, collusion would imply a decrease in industry profits
which the dominant firm would never accept. As we shall
formally show in the next sect ion, the height of the Hk
index under Cournot depends crucially upon the efficiency
differentials among the k firms. If industrial firms cost
structures are similar the (Ck-conditional) Hk index will be
low and potential industry collusion rewards high. Thus, as
with the degree of concentration, the real meaning of Jesse
Markham's original collusion condition of "sufficiently
similar cost curves" is again analytically derivable from
both figure (1) and formula (3).
13
Formally, the effect of going from Cournot to collusion can
be analyzed by differentiating (3) with respect to a. This
differentiation can be decomposed as follows
n
sA = 6>.,
!dsi=O
+ ~ 6>.,
\da=O
6Si
Sa a-a. i = 1 6Si a-a ( 4)
As long as a the degree of collusion, would not affect the
sizes of firms within the industry (dsi = 0), the effect of
increasing collusion would simply be:
Ck 2 - Hk > 0 -··-··-·----·--·-·-·--/ ( 5)
Jl + E(l-Ck)
However, since collusive behaviour implies price increases,
and E > 0, Ck/ a is necessarily negative. To what extent Ck
and in what directions Hk will move with collusion will of
course depend on what -firm wi 11 set which price. The final
outcome of collusion on industry price cost margin will
depend on these concentration effects.
It should be noticed here that the results do not oppose
the concept of a critical concentrical ratio i.e. the
lowest possible concentration ratio inducing firms, (because
of substantial possible profit gains) to collude.
However, instead of considering this critical ratio as a
fixed magic number for all industries, it follows from the
14
analysis that the existence and magnitude of such-a ratio is
dependent upon other structural conditions , such as cost
structure differences among firms and, as will be discussed
in the next section, the numbers of leading firms in the
industry.
The increasing incentives to collude for larger values of
Ck, causing a to depend positively upon this last variable,
is consistent with some recent empirical findings (see
C 1 arke, Davies and Waterson ( 1984)). However, to properly
test our collusion hypothesis a should be related to the
difference between Ck 2 resulting from collusion and the H
under Cournot behaviour./
4. Industrial concentration under collusive rice leadershi
~1:-~~opo!x
As Clarke and Davies (1982) have shown for the basic oli-
gopoly model, the price leadership oligopoly model discussed
above implies a joint determination of both price-cost mar-
gin and concentration within the dominant group and the com-
petitive fringe.
Following their analysis, but replacing ~ by ~o (the
industry demand elasticity by the demand elasticity for the
15
k leading firms) and n by k (the number of firms in the
industry by the number of leading firms), it follows that
the truncated Herfindahl index for the leading firms equals:
H~c = ( 1 + rl - k(J..ID - a) 12 vc 2 ) . C1t 2 (6) k l J
.... k
where vc2 is the coefficient of variation of marginal costs
in the group of leading firms. Similarly, since competitive
fringe firms are price takers, it follows that size
differences will reflect efficiency differentials or not
exist if technologies are similar for fringe firms, with the
corresponding characteristics summarized in their supply
elasticity. Accepting the last assumption, Hn-k, the H index
component for the fringe firms, is easily computed and shows
how Hn- k becomes very small for high values of Ck or high
numbers of fringe firms.
n
Hn- k = ~ s i 2 = i} .. =:g~J~ ( 7) i = It + l n-k
Since H = H~c + Hn-k, it follows from the previous arguments
that, under collusive price leadership, the H dispersion
within the horn for a given C~c value can be explained by the
number of leading and fringe firms in the industry,
efficiency differentials and the degree of collusion amongst
the leading firms.
16
However, this leaves us with the problem of determiriing Ck,
the joint market share held by the dominant k firms. Given
the marginal cost functions and equilibrium condition (2),
together with the market demand constraint, it is in prin
ciple possible to calculate the market share of each firm.
Hence, concentration ratios for both the dominant group and
the competitive fringe firms can be calculated and related
to the set of parameters contained in these equations. How
ever, because of the required non-linear form of the cost
functions of the competitive fringe firms, the mathematics
involved may become very tedious, and not always lead to
clear explic~t relationships. To illustrate this, we shall
take here the most simple example and assume that marginal
costs are proportional to output, and identical for all
firms belonging to the competitive fringe: mcj = ac qj,
j=k+l, ... ,n, implying a unitary supply elasticity (E = 1).
For convenience, we shall, adopt a similar assumption for
the dominant group: mci = ao qi, i=l, ... , k. Only an effi
ciency difference given by the ratio of the slopes of the
respective marginal cost functions 0 = ao/ac, is assumed to
constitute the difference between the two groups. In ad
dition to its analytical tractability this simple model with
cost equality among the leading firms has the advantage to
characterize the most favourable cost condition for collu
sive price leadership as discussed in the previous section.
17
This quality of the model enhances the significance of the
results which will be obtained hereafter.
Under the assumptions made, relations (1) and(2) lead to:
,Ai = P..L ... - mCi = Pi
1 - ':!.9L. = Cqj
aCk + ... L~-----=---~~---~-.L J.l + ( 1 - Ck )
i = l, ... ,k j = k+ 1, ..• , n
Summing Ai over all dominant firms yields:
k
~ Ai = k - (n-k) .0. Ck = t~-~ ! .. L! .... : ...... ~..!..J ...... g_~.t .. i=l 1 - Ck J.l + ( 1 - Ck )
(8)
(9)
Equality (9) is a good illustration of how (marginal) cost
disadvantage variables between groups of firms are related
to industry price cost margins. In the model this cost
disadvantage ratio plays a crucial role for the existence of
the dominant group. The continuous efforts of dominant firms
to create and to take advantage of these differentials
coupled to the problem of enforcing collusion and sharing
benefits with all members of the industry serves as
background for the model presented here (see in this
connection the various arguments about dominant firm
behaviour offered by Geroski and Jacquemin (1984)).
Subtracting the members of the last equality in (9) from
each other we obtain an implicit function F(Ck, k, n, 0)
from which Ck can be solved. (With cost equality within both
18
groups of firms, Hk equals Ck 2 /k and Hn-k= (l-Ck)2/(n-k)).
From this implicit function follows that Ck varies in the
same way as (i) the degree of efficiency attained by the do-
minant firms versus fringe firms (inversely measured by 0)
(ii) the number of dominant firms; it varies inversely with
(i) the degree of implicit collusion, (ii) the number of
(fringe) firms. These effects follow from the following
differentiations of (9):
Defining F'ck = 8F = 8Ck
- (n-k) .0. 1 (l-Ck)2
-·····-··--J.P. ............ ~ ...... !) ··-········ .. [ k a + ( 1-a ) ] < 0
1-1 -~-..... L~.:.S:.~:r.J.... . > o if (a+l)Ck < IJ.+l
> F'ck <
0 Ck ······-·-···--····· .. ·····
1 - Ck < 0 F'ck
(k- 1) Ck
8 c k = -·-·1:!: ... ~ .. -J !. ... : .... g_lc) < 0 Ba F'ck
(10)
(11)
( 12)
(13)
For the aim of this paper, the interesting result of the de-
rivations is the negative effect of a on the concentration
of the k largest firms in (13). It implies the more
/
19
perfect collusion is, the smaller will be market share held
by the dominant firms in the industry. From equation (13) it
follows (given some broad assumptions about other para-
meters) that the effect on Ck of increased collusive
behaviour will be larger the greater k: the number of
leading firms.
However, to evaluate this latter effect in connection with
industry profitability, it should be ~erified how increasing
k values change Ck, the concentration ratio and Hk, the
corresponding (minimum) Hirschman-Herfindahl index
Ck2/k). It may be inspected that for low values
according to the sign condition in formula (11)
( H k = of a,
these
effects do increase potential collusion benefits. The
effects of enlarging k, the number of leading firms included
in the concentration ratio, for the shape of the horn is
illustrated in Figure 2. The values of the truncated Hk
index corresponding to the "equal cost" ex amp 1 e coincide
with the lower boundary of the hornr which shift downwards
for larger k values. Thus, for all given Ck values and with
a equal to zero, the profit co 11 us ion potential is 1 ar ger,
the larger is k, the number of leading companies.
A further illustration of these effects can be obtained from
numerically solving formula (9) for different values of k
20
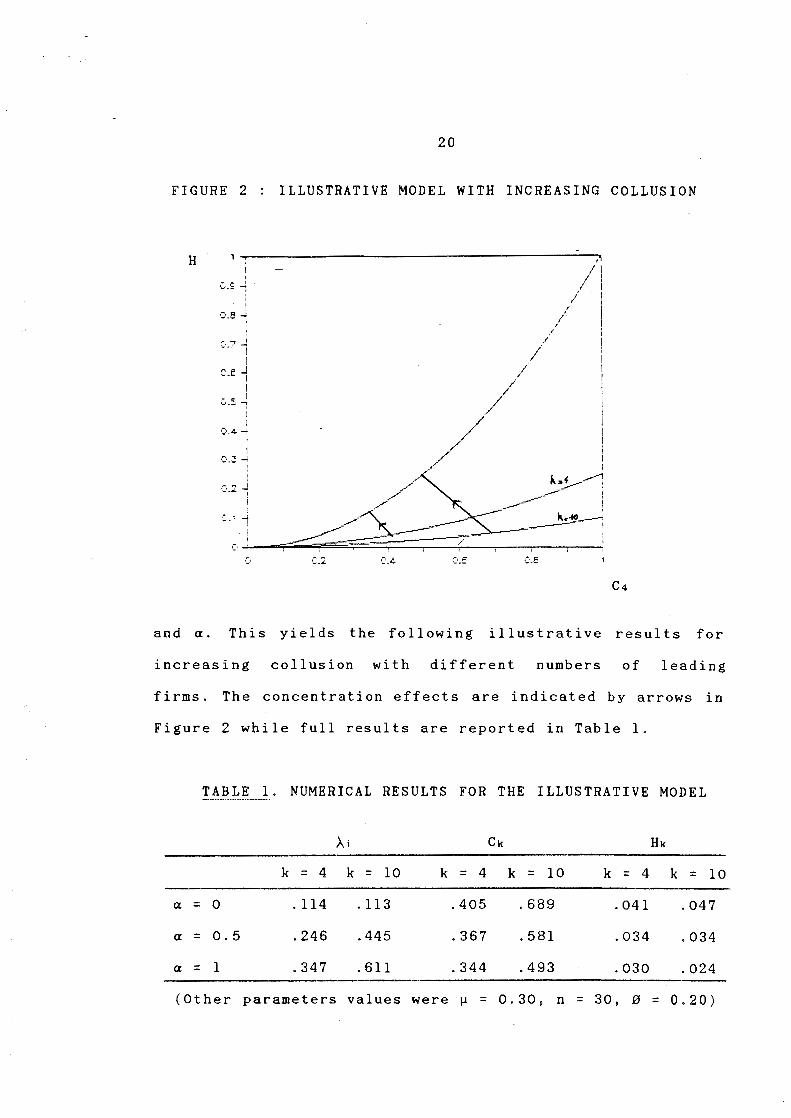
FIGURE 2 ILLUSTRATIVE MODEL WITH INCREASING COLLUSION
H I
..:.·~£ -1 -;
- I 0.8 -i
I I
' - i \./_"1 l
o_e -j ' ' I
.- c ' V--'-: ' ' l
0.4 -t I
i 0.~ -4
I
Q.: ~
'
0.4 C.E
and a. This yields the following illustrative results for
increasing collusion with different numbers of leading
firms. The concentration effects are indicated by arrows in
Figure 2 while full results are reported in Table 1.
TABLE 1. NUMERICAL RESULTS FOR THE ILLUSTRATIVE MODEL
Ai Ck Hk
k = 4 k = 10 k = 4 k = 10 k = 4 k = 10
a = 0 .114 .113 .405 .689 .041 .047
a = 0.5 .246 .445 .367 .581 .034 .034
a = 1 .347 .611 .344 .493 .030 .024
(Other parameters values were ll = 0.30, n = 30, 0 = 0.20)
/
21
From Table 1 we may inspect that the gains from collusion
are highest for the group with ten leading firms which show
the highest increase in individual price-cost margins but
also the steepest decrease in concentration. These movements
are reflected in both the length and inclination of the ar
rows drawn in Figure 2.
5. Summar and Conclusion
The present paper analyzed the effects of going from non
cooperative Cournot behaviour to collusive behaviour within
a group of leading firms in an industry that also includes
a fringe of firms acting, as price takers. The study
confirmed the relevance of Jesse Markham's collusion condi-
tions by formally showing how differences
fit mar gins under co ll us ion versus
in industry pro-
Cournot behaviour
increase following the height Df the concentration ratio of
the k leading firms and the similarity of their cost curves.
These differences were analyzed within the framework of an
existing horn shaped relationship between the concentration
ratio and the Hirschman-Herfindahl index. As potential gains
from collusion, the industry profit margin differences were
interpreted to constitute the strongtest incentives for
dominant firms to collude. By linking up the results with
the concept of a critical concentration ratio, the analysis
22
was able to give some more contents to the latter concept.
Finally, it was shown how increasing collusive behaviour
within the group of leading firms leads to lower
concentration ratios in the industry.
The analysis clearly pointed out the theoretical relevance
of considering more than just one concentration measure in
assessing industry performance. It would be interesting to
know the empirical consequences of this theoretical
observation. This research would undoubtedly yield some
useful results for anti-trust policy. In the merger
guidelines recently issued by the U.S. Department of Justice
the choice of concentration measure as preliminary
indicator of market power showed up as an important matter.
23
6. References
Adelman, M.A., 1969, Comment on the Measure as a Numbers Equivalent, Review Statistics, 51, 99-101.
'H' of
Concentration Economics and
d'Aspremont, C., A. Jacquemin, J. Gabszewicz, and J. Weymark, 1983, On the Stability of Collusive Price Leadership, Canadian Journal of Economics, 16, 17-25.
Boyer, M. and M. Moreau:x, 1983, Distribution des roles et espaces des strategies dans la theorie du duopole de Steckelberg, Cahier 8333, Universite de Montreal.
Clarke, H. and S.W. Davies, 1982, Market Structure and Price Cost Margins, Economica, 49, 277-287.
Clarke, H., Davies, S. and Waterson, M., The ProfitabilityConcentration relation : Market Power or Efficiency?, Journal of Industrial Economics, 32, 435-450.
Cubbin, J., 1983, Apparent Collusion and Conjectural Variations in Differentiated Oligopoly, International Journal of Industrial Organisation, 1, 155-163.
Dicks on, V. A. , Concentration,
1981, Conjectural Variation Elasticities and Economic Letters, 281-285.
Donsimoni, M.-P., P. Geroski and A. Jacquemin, 1984, Concentration Indices and Market Power : Two Views, Journal of Industrial Economics, 32, 429-434.
Dons imon i, M.-P. and McLeod B. , Stab 1 e Leadership, Paper presented at the -Eleventh Annual Conference, E.A.R.I.E., Fontainebleau, vol. III, 93-108.
Encaoua, D. and A. Jacquemin, 1980, Degree of Monopoly, Indices of Concentration and Threat of Entry, International Economic Review, 21, 87-106.
Gerosk i, P. A. , 1983, Some Reflect ions on the Theory and Application of Concentration Indices, International Journal of Industrial Organization, 1, 79-94.
Geroski, P.A. Their Alleged Organization,
and A. Decline,
2, 1-28.
Jacquemin, 1984, Dominant Firms and International Journal of Industrial
Hausse, J., 1977, The Measurement of Concentrated Industrial Structure and the Size Distribution of Firms, Annals of Economic and Social Measurement, 6, 73-107.
24
Lanzillotti, R.F., 1957, Competitive Price Leadership A Critique of Price Leadership Models, Review of Economics and Statistics, 39, 56-64.
Markham , J . , 19 51 , The Nat u r e and Leadership, American Economic Review,
Significance 41, 891-905.
of Price
Oxtenfeldt, A., 1952, Pro~essor Markham on Price Leadership, American Economic Review, 42, 380-384.
Saving, T., 1970, Concenrtation Ratios Monopoly, International Economic Review,
and the Degree 11, 139-145.
of
Sleuwaegen, L., 1983, Multinational Enterprises, Industrial Concentration and the Degree of Monopoly, Paper presented at the lOth EARIE Conference, August 23-25, Bergen, Norway.
Sleuwaegen, L. and W. Dehandschutter, 1985, The Critical Choice Between the Concentration Ratio and the H-Index in Assessing Industry Performance, pnderzoeksrapport 8505, University of Louvain.


![1 Nature, Significance and Scope of Financial Managementsauda.com/companion/pdf/cs/Professional/Sample Chapter/New Syllab… · [Chapter 1] Nature, Significance and Scope of ... O](https://static.documents.pub/doc/80x56/5ac922117f8b9aa1298cd4f4/1-nature-significance-and-scope-of-financial-chapternew-syllabchapter-1-nature.jpg)


