30
OSPF Monitor - NSDI 2004 1 OSPF Monitor Architecture, Design and Deployment Experience Aman Shaikh Albert Greenberg AT&T Labs - Research NSDI 2004
| Date post: | 22-Dec-2015 |
| Category: |
Documents |
| Upload: | clyde-sparks |
| View: | 220 times |
| Download: | 2 times |
OSPF Monitor - NSDI 2004 1
OSPF Monitor Architecture, Design and Deployment Experience
Aman Shaikh
Albert Greenberg
AT&T Labs - Research
NSDI 2004

OSPF Monitor - NSDI 2004 2
Objectives for OSPF Monitor• Real-time analysis of OSPF behavior
– Trouble-shooting, alerting, validation of maintenance– Real-time snapshots of OSPF network topology
• Off-line analysis– Post-mortem analysis of recurring problems– Generate statistics and reports about network
performance– Identify anomaly signatures– Facilitate tuning of configurable parameters– Improve maintenance procedures– Analyze OSPF behavior in commercial networks
OSPF Monitor - NSDI 2004 3
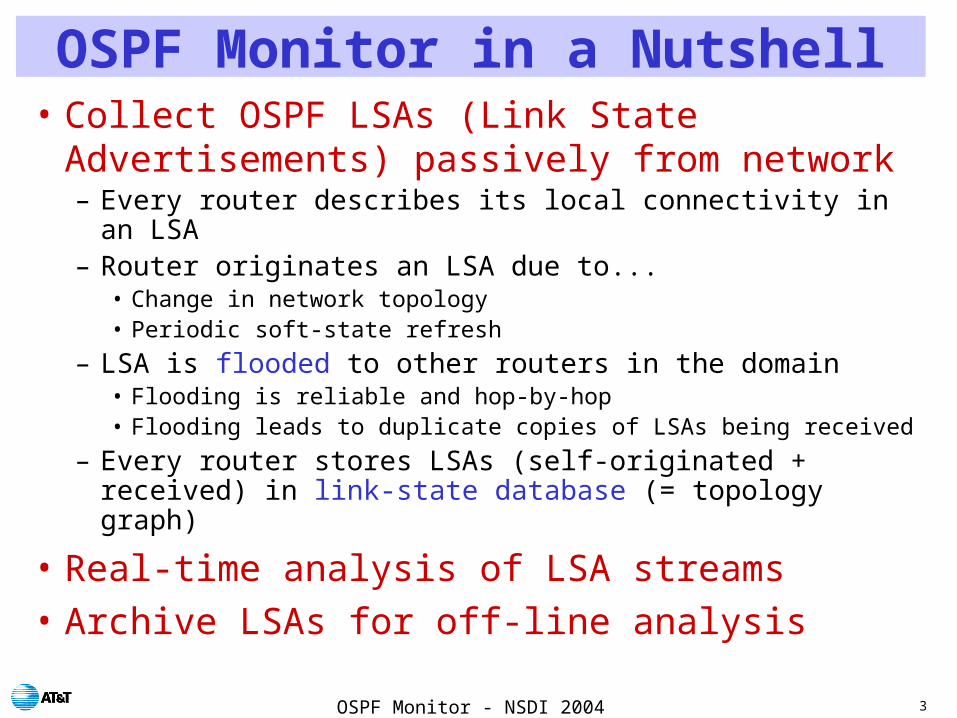
OSPF Monitor in a Nutshell• Collect OSPF LSAs (Link State Advertisements)
passively from network– Every router describes its local connectivity in an LSA– Router originates an LSA due to...
• Change in network topology• Periodic soft-state refresh
– LSA is flooded to other routers in the domain• Flooding is reliable and hop-by-hop• Flooding leads to duplicate copies of LSAs being received
– Every router stores LSAs (self-originated + received) in link-state database (= topology graph)
• Real-time analysis of LSA streams
• Archive LSAs for off-line analysis
OSPF Monitor - NSDI 2004 4
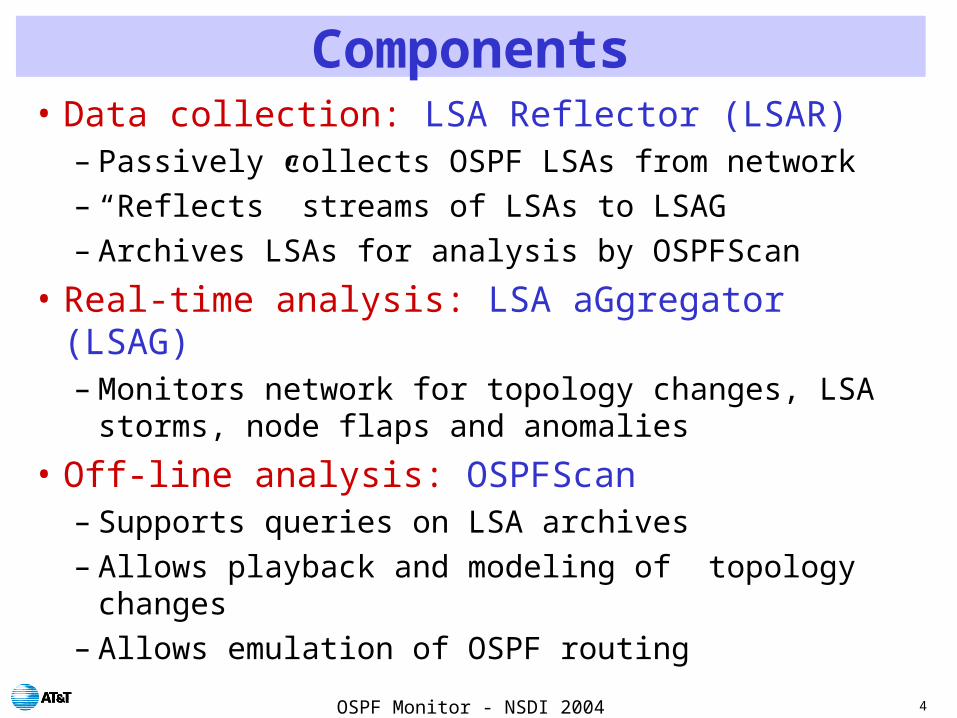
Components• Data collection: LSA Reflector (LSAR)
– Passively collects OSPF LSAs from network– “Reflects” streams of LSAs to LSAG– Archives LSAs for analysis by OSPFScan
• Real-time analysis: LSA aGgregator (LSAG)– Monitors network for topology changes, LSA storms,
node flaps and anomalies
• Off-line analysis: OSPFScan– Supports queries on LSA archives– Allows playback and modeling of topology changes– Allows emulation of OSPF routing

OSPF Monitor - NSDI 2004 5
Example
Area 0Area 1 Area 2
Real-time Monitoring
LSAG
“Reflect” LSA
LSA archive
LSAR 1
“Reflect” LSA
LSAR 2
OSPFScan
Off-line Analysis
replicateLSA archive LSA archive
OSPF Network
LSAsLSAsLSAs
LSAs LSAs LSAs
TCP Connection
OSPF Monitor - NSDI 2004 6
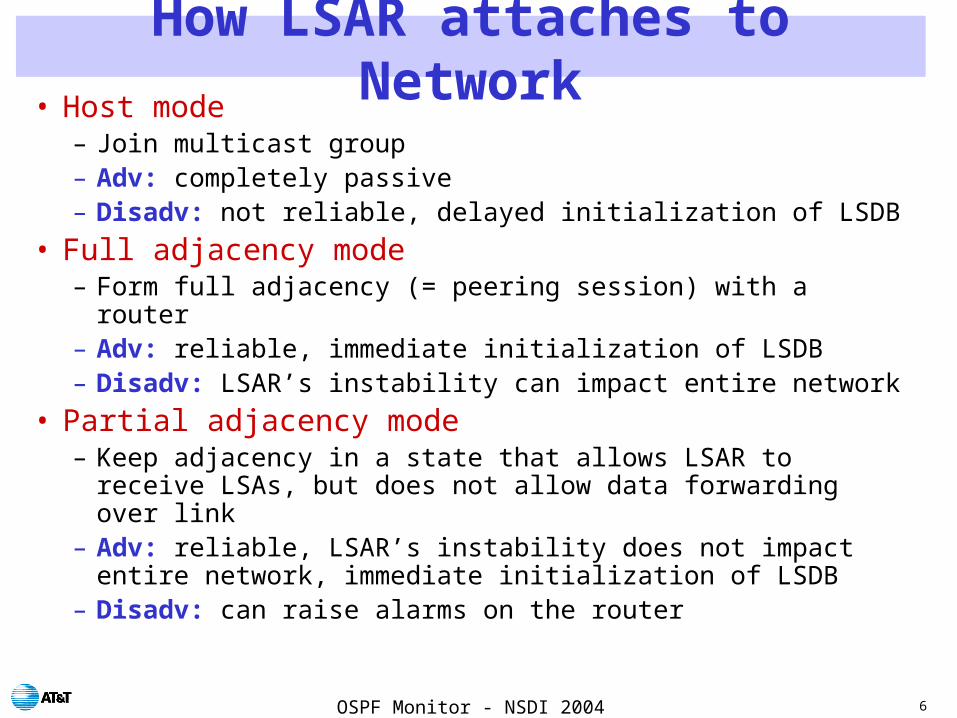
How LSAR attaches to Network• Host mode
– Join multicast group– Adv: completely passive– Disadv: not reliable, delayed initialization of LSDB
• Full adjacency mode– Form full adjacency (= peering session) with a router– Adv: reliable, immediate initialization of LSDB– Disadv: LSAR’s instability can impact entire network
• Partial adjacency mode– Keep adjacency in a state that allows LSAR to receive LSAs,
but does not allow data forwarding over link– Adv: reliable, LSAR’s instability does not impact entire
network, immediate initialization of LSDB– Disadv: can raise alarms on the router
OSPF Monitor - NSDI 2004 7
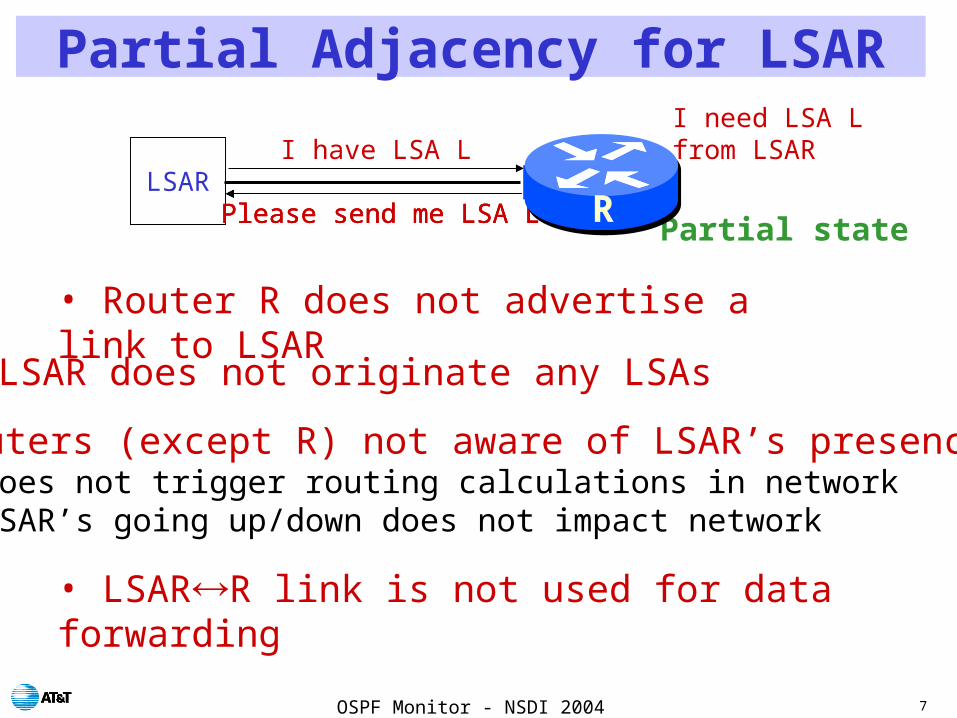
Partial Adjacency for LSAR
LSAR
Partial state
I have LSA L
Please send me LSA LPlease send me LSA LPlease send me LSA L
I need LSA L from LSAR
• LSARR link is not used for data forwarding
R
• Router R does not advertise a link to LSAR
• Routers (except R) not aware of LSAR’s presence• Does not trigger routing calculations in network• LSAR’s going up/down does not impact network
• LSAR does not originate any LSAs
OSPF Monitor - NSDI 2004 8
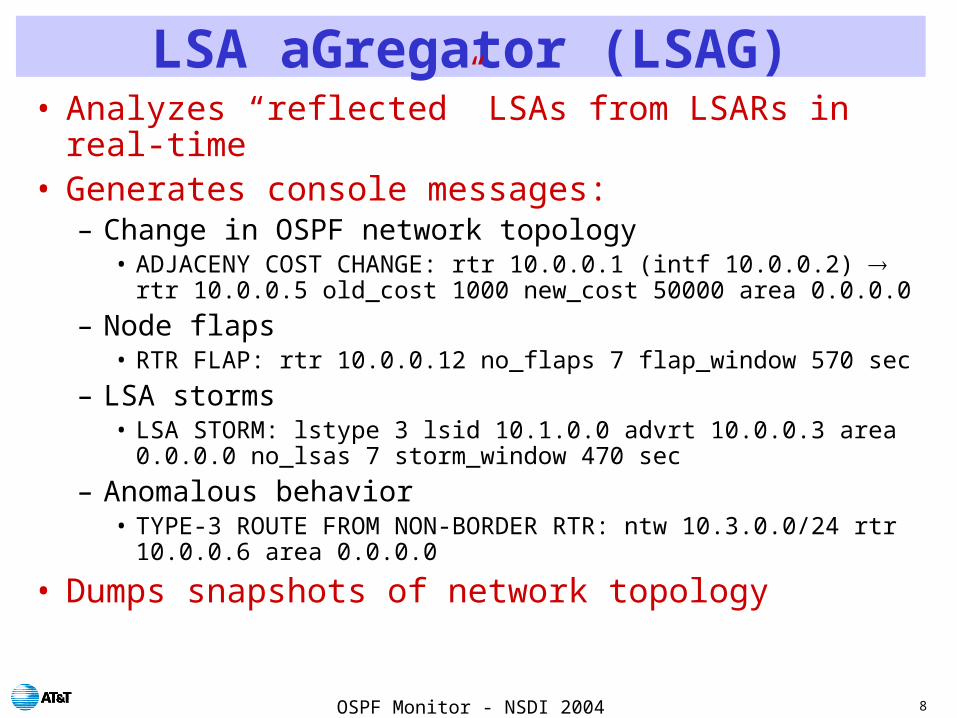
LSA aGregator (LSAG)• Analyzes “reflected” LSAs from LSARs in real-time• Generates console messages:
– Change in OSPF network topology• ADJACENY COST CHANGE: rtr 10.0.0.1 (intf 10.0.0.2) rtr
10.0.0.5 old_cost 1000 new_cost 50000 area 0.0.0.0
– Node flaps• RTR FLAP: rtr 10.0.0.12 no_flaps 7 flap_window 570 sec
– LSA storms• LSA STORM: lstype 3 lsid 10.1.0.0 advrt 10.0.0.3 area 0.0.0.0 no_lsas
7 storm_window 470 sec
– Anomalous behavior• TYPE-3 ROUTE FROM NON-BORDER RTR: ntw 10.3.0.0/24 rtr
10.0.0.6 area 0.0.0.0
• Dumps snapshots of network topology

OSPF Monitor - NSDI 2004 9
OSPFScan• Tools for off-line analysis of LSA archives
– Parse, select (based on queries), and analyze
• Functionality supported by OSPFScan– Classification of LSA traffic
• Change LSAs, refresh LSAs, duplicate LSAs
– Emulation of OSPF Routing• How OSPF routing tables evolved in response to network changes
• How end-to-end path within OSPF domain looked like at any instance
– Modeling of topology changes• Vertex addition/deletion and link addition/deletion/change_cost
– Playback of topology change events
– Statistics and report generation
OSPF Monitor - NSDI 2004 10
Performance Evaluation• Performance of LSAR and LSAG through lab
experiments– LSAR and LSAG are key to real-time monitoring
• How performance scales with LSA-rate and network size

OSPF Monitor - NSDI 2004 11
Experimental Setup
LSALSA
PC
ZebraOSPF adjacency
TCP connection
SUT
LSAR
LSAG
TCP connection LSA
LSA
Emulated topology
LSA
Measure LSA pass-through time for LSAR
Measure LSA processing time for LSAG

OSPF Monitor - NSDI 2004 12
Methodology• Send a burst of LSAs from Zebra to LSAR
– Vary number of LSAs (l) in a burst of 1 sec duration
• Use of fully connected graph as the emulated topology– Vary number of nodes (n) in the topology
• Performance measurements– LSAR performance: LSA “pass-through” time
• Zebra measures time difference between sending and receiving an LSA from LSAR
– LSAG performance: LSA processing time• Instrumentation of LSAG code

OSPF Monitor - NSDI 2004 13
LSAR Performance
Mean LSA pass-through time (LSAR) v/s burst-size
0
0.1
0.2
0.3
0.4
0.5
0.6
0.7
0.8
0.9
50 100 150 200 250 300 350 400 450 500
Number of LSAs per burst
Tim
e (
se
co
nd
s)
n = 100, LSAR + LSAGn = 50, LSAR + LSAGn = 100, LSAR onlyn = 50, LSAR only
OSPF Monitor - NSDI 2004 14
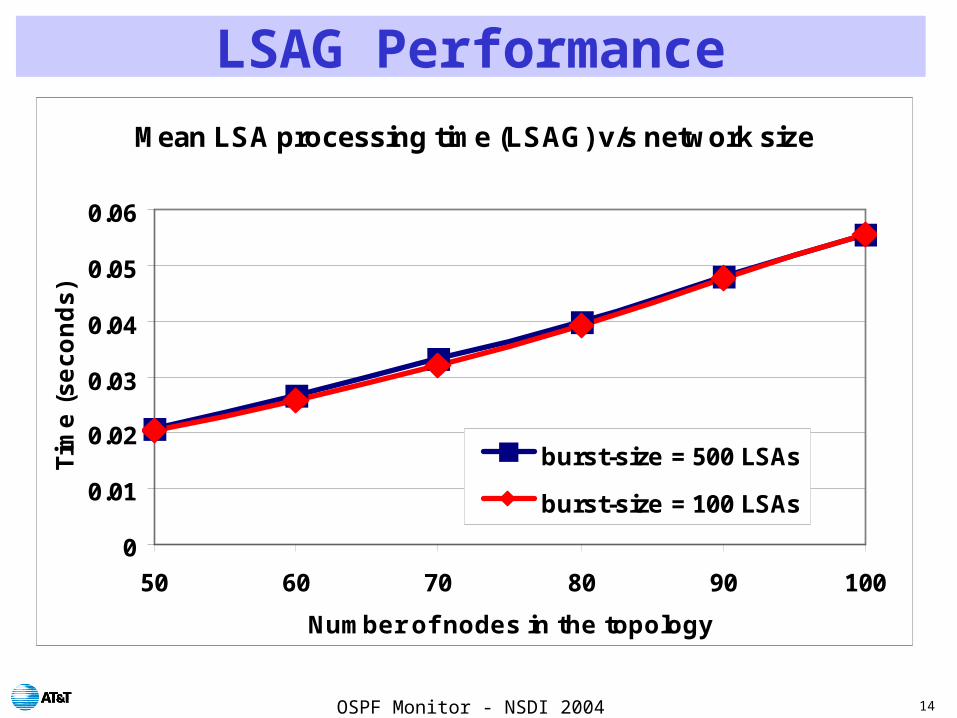
LSAG Performance
Mean LSA processing time (LSAG) v/s network size
0
0.01
0.02
0.03
0.04
0.05
0.06
50 60 70 80 90 100
Number of nodes in the topology
Tim
e (
se
co
nd
s)
burst-size = 500 LSAs
burst-size = 100 LSAs

OSPF Monitor - NSDI 2004 15
Deployment• Tier-1 ISP network
– Area 0, 100+ routers; point-to-point links– Deployed since January, 2003– LSA archive size: 8 MB/day– LSAR connection: partial adjacency mode
• Enterprise network– 15 areas, 500+ routers; Ethernet-based LANs– Deployed since February, 2002– LSA archive size: 10 MB/day– LSAR connection: host mode

OSPF Monitor - NSDI 2004 16
LSAG in Day-to-day Operations• Generation of alarms by feeding messages into
higher layer network management systems– Grouping of messages to reduce the number of
alarms– Prioritization of messages
• Validation of maintenance steps and monitoring the impact of these steps on network-wide OSPF behavior– Example:
• Network operators use cost-out/cost-in of links to carry out maintenance
• A “link-audit” web-page allows operators to keep track of link costs in real-time
OSPF Monitor - NSDI 2004 17
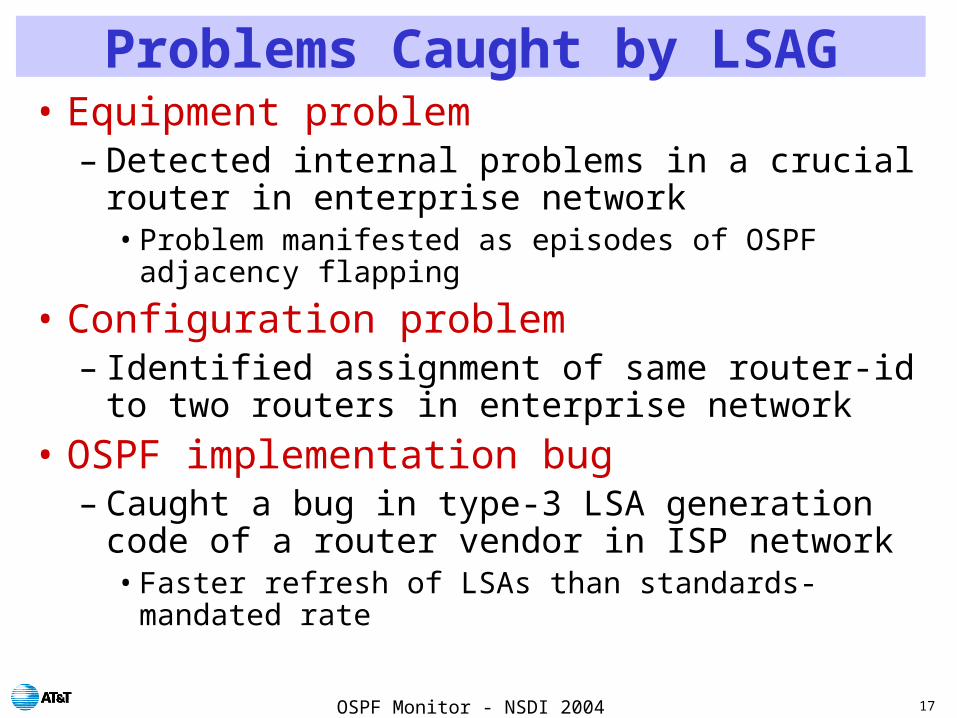
Problems Caught by LSAG• Equipment problem
– Detected internal problems in a crucial router in enterprise network• Problem manifested as episodes of OSPF adjacency
flapping
• Configuration problem– Identified assignment of same router-id to two routers
in enterprise network
• OSPF implementation bug– Caught a bug in type-3 LSA generation code of a
router vendor in ISP network• Faster refresh of LSAs than standards-mandated rate
OSPF Monitor - NSDI 2004 18
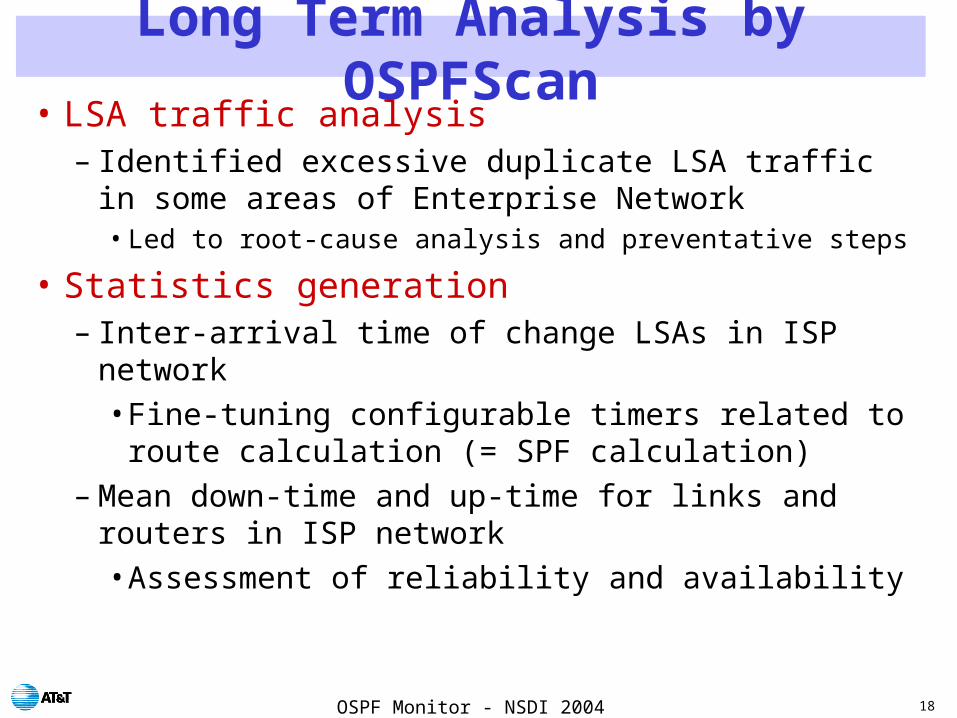
Long Term Analysis by OSPFScan• LSA traffic analysis
– Identified excessive duplicate LSA traffic in some areas of Enterprise Network• Led to root-cause analysis and preventative steps
• Statistics generation– Inter-arrival time of change LSAs in ISP network
• Fine-tuning configurable timers related to route calculation (= SPF calculation)
– Mean down-time and up-time for links and routers in ISP network• Assessment of reliability and availability
OSPF Monitor - NSDI 2004 19
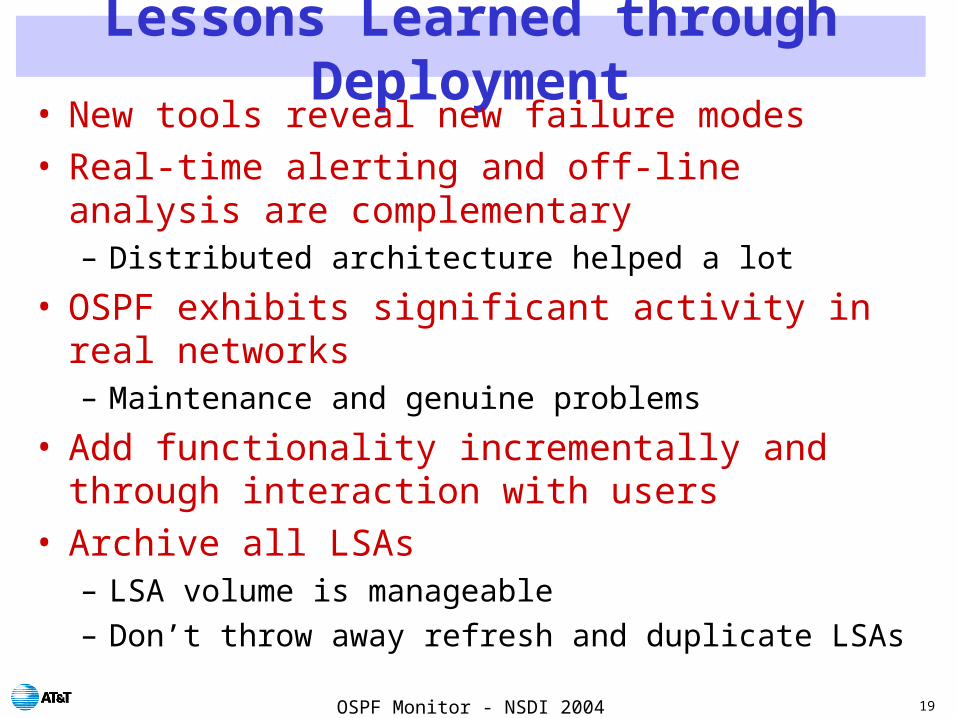
Lessons Learned through Deployment• New tools reveal new failure modes• Real-time alerting and off-line analysis are
complementary– Distributed architecture helped a lot
• OSPF exhibits significant activity in real networks– Maintenance and genuine problems
• Add functionality incrementally and through interaction with users
• Archive all LSAs– LSA volume is manageable
– Don’t throw away refresh and duplicate LSAs
OSPF Monitor - NSDI 2004 20
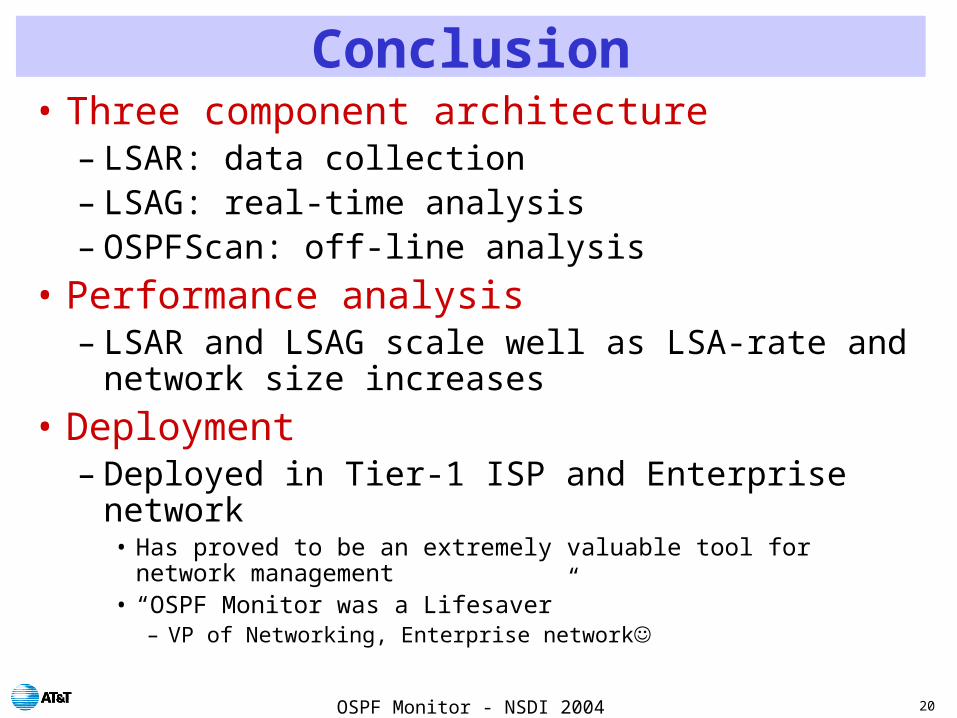
Conclusion• Three component architecture
– LSAR: data collection– LSAG: real-time analysis– OSPFScan: off-line analysis
• Performance analysis– LSAR and LSAG scale well as LSA-rate and network
size increases
• Deployment– Deployed in Tier-1 ISP and Enterprise network
• Has proved to be an extremely valuable tool for network management• “OSPF Monitor was a Lifesaver”
– VP of Networking, Enterprise network
OSPF Monitor - NSDI 2004 21
Future Work• Real-time analysis
– Correlation with other fault and performance data for more meaningful alerting
– Prioritization of alerts
• Off-line analysis– Correlation with other data sources
• Work already underway: BGP, fault, performance
– Identification of problem signatures and feeding them into real-time component for problem prediction
OSPF Monitor - NSDI 2004 22
Backup Slides
OSPF Monitor - NSDI 2004 23
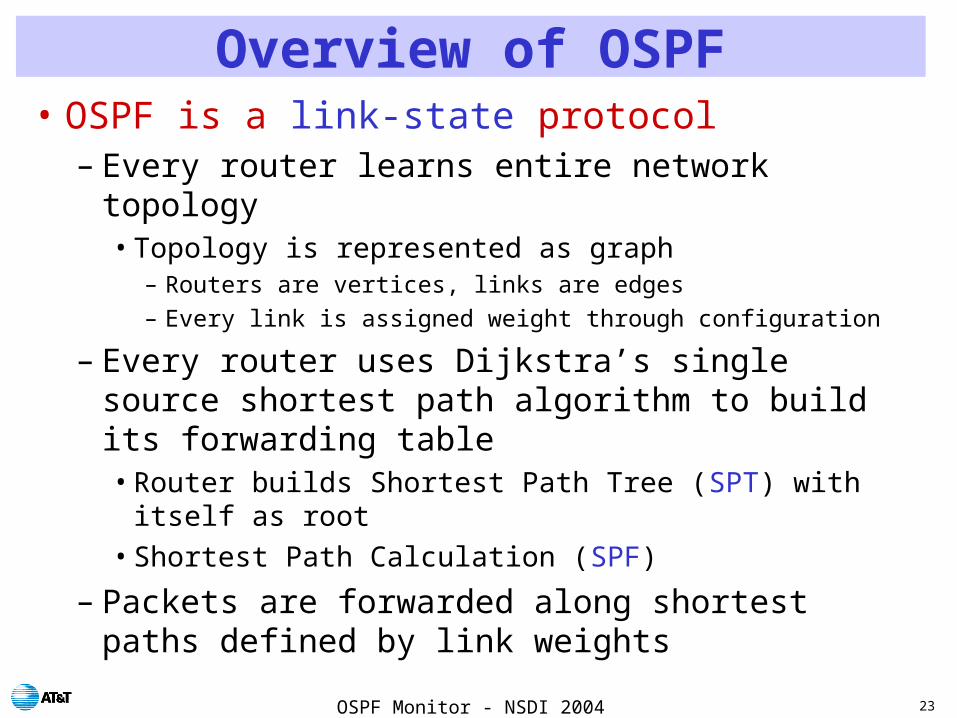
Overview of OSPF• OSPF is a link-state protocol
– Every router learns entire network topology• Topology is represented as graph
– Routers are vertices, links are edges
– Every link is assigned weight through configuration
– Every router uses Dijkstra’s single source shortest path algorithm to build its forwarding table• Router builds Shortest Path Tree (SPT) with itself as root
• Shortest Path Calculation (SPF)
– Packets are forwarded along shortest paths defined by link weights
OSPF Monitor - NSDI 2004 24
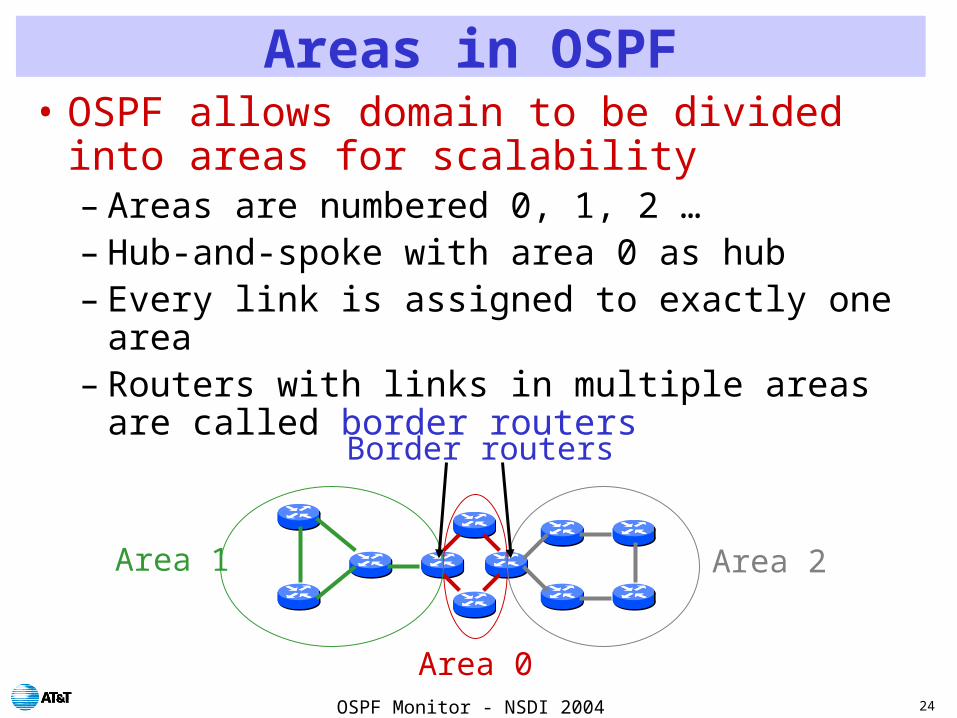
Areas in OSPF• OSPF allows domain to be divided into areas for
scalability– Areas are numbered 0, 1, 2 …– Hub-and-spoke with area 0 as hub– Every link is assigned to exactly one area– Routers with links in multiple areas are called border
routers
Area 1 Area 2
Area 0
Border routers
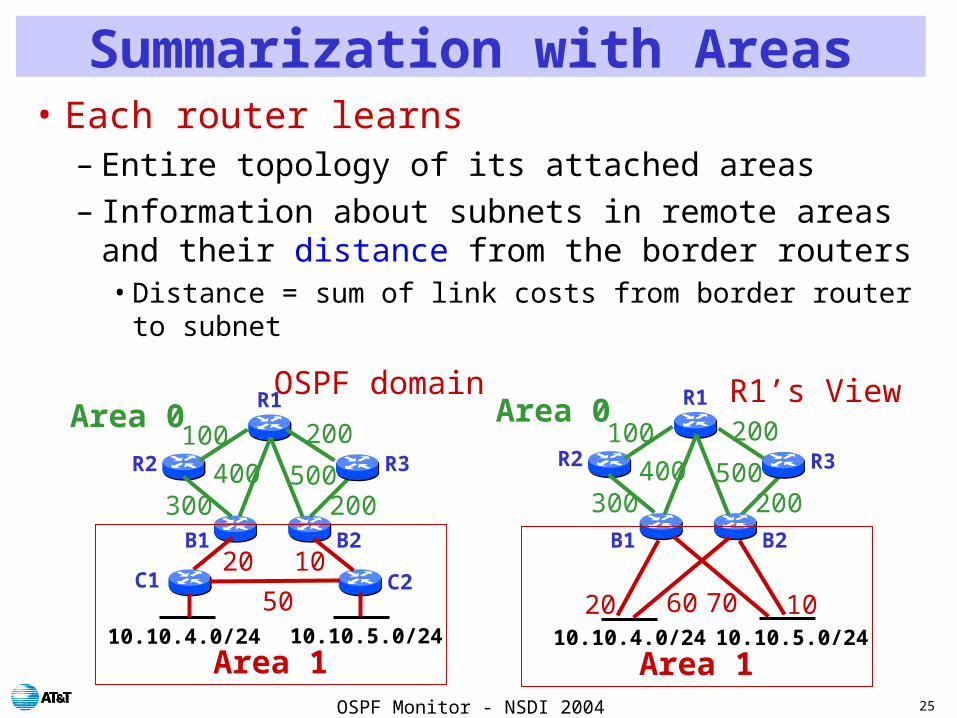
OSPF Monitor - NSDI 2004 25
Summarization with Areas• Each router learns
– Entire topology of its attached areas– Information about subnets in remote areas and their
distance from the border routers• Distance = sum of link costs from border router to subnet
B1 B2
R2
Area 0100 200
200500400
300
R3
R1 R1’s View
Area 110.10.4.0/24 10.10.5.0/24
20 70 1060
Area 1
Area 0
20
100
B1 B2
C1 C2
10.10.4.0/24 10.10.5.0/24
10
50
200
200500400
300
R3R2
R1OSPF domain

OSPF Monitor - NSDI 2004 26
Link State Advertisements (LSAs)• Every router describes its local connectivity in Link
State Advertisements (LSAs)• Router originates an LSA due to…
– Change in network topology• Example: link goes down or comes up
– Periodic soft-state refresh• Recommended value of interval is 30 minutes
• LSA is flooded to other routers in the domain– Flooding is reliable and hop-by-hop– Includes change and refresh LSAs– Flooding leads to duplicate copies of LSAs being received
• Every router stores LSAs (self-originated + received) in link-state database (= topology graph)

OSPF Monitor - NSDI 2004 27
Adjacency• Neighbor routers (i.e., routers connected by a
physical link) form an adjacency• The purpose is to make sure
– Link is operational and routers can communicate with each other
– Neighbor routers have consistent view of network topology• To avoid loops and black holes
• Link gets used for data forwarding only after adjacency is established
• Use of periodic Hellos to monitor the status of link and adjacency

OSPF Monitor - NSDI 2004 28
Equipment Problem at Enterprise Network• Internal errors in a router in area 0
– Episodes where router would drop adjacencies with other routers
• Problem manifested in LSAG as “ADJ UP” and “ADJ DOWN” messages– Not visible in other network management systems
• Led to proactive maintenance
0
20
40
60
80
100
1 7 13 19
Hour on April 16, 2002
Total LSAs in area 0
Total LSAs due to router bug
0
500
1000
1500
1 11 21
Day in April, 2002
Total LSAs in area 0
Total LSAs due to router bug

OSPF Monitor - NSDI 2004 29
LSA Traffic in Enterprise Network
0
4000
8000
1 11 21
Area 4Days
0
4000
8000
1 11 21
Area 3Days
0
4000
8000
1 11 21
Area 2
Days1
100
10000
1000000
1 11 21
Area 0
Days
Duplicate LSAs
Change LSAs
Refresh LSAs
Artifact: 23 hr day (Apr 7)
Genuine AnomalyGenuine Anomaly

OSPF Monitor - NSDI 2004 30
Overhead: Duplicate LSAs
• Why do some areas witness substantial duplicate LSA traffic, while other areas do not witness any?– OSPF flooding over LANs leads to control plane asymmetries
and to imbalances in duplicate LSA traffic
-50
950
1950
2950
1 11 21
Duplicate LSAs in area 3
Duplicate LSAs in area 2
Days


