1 availability of computers and networks Instructor: Prof. Kishor S. Trivedi Visiting Prof. Of Computer Science and Engineering, IITK Prof. Department of Electrical and Computer Engineering Duke University Durham, NC 27708-0291 Phone: 7576 e-mail: [email protected]URL: www.ee.duke.edu/~kst IIT Kanpur
Transcript
1
Performance and availability of computers and networks
Instructor: Prof. Kishor S. TrivediVisiting Prof. Of Computer Science and Engineering, IITKProf. Department of Electrical and Computer EngineeringDuke UniversityDurham, NC 27708-0291Phone: 7576e-mail: [email protected]: www.ee.duke.edu/~kst
Model construction, parameterization,solution,validation,
interpretation
Introductory Probability (chapters 1-5)
Markov Chains (chapters 7-8)
Queuing networks (chapter 9)
Statistical techniques (chapter 10-11)
3
Textbooks
Probability & Statistics with reliability, queuing,
and computer science applications, K. S. Trivedi, Prentice-Hall, 1982 (Indian edition also available).
Probability & Statistics with reliability, queuing,
and computer science applications, K. S. Trivedi, second edition, John Wiley & Sons, 2001.
Performance and reliability analysis of computer systems: An Example-Based Approach Using the SHARPE Software Package, Sahner, Trivedi, Puliafito, Kluwer
Academic Publishers, 1996.
4
Performance Evaluation Workload: traffic arrival rates, service time distributions Resource Contention & Scheduling Concurrency and Synchronization Timeliness (Have to Meet Deadlines) Measures: Thruput, response time (mean & dist.), loss
probability Low-level (Cache, memory interference: ch. 7) System-level (CPU-I/O, multiprocessing: ch. 8,9) Network-level (protocols, handoff in wireless: ch. 7,8)
5
Definition of Reliability
Recommendations E.800 of the International Telecommunications Union (ITU-T) defines reliability as follows:
“The ability of an item to perform a required function under given conditions for a given time interval.”
In this definition, an item may be a circuit board, a component on a circuit board, a module consisting of several circuit boards, a base transceiver station with several modules, a fiber-optic transport-system, or a mobile switching center (MSC) and all its subtending network elements. The definition includes systems with software.
6
Definition of AvailabilityAvailability is closely related to reliability, and is also defined in ITU-T Recommendation E.800 as follows:[1]
"The ability of an item to be in a state to perform a required function at a given instant of time or at any instant of time within a given time interval, assuming that the external resources, if required, are provided."
An important difference between reliability and availability is that reliability refers to failure-free operation during an interval, while availability refers to failure-free operation at a given instant of time, usually the time when a device or system is first accessed to provide a required function or service
7
High Reliability/Availability/Safety
Traditional applications (long-life/life-critical/safety-critical)
Space missions, aircraft control, defense, nuclear systems
New applications (non-life-critical/non-safety-critical, business
Motivation: High Availability Scott McNealy, Sun Microsystems Inc.
"We're paying people for uptime.The only thing that really matters is uptime, uptime, uptime, uptime and uptime. I want to get it down to a handful of times you might want to bring a Sun computer down in a year. I'm spending all my time with employees to get this design goal”
SUN Microsystems – SunUP & RASCAL program for high-availability
Motorola - 5NINES Initiative HP, Cisco, Oracle, SAP - 5nines:5minutes Alliance IBM – Cornhusker clustering technology for high-availability, eLiza,
autonomic computing Microsoft – Trustable computing initiative John Hennessey – in IEEE Computer Microsoft – Regular full page ad on 99.999% availability in USA
Today
9
Motivation – High Availability
10
Need for a new term
Reliability is used in a generic sense
Reliability used as a precisely defined mathematical function
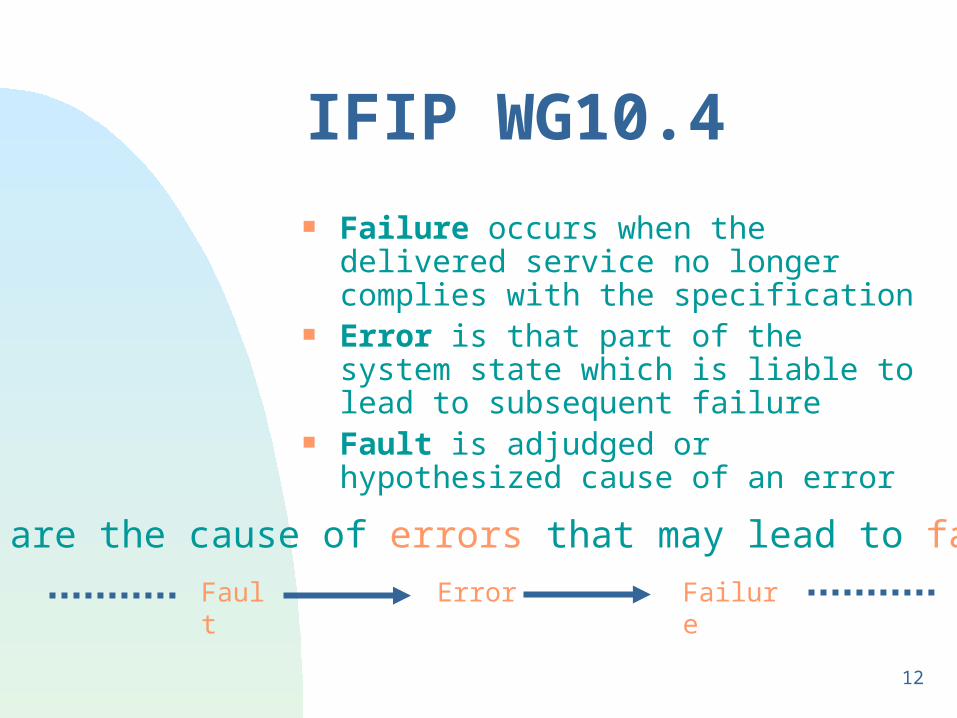
To remove confusion, IFIP WG 10.4 has proposed Dependability as an umbrella term
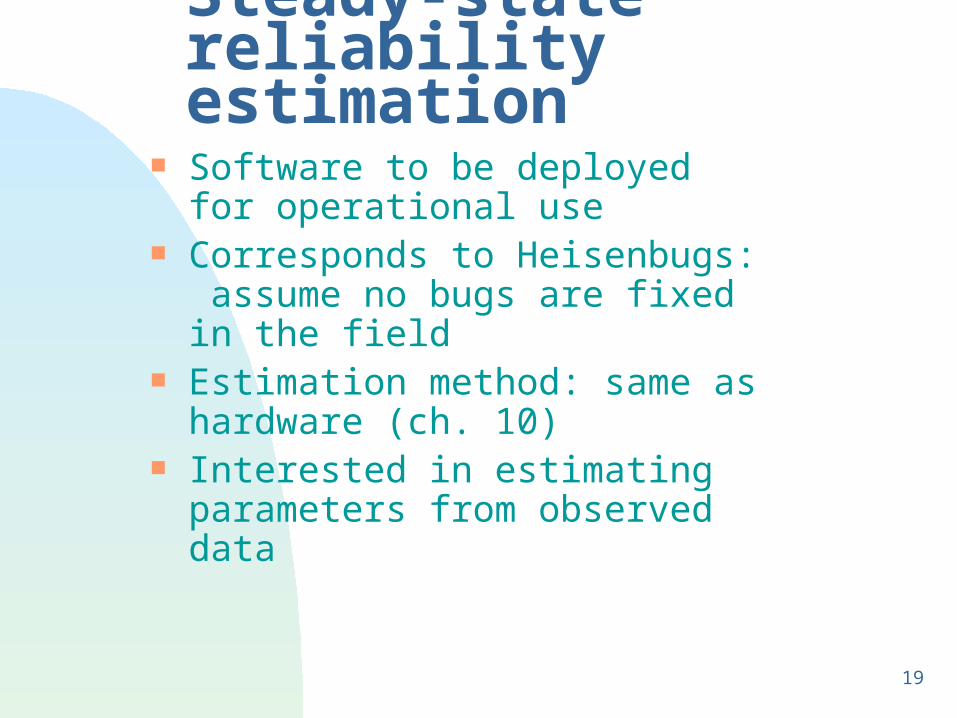
Many software bugs are reproducible, easily found and fixed during the testing and debugging phase
Other bugs that are hard to find and fix remain in the software during the operational phase may never be fixed, but if the operation is retried or the system
is rebooted, the bugs may not manifest themselves as failures, i.e., their manifestation is non-deterministic and dependent on the software reaching very rare states
Jim Gray: Bohrbugs & Heisenbugs
15
Software Fault Classification
Bohrbugs Heisenbugs“Aging”
related bugs
Analogous to det. FSM Analogous to non-det. FSMDepends on state of the env.e.g., system resources
- Many users in practice do not realize the need to calculate confidence
intervals
45
MODELER'S DILEMMA (Continued)
Model Solved Without Generating State Space Use: Order Statistics, Mixing, Convolution (chapters 1-5) Common Dependability Model Types:
also called Combinatorial Models Series-Parallel Reliability Block Diagrams Non-Series-Parallel Block Diagrams (or Reliability Graphs) Fault-Trees Without Repeated Events Fault-Trees With Repeated Events
Should I Use Non-State-Space Methods?
46
Combinatorial analytic models
Reliability block diagrams, Fault trees and Reliability
graphs
Commonly used for reliability and availability
These model types are similar in that they capture
conditions that make a system fail in terms of the
structural relationships between the system
components.
47
RBD example
48
Combinatorial Models Combinatorial modeling techniques like RBDs
and FTs are easy to use and assuming statistical independence solve for system availability and system MTTF
Each component can have attached to it A probability of failure A failure rate A distribution of time to failure Steady-state and instantaneous unavailability
49
Non-State Space Modeling Techniques
Possible to compute (given component failure/repair rates:) System Reliability System Availability (Steady-state,
instantaneous) System MTTF
50
Non-State Space Modeling Techniques (Continued)
Assuming:
Failures are statistically independent
As many repair units as needed
Relatively good algorithms are available for
solving such models so that 100 component
systems can be handled.
51
Common Model Types: Performance
Series-Parallel Task Precedence Graphs
Product-Form Queuing Networks
+ Easy specification, fast computation, no
distributional assumption
+ Can easily solve models with 100’s of components
Non-State Space Modeling Techniques (Continued)
52
- Failure/Repair Dependencies are often
present; RBDs, FTREEs cannot easily
handle these
(e.g., state dependent failure rate, shared
repair, imperfect coverage, reliability with
repair)
Non-State Space Modeling Techniques (Continued)
53
Markov chain
To model more complicated interactions between
components, use other kinds of models like Markov
chains or more generally state space models.
Many examples of dependencies among system
components have been observed in practice and
captured by Markov models.
54
State-Space-Based Models
States and labeled state transitions State can keep track of:
Number of functioning resources of each type States of recovery for each failed resource Number of tasks of each type waiting at each
resource Allocation of resources to tasks
A transition: Can occur from any state to any other state Can represent a simple or a compound event
55
Transitions between states represent the change of the system state due to the occurrence of an event
Drawn as a directed graph Transition label:
Probability: homogeneous discrete-time Markov chain (DTMC) Rate: homogeneous continuous-time Markov chain (CTMC) Time-dependent rate: non-homogeneous CTMC Distribution function: semi-Markov process (SMP) Two distribution functions; Markov regenerative process (MRGP)
State-Space-Based Models (Continued)
56
MODELER'S DILEMMA (Continued)
Should I Use Markov Models?
State-Space-Based Methods
+ Model Fault-Tolerance and Recovery/Repair
+ Model Dependencies
+ Model Contention for Resources
+ Model Concurrency and Timeliness
+ Generalize to Markov Reward Models for Modeling Degradable
Performance
57
MODELER'S DILEMMA (Continued)
Should I Use Markov Models?
+ Generalize to Markov Regenerative Models for Allowing
Generally Distributed Event Times
+ Generalize to Non-Homogeneous Markov Chains for Allowing
Weibull Failure Distributions
+ Performance, Availability and Performability Modeling Possible
- Large (Exponential) State Space
58
IN ORDER TO FULFILL OUR GOALS
Modeling Performance, Availability and
Performability
Modeling Complex Systems
We Need
Automatic Generation and Solution of Large
Markov Reward Models
59
IN ORDER TO FULFILL OUR GOALS (Continued)
Facility for State Truncation, Hierarchical composition of
Non-State-Space and State-Space Models, Fixed-Point
Iteration There are Two Tools that Potentially meet these Goals
Stochastic Petri Net Package (SPNP)
Symbolic Hierarchical Automated Reliability and
Performance Evaluator (SHARPE)
60
Model-based Performance/Dependability
evaluation Choice of the model type is dictated by:
Measures of interest Level of detailed system behavior to be
represented Ease of model specification and solution Representation power of the model type Access to suitable tools or toolkits
61
Difficulty in Modeling using Markov chains
The Markov chains tend to be large and complex
leading too:
Model generation problem
Use automated means of generating the Markov
chains: Stochastic Petri Nets, Stochastic Reward
Nets
62
Difficulty in Modeling using Markov chains (Continued)
Model solution problem
Use sparse storage for the matrices
Use sparsity preserving solution methods
Sucessive Overrelaxation,
Gauss-Seidel,
Uniformization,
ODE-solution methods
63
Modeling any system with a pure reliability / availability
model can lead to incomplete, or, at least, less precise
results.
Gracefully degrading systems may be able to survive the
failure of one or more of their active components and continue
to provide service at a reduced level.
Markov reward model is commonly used technique for the
modeling of gracefully degradable system
Markov Reward Models (MRMs)
64
State-Space-Based Models
Use also the following model types:
Markov chains & Markov reward models
semi-Markov & Markov regenerative processes
Stochastic reward nets or generalized stochastic Petri nets.
SRN & GSPN models are transformed into Markov chains for
analysis.
Only model types (in SHARPE) that requires a conversion to a
different model (Markov chain) to be solved.
65
Summary- Modeling Techniques
Combinatorial techniques like RBDs and FTREEs are easy to use and solve
State space based models like Markov chains can handle dependencies
State space explosion problem Use automated generation methods: stochastic Petri nets Concurrency, contention and conditional branching easily
modeled with Petri nets.
66
Hierarchy used State space explosion can be handled in two
ways: Large model tolerance must apply to
specification, storage and solution of the model. If the storage and solution problems can be solved, the specification problem can be solved by using more concise (and smaller) model specifications that can be automatically transformed into Markov models.
Large models can be avoided by using hierarchical (Multilevel) model composition.
67
An Introduction to SHARPE software tool
68
Overview of SHARPE SHARPE: Symbolic-Hierarchical
Automated Reliability and Performance Evaluator
Well-known modeling tool (Installed at over 300 Sites; companies and universities)
Combines flexibility of Markov models and efficiency of combinatorial models
Ported to most architectures and operating systems
Used for Education, Research, Engineering Practice
69
Graphical User Interface is available
Used for analysis of performance(traffic), dependability and
New Features Equivalent mean time to system failure and equivalent mean
time to system repair implemented for Markov chains and RBDs
BDD algorithms implemented for FTs and RGs Steady-state computation of MRGP models Stochastic reward net is available as a model type Fast MTTF algorithm implemented for Markov chain Mathematica used for some fully symbolic computations GUI implemented
State Space Explosion State space explosion can be handled in two ways:
Large model tolerance must apply to specification, storage and solution of the model. If the storage and solution problems can be solved, the specification problem can be solved by using more concise (and smaller) model specifications that can be automatically transformed into Markov models (GSPN and SRN models).
Large models can be avoided by using hierarchical model composition.
Ability of SHARPE to combine results from different kinds of models Possibility to use state-space methods for those parts of a system
that require them, and use non-state-space methods for the more “well-behaved” parts of the system.
Possible outputs Availability, Unavailability and Downtime Cost of downtime Mean Time to System Failure, Mean Time to System Repair Downtime breakdown into Hardware, Software & Upgrade Breakdown of downtime by states for Markov chain models,
by blocks for Reliability block diagram models. Sensitivity Analysis, Strategy to improve the availability of
the systems.
89
SHARPE - references Performance and Reliability Analysis of Computer Systems,
Robin Sahner, Kishor Trivedi, A. Puliafito, Kluwer Academic
Press, 1996, Red book
Reliability and Performability Modeling using SHARPE
2000, C. Hirel, R. Sahner, X. Zang, K. Trivedi Computer
performance evaluation: Modelling tools and
techniques; 11th International Conference; TOOLS
2000, Schaumburg, Il., USA, March 2000.
90
ADVANTAGES OF THE APPROACH
Pick a Natural Model Type for a Given Application
(No Retrofitting Required)
Use a Natural Model Type for a Portion of a Model
(Encourages Hybrid and Hierarchical Composition)
91
ADVANTAGES OF THE APPROACH Except for gspn and srn Models, No Internal Conversion Done
Appropriate Solution Algorithm for Each Model Type
i.e., Hierarchy for Solution as well as Specification