169
1 PLANTWIDE CONTROL Sigurd Skogestad Department of Chemical Engineering Norwegian University of Science and Tecnology (NTNU) Trondheim, Norway 01 April 2006
| Date post: | 14-Dec-2015 |
| Category: |
Documents |
| Upload: | patricia-sullivan |
| View: | 227 times |
| Download: | 2 times |

1
PLANTWIDE CONTROL
Sigurd Skogestad
Department of Chemical EngineeringNorwegian University of Science and Tecnology (NTNU)Trondheim, Norway
01 April 2006

2
Intro, DOFs, control objectives, self-op. control
What to control, Production rate,
stabilizing control, distillation example
Supervisory control. HDA example

3
Contents
• Overview of plantwide control • Selection of primary controlled variables based on economic : The llink
between the optimization (RTO) and the control (MPC; PID) layers- Degrees of freedom- Optimization- Self-optimizing control- Applications- Many examples
• Where to set the production rate and bottleneck • Design of the regulatory control layer ("what more should we
control") - stabilization - secondary controlled variables (measurements) - pairing with inputs - controllability analysis - cascade control and time scale separation.
• Design of supervisory control layer - Decentralized versus centralized (MPC) - Design of decentralized controllers: Sequential and independent design - Pairing and RGA-analysis
• Summary and case studies

4
Trondheim, Norway

5
Trondheim
Oslo
UK
NORWAY
DENMARK
GERMANY
North Sea
SWEDEN
Arctic circle

6
NTNU,Trondheim

7
Main message
• 1. Control for economics (Top-down steady-state arguments)– Primary controlled variables c
• 2. Control for stabilization (Bottom-up; regulatory PID control)– Secondary controlled variables (“inner cascade loops”)
• Both problems: “Maximum gain rule” useful for selecting controlled variables

8
Outline
• Control structure design (plantwide control)
• A procedure for control structure designI Top Down
• Step 1: Degrees of freedom
• Step 2: Operational objectives (optimal operation)
• Step 3: What to control ? (primary CV’s) (self-optimizing control)
• Step 4: Where set production rate?
II Bottom Up • Step 5: Regulatory control: What more to control (secondary CV’s) ?
• Step 6: Supervisory control
• Step 7: Real-time optimization
• Case studies

9
Idealized view of control(“Ph.D. control”)

10
Practice: Tennessee Eastman challenge problem (Downs, 1991)
(“PID control”)

11
How we design a control system for a complete chemical plant?
• Where do we start?
• What should we control? and why?
• etc.
• etc.

12
• Alan Foss (“Critique of chemical process control theory”, AIChE Journal,1973):
The central issue to be resolved ... is the determination of control system structure. Which variables should be measured, which inputs should be manipulated and which links should be made between the two sets? There is more than a suspicion that the work of a genius is needed here, for without it the control configuration problem will likely remain in a primitive, hazily stated and wholly unmanageable form. The gap is present indeed, but contrary to the views of many, it is the theoretician who must close it.
• Carl Nett (1989):Minimize control system complexity subject to the achievement of accuracy
specifications in the face of uncertainty.

13
Control structure design
• Not the tuning and behavior of each control loop,
• But rather the control philosophy of the overall plant with emphasis on the structural decisions:– Selection of controlled variables (“outputs”)
– Selection of manipulated variables (“inputs”)
– Selection of (extra) measurements
– Selection of control configuration (structure of overall controller that interconnects the controlled, manipulated and measured variables)
– Selection of controller type (LQG, H-infinity, PID, decoupler, MPC etc.).
• That is: Control structure design includes all the decisions we need make to get from ``PID control’’ to “Ph.D” control

14
Process control:
“Plantwide control” = “Control structure design for complete chemical plant”
• Large systems
• Each plant usually different – modeling expensive
• Slow processes – no problem with computation time
• Structural issues important– What to control?
– Extra measurements
– Pairing of loops

15
Previous work on plantwide control
• Page Buckley (1964) - Chapter on “Overall process control” (still industrial practice)
• Greg Shinskey (1967) – process control systems
• Alan Foss (1973) - control system structure
• Bill Luyben et al. (1975- ) – case studies ; “snowball effect”
• George Stephanopoulos and Manfred Morari (1980) – synthesis of control structures for chemical processes
• Ruel Shinnar (1981- ) - “dominant variables”
• Jim Downs (1991) - Tennessee Eastman challenge problem
• Larsson and Skogestad (2000): Review of plantwide control

16
• Control structure selection issues are identified as important also in other industries.
Professor Gary Balas (Minnesota) at ECC’03 about flight control at Boeing:
The most important control issue has always been to select the right controlled variables --- no systematic tools used!

17
Main simplification: Hierarchical structure
Need to define objectives and identify main issues for each
layer
PID
RTO
MPC
18
Regulatory control (seconds)
• Purpose: “Stabilize” the plant by controlling selected ‘’secondary’’ variables (y2) such that the plant does not drift too far away from its desired operation
• Use simple single-loop PI(D) controllers
• Status: Many loops poorly tuned– Most common setting: Kc=1, I=1 min (default)
– Even wrong sign of gain Kc ….

19
Regulatory control……...
• Trend: Can do better! Carefully go through plant and retune important loops using standardized tuning procedure
• Exists many tuning rules, including Skogestad (SIMC) rules: – Kc = (1/k) (1/ [c +]) I = min (1, 4[c + ]), Typical: c=
– “Probably the best simple PID tuning rules in the world” © Carlsberg
• Outstanding structural issue: What loops to close, that is, which variables (y2) to control?

20
Supervisory control (minutes)
• Purpose: Keep primary controlled variables (c=y1) at desired values, using as degrees of freedom the setpoints y2s for the regulatory layer.
• Status: Many different “advanced” controllers, including feedforward, decouplers, overrides, cascades, selectors, Smith Predictors, etc.
• Issues: – Which variables to control may change due to change of “active
constraints”
– Interactions and “pairing”

21
Supervisory control…...
• Trend: Model predictive control (MPC) used as unifying tool.
– Linear multivariable models with input constraints
– Tuning (modelling) is time-consuming and expensive
• Issue: When use MPC and when use simpler single-loop decentralized controllers ?– MPC is preferred if active constraints (“bottleneck”) change.
– Avoids logic for reconfiguration of loops
• Outstanding structural issue:– What primary variables c=y1 to control?

22
Local optimization (hour)
• Purpose: Minimize cost function J and: – Identify active constraints
– Recompute optimal setpoints y1s for the controlled variables
• Status: Done manually by clever operators and engineers
• Trend: Real-time optimization (RTO) based on detailed nonlinear steady-state model
• Issues: – Optimization not reliable.
– Need nonlinear steady-state model
– Modelling is time-consuming and expensive

23
Objectives of layers: MV’s and CV’s
cs = y1s
MPC
PID
y2s
RTO
u (valves)
CV=y1; MV=y2s
CV=y2; MV=u
Min J (economics); MV=y1s

24
Stepwise procedure plantwide control
I. TOP-DOWNStep 1. DEGREES OF FREEDOMStep 2. OPERATIONAL OBJECTIVES Step 3. WHAT TO CONTROL? (primary CV’s c=y1)Step 4. PRODUCTION RATE
II. BOTTOM-UP (structure control system):Step 5. REGULATORY CONTROL LAYER (PID)
“Stabilization”What more to control? (secondary CV’s y2)
Step 6. SUPERVISORY CONTROL LAYER (MPC) Decentralization
Step 7. OPTIMIZATION LAYER (RTO)Can we do without it?

25
Outline
• About Trondheim and myself• Control structure design (plantwide control)• A procedure for control structure design
I Top Down • Step 1: Degrees of freedom• Step 2: Operational objectives (optimal operation)• Step 3: What to control ? (self-optimzing control)• Step 4: Where set production rate?
II Bottom Up • Step 5: Regulatory control: What more to control ?• Step 6: Supervisory control• Step 7: Real-time optimization
• Case studies

26
Step 1. Degrees of freedom (DOFs) for operation (Nvalves):
To find all operational (dynamic) degrees of freedom
• Count valves! (Nvalves)
• “Valves” also includes adjustable compressor power, etc.
Anything we can manipulate!

27
Steady-state degrees of freedom
• Cost J depends normally only on steady-state DOFs
Three methods to obtain steady-state degrees of freedom (Nss):
1. Equation-counting • Nss = no. of variables – no. of equations/specifications • Very difficult in practice (not covered here)
2. Valve-counting (easier!)• Nss = Nvalves – N0ss – Nspecs
• N0ss = variables with no steady-state effect
3. Typical number for some units (useful for checking!)
28
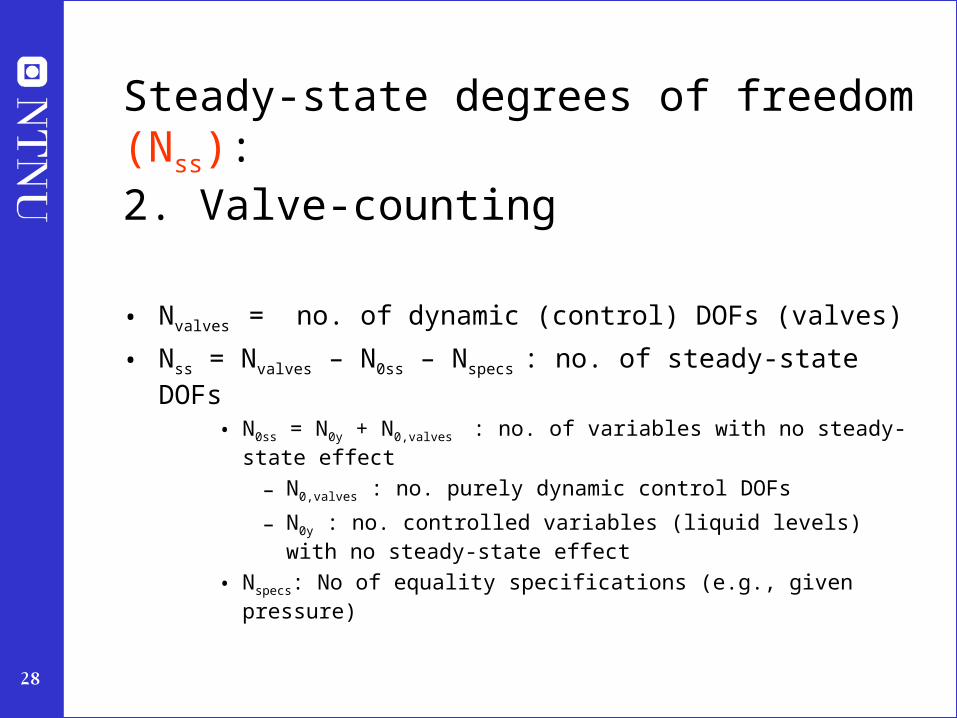
Steady-state degrees of freedom (Nss): 2. Valve-counting
• Nvalves = no. of dynamic (control) DOFs (valves)
• Nss = Nvalves – N0ss – Nspecs : no. of steady-state DOFs • N0ss = N0y + N0,valves : no. of variables with no steady-state effect
– N0,valves : no. purely dynamic control DOFs
– N0y : no. controlled variables (liquid levels) with no steady-state effect
• Nspecs: No of equality specifications (e.g., given pressure)

29
Nvalves = 6 , N0y = 2 , Nspecs = 2, NSS = 6 -2 -2 = 2
Distillation column with given feed and pressure
30
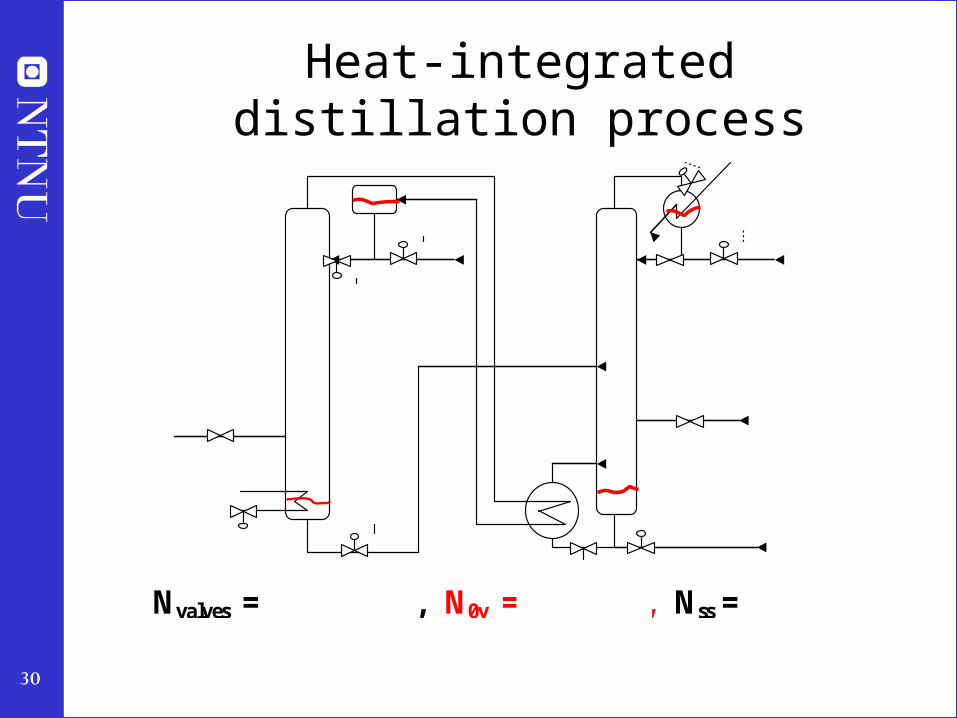
Heat-integrated distillation process
Nvalves = 11 (w/feed), N0y = 4 (levels), Nss = 11 – 4 = 7

31
Heat-integrated distillation process
Nvalves = 11 (w/feed), N0y = 4 (levels), Nss = 11 – 4 = 7

32
Heat exchanger with bypasses
CW
Nvalves = 3, N0valves = 2 (of 3), Nss = 3 – 2 = 1

33
Heat exchanger with bypasses
CW
Nvalves = 3, N0valves = 2 (of 3), Nss = 3 – 2 = 1

34
Steady-state degrees of freedom (Nss): 3. Typical number for some process units
• each external feedstream: 1 (feedrate)
• splitter: n-1 (split fractions) where n is the number of exit streams
• mixer: 0
• compressor, turbine, pump: 1 (work)
• adiabatic flash tank: 0*
• liquid phase reactor: 1 (holdup-volume reactant)
• gas phase reactor: 0*
• heat exchanger: 1 (duty or net area)
• distillation column excluding heat exchangers: 0* + number of sidestreams
• pressure* : add 1DOF at each extra place you set pressure (using an extra valve, compressor or pump!). Could be for adiabatic flash tank, gas phase reactor, distillation column
* Pressure is normally assumed to be given by the surrounding process and is then not a degree of freedom

35
Heat exchanger with bypasses
CW
“Typical number heat exchanger” Nss = 1

36
“Typical number”, Nss= 0 (distillation) + 2*1 (heat exchangers) = 2
Distillation column with given feed and pressure

37
Heat-integrated distillation process
Typical number, Nss = 1 (feed) + 2*0 (columns) + 2*1 (column pressures) + 1 (sidestream) + 3 (hex) = 7

38
HDA process
Mixer FEHE Furnace PFR Quench
Separator
Compressor
Cooler
StabilizerBenzeneColumn
TolueneColumn
H2 + CH4
Toluene
Toluene Benzene CH4
Diphenyl
Purge (H2 + CH4)

39
HDA process: steady-state degrees of freedom
1
2
3
8 7
4
6
5
9
10
11
12
13
14
Conclusion: 14 steady-state DOFs
Assume given column pressures
feed:1.2
hex: 3, 4, 6
splitter 5, 7
compressor: 8
distillation: rest

40
• Check that there are enough manipulated variables (DOFs) - both dynamically and at steady-state (step 2)
• Otherwise: Need to add equipment– extra heat exchanger
– bypass
– surge tank

41
Outline
• About Trondheim and myself• Control structure design (plantwide control)• A procedure for control structure design
I Top Down • Step 1: Degrees of freedom• Step 2: Operational objectives (optimal operation)• Step 3: What to control ? (self-optimizing control)• Step 4: Where set production rate?
II Bottom Up • Step 5: Regulatory control: What more to control ?• Step 6: Supervisory control• Step 7: Real-time optimization
• Case studies

42
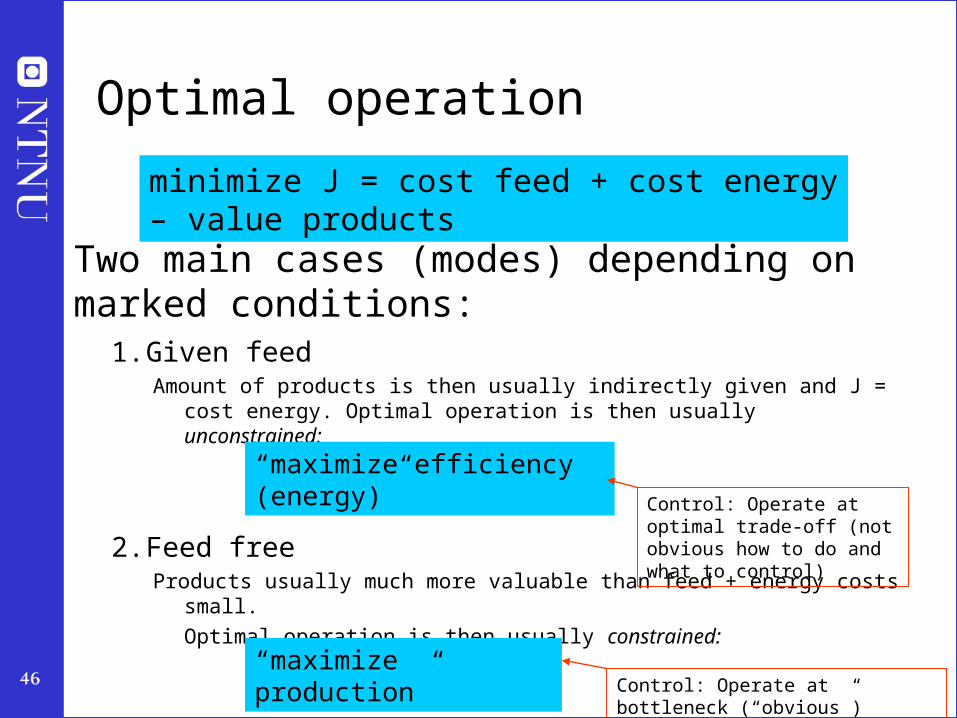
Optimal operation (economics)
• What are we going to use our degrees of freedom for?• Define scalar cost function J(u0,x,d)
– u0: degrees of freedom– d: disturbances– x: states (internal variables)Typical cost function:
• Optimal operation for given d:
minuss J(uss,x,d)subject to:
Model equations: f(uss,x,d) = 0
Operational constraints: g(uss,x,d) < 0
J = cost feed + cost energy – value products

43
Optimal operation distillation column
• Distillation at steady state with given p and F: N=2 DOFs, e.g. L and V
• Cost to be minimized (economics)
J = - P where P= pD D + pB B – pF F – pV V
• Constraints
Purity D: For example xD, impurity · max
Purity B: For example, xB, impurity · max
Flow constraints: min · D, B, L etc. · max
Column capacity (flooding): V · Vmax, etc.
Pressure: 1) p given, 2) p free: pmin · p · pmax
Feed: 1) F given 2) F free: F · Fmax
• Optimal operation: Minimize J with respect to steady-state DOFs
value products
cost energy (heating+ cooling)
cost feed

44
Example: Paper machine drying section
~10m
water recycle
water
up to 30 m/s (100 km/h)
(~20 seconds)

45
Paper machine: Overall operational objectives
• Degrees of freedom (inputs) drying section– Steam flow each drum (about 100)
– Air inflow and outflow (2)
• Objective: Minimize cost (energy) subject to satisfying operational constraints – Humidity paper ≤10% (active constraint: controlled!)
– Air outflow T < dew point – 10C (active – not always controlled)
– ΔT along dryer (especially inlet) < bound (active?)
– Remaining DOFs: minimize cost
46
Optimal operation
1. Given feedAmount of products is then usually indirectly given and J = cost energy.
Optimal operation is then usually unconstrained:
2. Feed free Products usually much more valuable than feed + energy costs small.
Optimal operation is then usually constrained:
minimize J = cost feed + cost energy – value products
“maximize efficiency (energy)”
“maximize production”
Two main cases (modes) depending on marked conditions:
Control: Operate at bottleneck (“obvious”)
Control: Operate at optimal trade-off (not obvious how to do and what to control)

47
Comments optimal operation
• Do not forget to include feedrate as a degree of freedom!!– For paper machine it may be optimal to have max. drying and adjust the
speed of the paper machine!
• Control at bottleneck – see later: “Where to set the production rate”

48
Outline
• About Trondheim and myself• Control structure design (plantwide control)• A procedure for control structure design
I Top Down • Step 1: Degrees of freedom• Step 2: Operational objectives (optimal operation)• Step 3: What to control ? (self-optimizing control)• Step 4: Where set production rate?
II Bottom Up • Step 5: Regulatory control: What more to control ?• Step 6: Supervisory control• Step 7: Real-time optimization
• Case studies

49
Step 3. What should we control (c)? (primary controlled variables y1=c)
Outline
• Implementation of optimal operation
• Self-optimizing control
• Uncertainty (d and n)
• Example: Marathon runner
• Methods for finding the “magic” self-optimizing variables:A. Large gain: Minimum singular value rule
B. “Brute force” loss evaluation
C. Optimal combination of measurements
• Example: Recycle process
• Summary

50
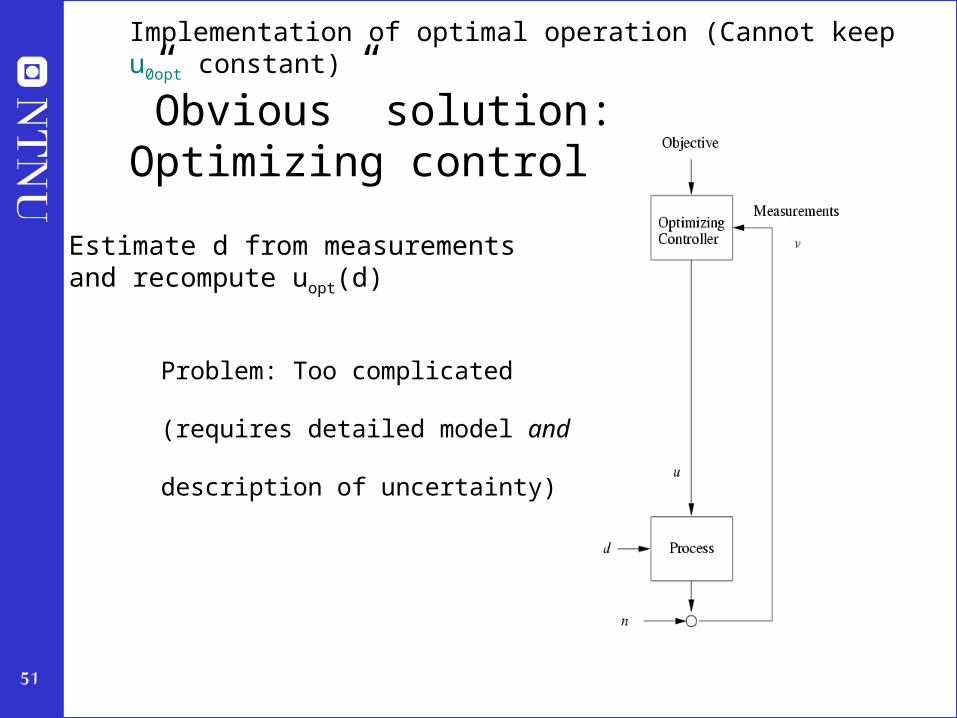
Implementation of optimal operation
• Optimal operation for given d*:
minu J(u,x,d)subject to:
Model equations: f(u,x,d) = 0
Operational constraints: g(u,x,d) < 0
→ uopt(d*)
Problem: Usally cannot keep uopt constant because disturbances d change
How should be adjust the degrees of freedom (u)?
51
Problem: Too complicated
(requires detailed model and description of
uncertainty)
Implementation of optimal operation (Cannot keep u0opt constant)
”Obvious” solution: Optimizing control
Estimate d from measurements and recompute uopt(d)

52
In practice: Hierarchical decomposition with separate layers
What should we control?

53
Self-optimizing control: When constant setpoints is OK
Constant setpoint

54
Unconstrained variables:
Self-optimizing control
• Self-optimizing control:
Constant setpoints cs give
”near-optimal operation” (= acceptable loss L for expected
disturbances d and implementation errors n)
Acceptable loss ) self-optimizing control

55
What c’s should we control?
• Optimal solution is usually at constraints, that is, most of the degrees of freedom are used to satisfy “active constraints”, g(u,d) = 0
• CONTROL ACTIVE CONSTRAINTS!– cs = value of active constraint
– Implementation of active constraints is usually simple.
• WHAT MORE SHOULD WE CONTROL?– Find “self-optimizing” variables c for remaining
unconstrained degrees of freedom u.

56
What should we control? – Sprinter
• Optimal operation of Sprinter (100 m), J=T– One input: ”power/speed”
– Active constraint control:• Maximum speed (”no thinking required”)

57
What should we control? – Marathon
• Optimal operation of Marathon runner, J=T– No active constraints
– Any self-optimizing variable c (to control at constant setpoint)?

58
Self-optimizing Control – Marathon
• Optimal operation of Marathon runner, J=T– Any self-optimizing variable c (to control at constant
setpoint)?• c1 = distance to leader of race
• c2 = speed
• c3 = heart rate
• c4 = level of lactate in muscles

59
Further examples self-optimizing control
• Marathon runner
• Central bank
• Cake baking
• Business systems (KPIs)
• Investment portifolio
• Biology
• Chemical process plants: Optimal blending of gasoline
Define optimal operation (J) and look for ”magic” variable (c) which when kept constant gives acceptable loss (self-optimizing control)

60
More on further examples
• Central bank. J = welfare. u = interest rate. c=inflation rate (2.5%)• Cake baking. J = nice taste, u = heat input. c = Temperature (200C)• Business, J = profit. c = ”Key performance indicator (KPI), e.g.
– Response time to order– Energy consumption pr. kg or unit– Number of employees– Research spendingOptimal values obtained by ”benchmarking”
• Investment (portofolio management). J = profit. c = Fraction of investment in shares (50%)
• Biological systems:– ”Self-optimizing” controlled variables c have been found by natural
selection– Need to do ”reverse engineering” :
• Find the controlled variables used in nature• From this possibly identify what overall objective J the biological system has
been attempting to optimizeBREAK

61
Summary so far: Active constrains and unconstrained variables
• Optimal operation: Minimize J with respect to DOFs• General: Optimal solution with N DOFs:
– Nactive: DOFs used to satisfy “active” constraints (· is =)
– Nu= N – Nactive. remaining unconstrained variables
Often: Nu is zero or small
• It is “obvious” how to control the active constraints
• Difficult issue: What should we use the remaining Nu degrees of for, that is what should we control?

62
Recall: Optimal operation distillation column
• Distillation at steady state with given p and F: N=2 DOFs, e.g. L and V
• Cost to be minimized (economics)
J = - P where P= pD D + pB B – pF F – pV V
• Constraints
Purity D: For example xD, impurity · max
Purity B: For example, xB, impurity · max
Flow constraints: min · D, B, L etc. · max
Column capacity (flooding): V · Vmax, etc.
Pressure: 1) p given, 2) p free: pmin · p · pmax
Feed: 1) F given 2) F free: F · Fmax
• Optimal operation: Minimize J with respect to steady-state DOFs
value products
cost energy (heating+ cooling)
cost feed

63
Solution: Optimal operation distillation
• Cost to be minimizedJ = - P where P= pD D + pB B – pF F – pV V
• N=2 steady-state degrees of freedom• Active constraints distillation:
– Purity spec. valuable product is always active (“avoid give-away of valuable product”).
– Purity spec. “cheap” product may not be active (may want to overpurify to avoid loss of valuable product – but costs energy)
• Three cases:1. Nactive=2: Two active constraints (for example, xD, impurity = max. xB,
impurity = max, “TWO-POINT” COMPOSITION CONTROL)
2. Nactive=1: One constraint active (1 remaining DOF)
3. Nactive=0: No constraints active (2 remaining DOFs)Can happen if no purity specifications(e.g. byproducts or recycle)
Problem : WHAT SHOULD WE CONTROL (TO SATISFY
THE UNCONSTRAINED DOFs)?Solution: Often compositions but not always!

64
Unconstrained variables:What should we control?
• Intuition: “Dominant variables” (Shinnar)
• Is there any systematic procedure?

65
What should we control?Systematic procedure
• Systematic: Minimize cost J(u,d*) w.r.t. DOFs u.
1. Control active constraints (constant setpoint is optimal)
2. Remaining unconstrained DOFs: Control “self-optimizing” variables c for which constant setpoints cs = copt(d*) give small (economic) loss
Loss = J - Jopt(d)
when disturbances d ≠ d* occur
c = ? (economics)
y2 = ? (stabilization)

66
The difficult unconstrained variables
Cost J
Selected controlled variable (remaining unconstrained)
ccoptopt
JJoptopt
c

67
Example: Tennessee Eastman plant
J
c = Purge rate
Nominal optimum setpoint is infeasible with disturbance 2
Oopss..bends backwards
Conclusion: Do not use purge rate as controlled variable

68
Optimal operation
Cost J
Controlled variable cccoptopt
JJoptopt
Two problems:
• 1. Optimum moves because of disturbances d: copt(d)
d
LOSS

69
Optimal operation
Cost J
Controlled variable cccoptopt
JJoptopt
Two problems:
• 1. Optimum moves because of disturbances d: copt(d)
• 2. Implementation error, c = copt + n
d
n
LOSS
70
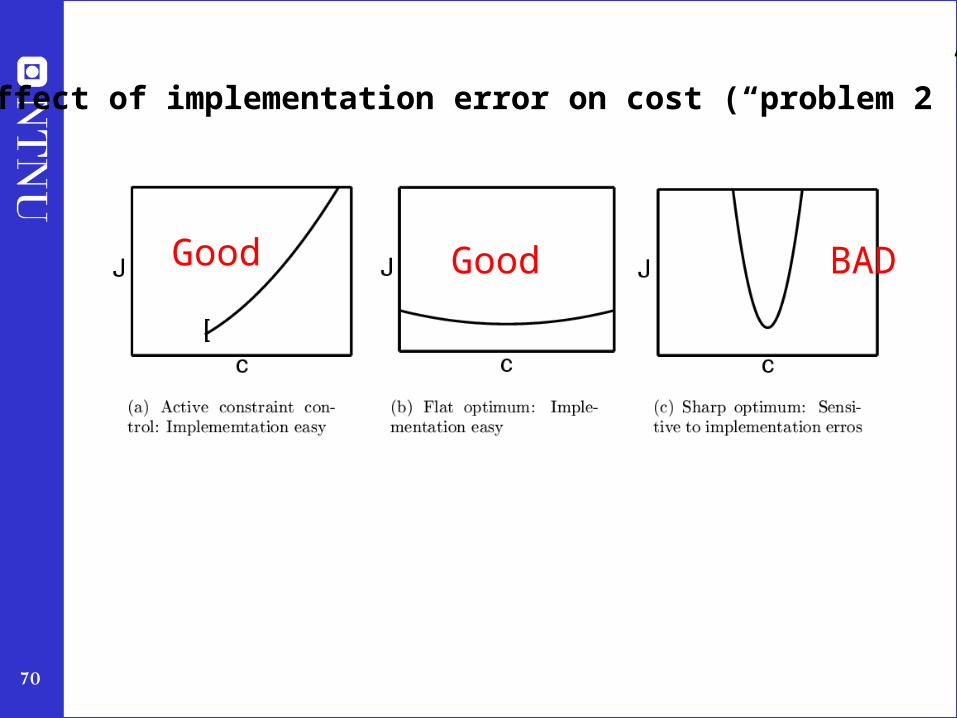
Effect of implementation error on cost (“problem 2”)
BADGoodGood

71
Example sharp optimum. High-purity distillation : c = Temperature top of column
Temperature
Ttop
Water (L) - acetic acid (H)Max 100 ppm acetic acid100 C: 100% water 100.01C: 100 ppm99.99 C: Infeasible

72
Candidate controlled variables
• We are looking for some “magic” variables c to control.....What properties do they have?’
• Intuitively 1: Should have small optimal range delta copt
– since we are going to keep them constant!
• Intuitively 2: Should have small “implementation error” n• Intuitively 3: Should be sensitive to inputs u (remaining unconstrained degrees
of freedom), that is, the gain G0 from u to c should be large – G0: (unscaled) gain from u to c– large gain gives flat optimum in c– Charlie Moore (1980’s): Maximize minimum singular value when selecting temperature
locations for distillation
• Will show shortly: Can combine everything into the “maximum gain rule”:
– Maximize scaled gain G = Go / span(c)
Unconstrained degrees of freedom:
span(c)

73
Optimizer
Controller thatadjusts u to keep
cm = cs
Plant
cs
cm=c+n
u
c
n
d
u
c
J
cs=copt
uopt
n
Unconstrained degrees of freedom:
Justification for “intuitively 2 and 3”
Want the slope (= gain G0 from u to c) large –
corresponds to flat optimum in c
Want small n

74
Mathematic local analysis(Proof of “maximum gain rule”)
u
cost J
uopt

75
Minimum singular value of scaled gain
Maximum gain rule (Skogestad and Postlethwaite, 1996):Look for variables that maximize the scaled gain (G) (minimum singular value of the appropriately scaled steady-state gain matrix G from u to c)
(G) is called the Morari Resiliency index (MRI) by Luyben
Detailed proof: I.J. Halvorsen, S. Skogestad, J.C. Morud and V. Alstad,
``Optimal selection of controlled variables'', Ind. Eng. Chem. Res., 42 (14), 3273-3284 (2003).

76
Improved minimum singular value rule for ill-conditioned plants
G: Scaled gain matrix (as before)Juu: Hessian for effect of u’s on cost
Problem: Juu can be difficult to obtain
Improved rule has been used successfully for distillation

77
Maximum gain rule for scalar system
Unconstrained degrees of freedom:

78
Maximum gain rule in words
Select controlled variables c for which
their controllable range is large compared to
their sum of optimal variation and control error
controllable range = range c may reach by varying the inputs (=gain)
optimal variation: due to disturbance
control error = implementation error nspan

79
B. “Brute-force” procedure for selecting (primary) controlled variables (Skogestad, 2000)
• Step 1 Determine DOFs for optimization
• Step 2 Definition of optimal operation J (cost and constraints)
• Step 3 Identification of important disturbances
• Step 4 Optimization (nominally and with disturbances)
• Step 5 Identification of candidate controlled variables (use active constraint control)
• Step 6 Evaluation of loss with constant setpoints for alternative controlled variables
• Step 7 Evaluation and selection (including controllability analysis)
Case studies: Tenneessee-Eastman, Propane-propylene splitter, recycle process, heat-integrated distillation

80
Unconstrained degrees of freedom:
C. Optimal measurement combination (Alstad, 2002)

81
Unconstrained degrees of freedom:
C. Optimal measurement combination (Alstad, 2002)
Basis: Want optimal value of c independent of disturbances ) copt = 0 ¢ d
• Find optimal solution as a function of d: uopt(d), yopt(d)
• Linearize this relationship: yopt = F d • F – sensitivity matrix
• Want:
• To achieve this for all values of d:
• Always possible if
• Optimal when we disregard implementation error (n)

82
Alstad-method continued
• To handle implementation error: Use “sensitive” measurements, with information about all independent variables (u and d)

83
Summary unconstrained degrees of freedom:
Looking for “magic” variables to keep at constant setpoints.
How can we find them systematically?
Candidates
A. Start with: Maximum gain (minimum singular value) rule:
B. Then: “Brute force evaluation” of most promising alternatives. Evaluate loss when the candidate variables c are kept constant.
In particular, may be problem with feasibility
C. More general candidates: Find optimal linear combination (matrix H):

84
Toy Example

85
Toy Example

86
Toy Example

87
EXAMPLE: Recycle plant (Luyben, Yu, etc.)
1
2
3
4
5
Given feedrate F0 and column pressure:
Dynamic DOFs: Nm = 5 Column levels: N0y = 2Steady-state DOFs: N0 = 5 - 2 = 3

88
Recycle plant: Optimal operation
mT
1 remaining unconstrained degree of freedom
89
Control of recycle plant:Conventional structure (“Two-point”: xD)
LC
XC
LC
XC
LC
xB
xD
Control active constraints (Mr=max and xB=0.015) + xD

90
Luyben rule
Luyben rule (to avoid snowballing):
“Fix a stream in the recycle loop” (F or D)

91
Luyben rule: D constant
Luyben rule (to avoid snowballing):
“Fix a stream in the recycle loop” (F or D)
LCLC
LC
XC

92
A. Maximum gain rule: Steady-state gain
Luyben rule:
Not promising
economically
Conventional:
Looks good

93
How did we find the gains in the Table?
1. Find nominal optimum
2. Find (unscaled) gain G0 from input to candidate outputs: c = G0 u.• In this case only a single unconstrained input (DOF). Choose at u=L• Obtain gain G0 numerically by making a small perturbation in u=L while
adjusting the other inputs such that the active constraints are constant (bottom composition fixed in this case)
3. Find the span for each candidate variable• For each disturbance di make a typical change and reoptimize to obtain
the optimal ranges copt(di) • For each candidate output obtain (estimate) the control error (noise) n• span(c) = i |copt(di)| + n
4. Obtain the scaled gain, G = G0 / span(c)
IMPORTANT!

94
B. “Brute force” loss evaluation: Disturbance in F0
Loss with nominally optimal setpoints for Mr, xB and c
Luyben rule:
Conventional
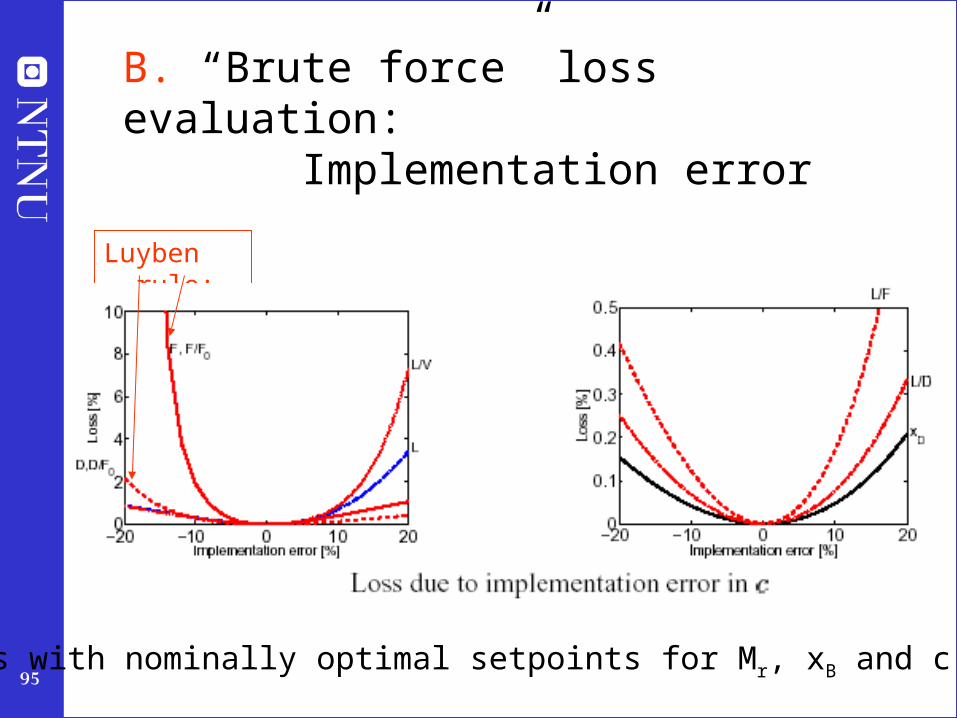
95
B. “Brute force” loss evaluation: Implementation error
Loss with nominally optimal setpoints for Mr, xB and c
Luyben rule:

96
C. Optimal measurement combination
• 1 unconstrained variable (#c = 1)
• 1 (important) disturbance: F0 (#d = 1)
• “Optimal” combination requires 2 “measurements” (#y = #u + #d = 2)– For example, c = h1 L + h2 F
• BUT: Not much to be gained compared to control of single variable (e.g. L/F or xD)

97
Conclusion: Control of recycle plant
Active constraintMr = Mrmax
Active constraintxB = xBmin
L/F constant: Easier than “two-point” control
Assumption: Minimize energy (V)
Self-optimizing

98
Recycle systems:
Do not recommend Luyben’s rule of fixing a flow in each recycle loop
(even to avoid “snowballing”)

99
Summary: Self-optimizing Control
Self-optimizing control is when acceptable operation can be achieved using constant set points (c
s)
for the
controlled variables c (without the need to re-optimizing when disturbances occur).
c=cs

100
Summary: Procedure selection controlled variables
1. Define economics and operational constraints2. Identify degrees of freedom and important disturbances3. Optimize for various disturbances4. Identify (and control) active constraints (off-line calculations)
• May vary depending on operating region. For each operating region do step 5:
5. Identify “self-optimizing” controlled variables for remaining degrees of freedom1. (A) Identify promising (single) measurements from “maximize gain rule” (gain =
minimum singular value)• (C) Possibly consider measurement combinations if no promising
2. (B) “Brute force” evaluation of loss for promising alternatives• Necessary because “maximum gain rule” is local. • In particular: Look out for feasibility problems.
3. Controllability evaluation for promising alternatives

101
Summary ”self-optimizing” control
• Operation of most real system: Constant setpoint policy (c = cs)
– Central bank
– Business systems: KPI’s
– Biological systems
– Chemical processes
• Goal: Find controlled variables c such that constant setpoint policy gives acceptable operation in spite of uncertainty ) Self-optimizing control
• Method A: Maximize (G)
• Method B: Evaluate loss L = J - Jopt
• Method C: Optimal linear measurement combination: c = H y where HF=0

102
Outline
• Control structure design (plantwide control)
• A procedure for control structure designI Top Down
• Step 1: Degrees of freedom
• Step 2: Operational objectives (optimal operation)
• Step 3: What to control ? (self-optimzing control)
• Step 4: Where set production rate?
II Bottom Up • Step 5: Regulatory control: What more to control ?
• Step 6: Supervisory control
• Step 7: Real-time optimization
• Case studies

103
Step 4. Where set production rate?
• Very important!
• Determines structure of remaining inventory (level) control system
• Set production rate at (dynamic) bottleneck
• Link between Top-down and Bottom-up parts

104
Production rate set at inlet :Inventory control in direction of flow

105
Production rate set at outlet:Inventory control opposite flow

106
Production rate set inside process

107
Where set the production rate?
• Very important decision that determines the structure of the rest of the control system!
• May also have important economic implications

108
Often optimal: Set production rate at bottleneck!
• "A bottleneck is an extensive variable that prevents an increase in the overall feed rate to the plant"
• If feed is cheap and available: Optimal to set production rate at bottleneck
• If the flow for some time is not at its maximum through the bottleneck, then this loss can never be recovered.

109
Reactor-recycle process:Given feedrate with production rate set at inlet
110
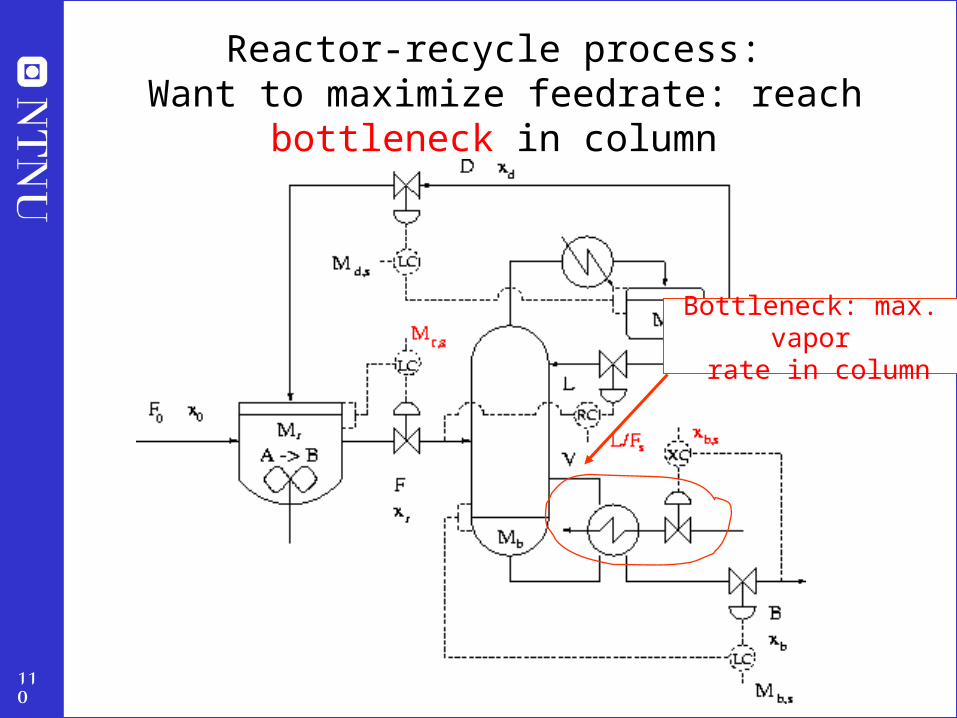
Reactor-recycle process: Want to maximize feedrate: reach bottleneck in column
Bottleneck: max. vapor rate in column

111
Reactor-recycle process with production rate set at inlet Want to maximize feedrate: reach bottleneck in column
Bottleneck: max. vapor rate in column
FC
Vmax
VVmax-Vs=Back-off
= Loss
Alt.1: Loss
Vs

112
Alt.2 “long loop”
MAX
Reactor-recycle process with increased feedrate:Optimal: Set production rate at bottleneck

113
Reactor-recycle process with increased feedrate:Optimal: Set production rate at bottleneck
MAX
Alt.3: reconfigure

114
Reactor-recycle process:Given feedrate with production rate set at bottleneck
F0s
Alt.3: reconfigure
(permanently)

115
• Can reduce loss
• BUT: Is generally placed on top of the regulatory control system (including level loops), so it still important where the production rate is set!
Alt.4: Multivariable control (MPC)

116
Conclusion production rate manipulator
• Think carefully about where to place it!
• Difficult to undo later
BREAK

117
Outline
• Control structure design (plantwide control)
• A procedure for control structure designI Top Down
• Step 1: Degrees of freedom
• Step 2: Operational objectives (optimal operation)
• Step 3: What to control ? (self-optimizing control)
• Step 4: Where set production rate?
II Bottom Up • Step 5: Regulatory control: What more to control ?
• Step 6: Supervisory control
• Step 7: Real-time optimization
• Case studies

118
II. Bottom-up
• Determine secondary controlled variables and structure (configuration) of control system (pairing)
• A good control configuration is insensitive to parameter changes
Step 5. REGULATORY CONTROL LAYER
5.1 Stabilization (including level control) 5.2 Local disturbance rejection (inner cascades)
What more to control? (secondary variables)Step 6. SUPERVISORY CONTROL LAYER
Decentralized or multivariable control (MPC)?Pairing?
Step 7. OPTIMIZATION LAYER (RTO)

119
Step 5. Regulatory control layer
• Purpose: “Stabilize” the plant using local SISO PID controllers
• Enable manual operation (by operators)
• Main structural issues:• What more should we control? (secondary cv’s, y2)
• Pairing with manipulated variables (mv’s u2)
y1 = c
y2 = ?

120
Regulatory loops
GKy2s u2
y2
y1
Key decision: Choice of y2 (controlled variable)
Also important (since we almost always use single loops in the regulatory control layer): Choice of u2 (“pairing”)

121
Example: Distillation
• Primary controlled variable: y1 = c = xD, xB (compositions top, bottom)
• BUT: Delay in measurement of x + unreliable
• Regulatory control: For “stabilization” need control of (y2):
– Liquid level condenser (MD)
– Liquid level reboiler (MB)
– Pressure (p)
– Holdup of light component in column (temperature profile)
Unstable (Integrating) + No steady-state effect
Disturbs (“destabilizes”) other loops
Almost unstable (integrating)
TCTs
T-loop in bottom

122
XC
TC
FC
ys
y
Ls
Ts
L
T
z
XC
Cascade control
distillation
With flow loop +T-loop in top

123
Degrees of freedom unchanged
• No degrees of freedom lost by control of secondary (local) variables as setpoints become y2s replace inputs u2 as new degrees of freedom
GKy2s u2
y2
y1
Original DOFNew DOF
Cascade control:

124
Hierarchical control: Time scale separation
• With a “reasonable” time scale separation between the layers(typically by a factor 5 or more in terms of closed-loop response time)
we have the following advantages:
1. The stability and performance of the lower (faster) layer (involving y2) is not much influenced by the presence of the upper (slow) layers (involving y1)
Reason: The frequency of the “disturbance” from the upper layer is well inside the bandwidth of the lower layers
2. With the lower (faster) layer in place, the stability and performance of the upper (slower) layers do not depend much on the specific controller settings used in the lower layers
Reason: The lower layers only effect frequencies outside the bandwidth of the upper layers

125
Objectives regulatory control layer1. Allow for manual operation
2. Simple decentralized (local) PID controllers that can be tuned on-line
3. Take care of “fast” control
4. Track setpoint changes from the layer above
5. Local disturbance rejection
6. Stabilization (mathematical sense)
7. Avoid “drift” (due to disturbances) so system stays in “linear region”– “stabilization” (practical sense)
8. Allow for “slow” control in layer above (supervisory control)
9. Make control problem easy as seen from layer above
Implications for selection of y2:
1. Control of y2 “stabilizes the plant”
2. y2 is easy to control (favorable dynamics)

126
1. “Control of y2 stabilizes the plant”
A. “Mathematical stabilization” (e.g. reactor): • Unstable mode is “quickly” detected (state observability) in the
measurement (y2) and is easily affected (state controllability) by the input (u2).
• Tool for selecting input/output: Pole vectors – y2: Want large element in output pole vector: Instability easily
detected relative to noise – u2: Want large element in input pole vector: Small input usage
required for stabilization
B. “Practical extended stabilization” (avoid “drift” due to disturbance sensitivity):
• Intuitive: y2 located close to important disturbance• Or rather: Controllable range for y2 is large compared to sum of
optimal variation and control error • More exact tool: Partial control analysis

127
Recall rule for selecting primary controlled variables c:
Controlled variables c for which their controllable range is large compared to their sum of optimal variation and control error
Control variables y2 for which their controllable range is large compared to their sum of optimal variation and control error
controllable range = range y2 may reach by varying the inputs
optimal variation: due to disturbances
control error = implementation error n
Restated for secondary controlled variables y2:
Want small
Want large

128
What should we control (y2)?Rule: Maximize the scaled gain
• General case: Maximize minimum singular value of scaled G• Scalar case: |Gs| = |G| / span
• |G|: gain from independent variable (u2) to candidate controlled variable (y2)– IMPORTANT: The gain |G| should be evaluated at the (bandwidth)
frequency of the layer above in the control hierarchy! This can be very different from the steady-state gain used for selecting primary
controlled variables (y1=c)
• span (of y2) = optimal variation in y2 + control error for y2– Note optimal variation: This is often the same as the optimal variation used for selecting primary
controlled variables (c). – Exception: If we at the “fast” regulatory time scale have some yet unused “slower” inputs (u 1)
which are constant then we may want find a more suitable optimal variation for the fast time scale.

129
Minimize state drift by controlling y2
• Problem in some cases: “optimal variation” for y2 depends on overall control objectives which may change
• Therefore: May want to “decouple” tasks of stabilization (y2) and optimal operation (y1)
• One way of achieving this: Choose y2 such that “state drift” dw/dd is minimized
• w = Wx – weighted average of all states• d – disturbances
• Some tools developed: – Optimal measurement combination y2=Hy that minimizes state drift
(Hori) – see Skogestad and Postlethwaite (Wiley, 2005) p. 418– Distillation column application: Control average temperature column

130
2. “y2 is easy to control” (controllability)
1. Statics: Want large gain (from u2 to y2)
2. Main rule: y2 is easy to measure and located close to available manipulated variable u2 (“pairing”)
3. Dynamics: Want small effective delay (from u2 to y2)
• “effective delay” includes • inverse response (RHP-zeros)
• + high-order lags

131
Rules for selecting u2 (to be paired with y2)
1. Avoid using variable u2 that may saturate (especially in loops at the bottom of the control hieararchy)• Alternatively: Need to use “input resetting” in higher layer
• Example: Stabilize reactor with bypass flow (e.g. if bypass may saturate, then reset in higher layer using cooling flow)
2. “Pair close”: The controllability, for example in terms a small effective delay from u2 to y2, should be good.

132
Effective delay and tunings
• θ = effective delay
• PI-tunings from “SIMC rule”
• Use half rule to obtain first-order model – Effective delay θ = “True” delay + inverse response time constant + half of
second time constant + all smaller time constants
– Time constant τ1 = original time constant + half of second time constant
– NOTE: The first (largest) time constant is NOT important for controllability!
133
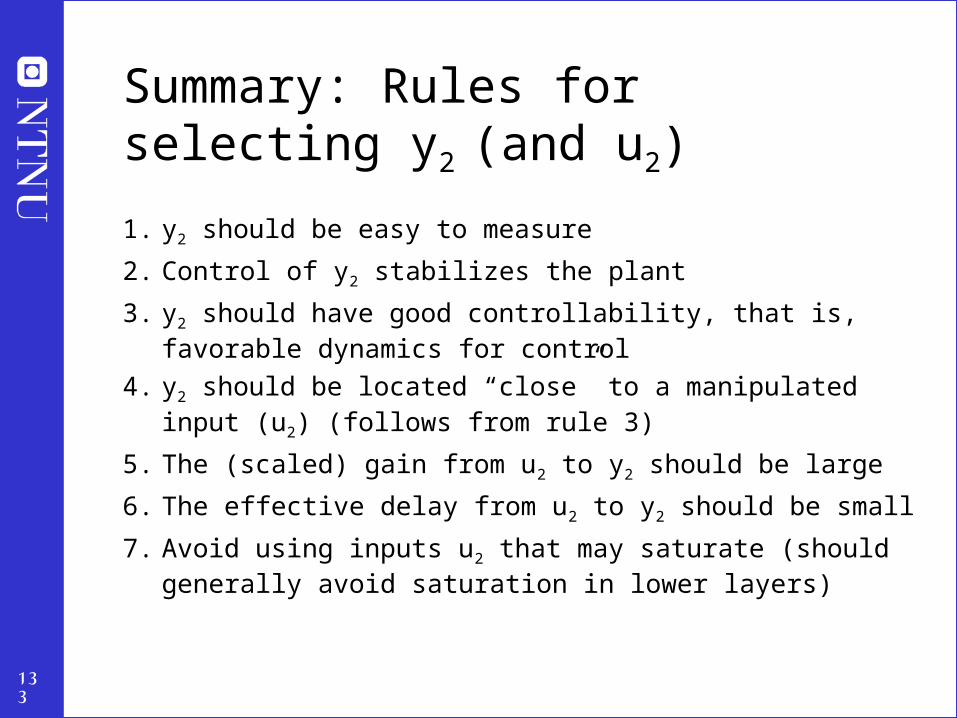
Summary: Rules for selecting y2 (and u2)
1. y2 should be easy to measure
2. Control of y2 stabilizes the plant
3. y2 should have good controllability, that is, favorable dynamics for control
4. y2 should be located “close” to a manipulated input (u2) (follows from rule 3)
5. The (scaled) gain from u2 to y2 should be large
6. The effective delay from u2 to y2 should be small
7. Avoid using inputs u2 that may saturate (should generally avoid saturation in lower layers)

134
Example regulatory control: Distillation(see separate slides)
5 dynamic DOFs (L,V,D,B,VT)
Overall objective: Control compositions (xD and xB)
“Obvious” stabilizing loops:1. Condenser level (M1)2. Reboiler level (M2)3. Pressure
E.A. Wolff and S. Skogestad, ``Temperature cascade control of distillation columns'', Ind.Eng.Chem.Res., 35, 475-484, 1996.

135
Selecting measurements and inputs for stabilization: Pole vectors
• Maximum gain rule is good for integrating (drifting) modes
• For “fast” unstable modes (e.g. reactor): Pole vectors useful for determining which input (valve) and output (measurement) to use for stabilizing unstable modes
• Assumes input usage (avoiding saturation) may be a problem

136

137

138
Example: Tennessee Eastman challenge problem

139

140

141

142

143

144

145
Control configuration elements
• Control configuration. The restrictions imposed on the overall controller by decomposing it into a set of local controllers (subcontrollers, units, elements, blocks) with predetermined links and with a possibly predetermined design sequence where subcontrollers are designed locally.
Control configuration elements:
• Cascade controllers
• Decentralized controllers
• Feedforward elements
• Decoupling elements

146
• Cascade control arises when the output from one controller is the input to another. This is broader than the conventional definition of cascade control which is that the output from one controller is the reference command (setpoint) to another. In addition, in cascade control, it is usually assumed that the inner loop K2 is much faster than the outer loop K1.
• Feedforward elements link measured disturbances to manipulated inputs.
• Decoupling elements link one set of manipulated inputs (“measurements”) with another set of manipulated inputs. They are used to improve the performance of decentralized control systems, and are often viewed as feedforward elements (although this is not correct when we view the control system as a whole) where the “measured disturbance” is the manipulated input computed by another decentralized controller.
147
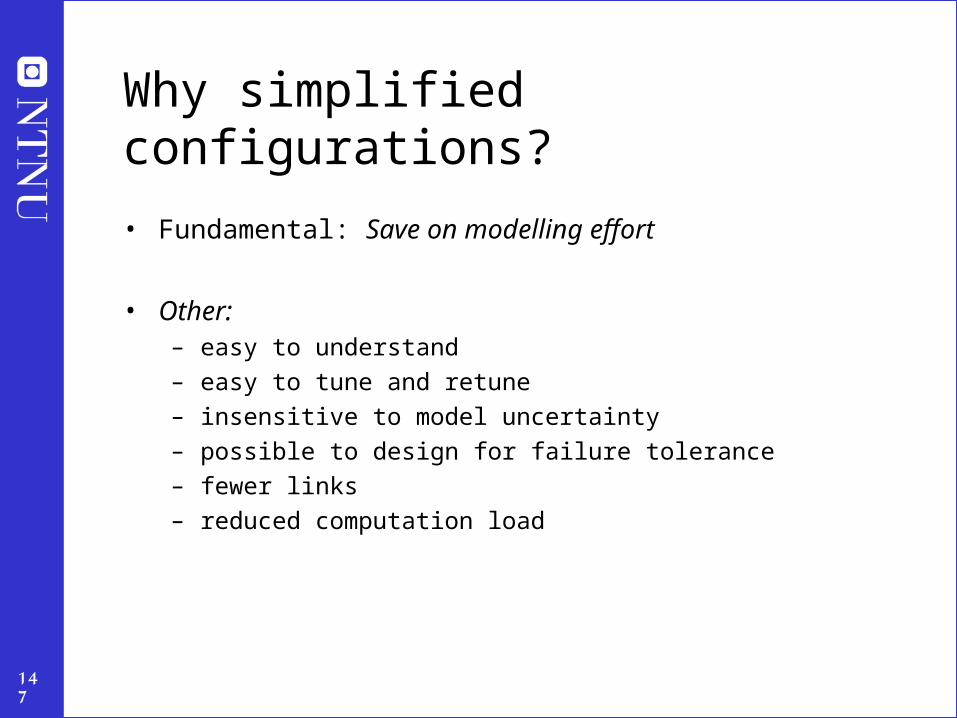
Why simplified configurations?
• Fundamental: Save on modelling effort
• Other: – easy to understand
– easy to tune and retune
– insensitive to model uncertainty
– possible to design for failure tolerance
– fewer links
– reduced computation load

148
Cascade control(conventional; with extra measurement)
The reference r2 is an output from another controller
General case (“parallel cascade”)
Special common case (“series cascade”)

149
Series cascade
1. Disturbances arising within the secondary loop (before y2) are corrected by the secondary controller before they can influence the primary variable y1
2. Phase lag existing in the secondary part of the process (G2) is reduced by the secondary loop. This improves the speed of response of the primary loop.
3. Gain variations in G2 are overcome within its own loop.
Thus, use cascade control (with an extra secondary measurement y2) when:• The disturbance d2 is significant and G1 has an effective delay• The plant G2 is uncertain (varies) or n onlinear
Design:• First design K2 (“fast loop”) to deal with d2
• Then design K1 to deal with d1

150
Tuning cascade
• Use SIMC tuning rules
• K2 is designed based on G2 (which has effective delay 2)
– then y2 = T2 r2 + S2 d2 where S2 ¼ 0 and T2 ¼ 1 ¢ e-(2+c2)s
• T2: gain = 1 and effective delay = 2+c2
• SIMC-rule: c2 ¸ 2
• Time scale separation: c2 · c1/5 (approximately)
• K1 is designed based on G1T2
• same as G1 but with an additional delay 2+c2
y2 = T2 r2 + S2d2

151
Exercise: Tuning cascade
1. (without cascade, i.e. no feedback from y2).
Design a controller based on G1G
2. (with cascade)Design K2 and then K1

152
Tuning cascade control

153
Extra inputs
• Exercise: Explain how “valve position control” fits into this framework. As en example consider a heat exchanger with bypass

154
Exercise
• Exercise: (a) In what order would you tune the controllers?
(b) Give a practical example of a process that fits into this block diagram

155
• Cascade control: y2 not important in itself, and setpoint (r2) is available for control of y1
• Decentralized control (using sequential design): y2 important in itself
Partial control

156
Partial control analysis
y1 = P1 u1 + Pr1 (y2s-n2) + Pd1 dP1 = G11 – G12 G22
-1 G21
Pd1 = Gd1 – G12 G22-1 Gd2 - WANT SMALL
Pr1 = G12 G22-1
Primary controlled variable y1 = c(supervisory control layer)
Local control of y2
using u2
(regulatory control layer)
Setpoint y2s : new DOF for supervisory control

157
Partial control: Distillation
y1 = P1 u1 + Pr1 (y2s-n2) + Pd1 dP1 = G11 – G12 G22
-1 G21
Pd1 = Gd1 – G12 G22-1 Gd2 - WANT SMALL
Pr1 = G12 G22-1
Supervisory control:
Primary controlled variables y1 = c = (xD xB)T
Regulatory control:
Control of y2=Tusing u2 = L (original DOF)
Setpoint y2s = Ts : new DOF for supervisory control
u1 = V

158
Limitations of partial control?
• Cascade control: Closing of secondary loops does not by itself impose new problems
– Theorem 10.2 (SP, 2005). The partially controlled system [P1 Pr1]
from [u1 r2] to y1
has no new RHP-zeros that are not present in the open-loop system [G11 G12]
from [u1 u2] to y1
provided
• r2 is available for control of y1
• K2 has no RHP-zeros
• Decentralized control (sequential design): Can introduce limitations.– Avoid pairing on negative RGA for u2/y2 – otherwise Pu likely has a RHP-
zero
BREAK

159
Outline
• Control structure design (plantwide control)
• A procedure for control structure designI Top Down
• Step 1: Degrees of freedom
• Step 2: Operational objectives (optimal operation)
• Step 3: What to control ? (primary CV’s) (self-optimizing control)
• Step 4: Where set production rate?
II Bottom Up • Step 5: Regulatory control: What more to control (secondary CV’s) ?
• Step 6: Supervisory control
• Step 7: Real-time optimization
• Case studies

160
Step 6. Supervisory control layer
• Purpose: Keep primary controlled outputs c=y1 at optimal setpoints cs
• Degrees of freedom: Setpoints y2s in reg.control layer
• Main structural issue: Decentralized or multivariable?

161
Decentralized control(single-loop controllers)
Use for: Noninteracting process and no change in active constraints
+ Tuning may be done on-line
+ No or minimal model requirements
+ Easy to fix and change
- Need to determine pairing
- Performance loss compared to multivariable control
- Complicated logic required for reconfiguration when active constraints move

162
Multivariable control(with explicit constraint handling = MPC)
Use for: Interacting process and changes in active constraints
+ Easy handling of feedforward control
+ Easy handling of changing constraints• no need for logic
• smooth transition
- Requires multivariable dynamic model
- Tuning may be difficult
- Less transparent
- “Everything goes down at the same time”

163
Outline
• Control structure design (plantwide control)
• A procedure for control structure designI Top Down
• Step 1: Degrees of freedom
• Step 2: Operational objectives (optimal operation)
• Step 3: What to control ? (self-optimizing control)
• Step 4: Where set production rate?
II Bottom Up • Step 5: Regulatory control: What more to control ?
• Step 6: Supervisory control
• Step 7: Real-time optimization
• Case studies

164
Step 7. Optimization layer (RTO)
• Purpose: Identify active constraints and compute optimal setpoints (to be implemented by supervisory control layer)
• Main structural issue: Do we need RTO? (or is process self-optimizing)
• RTO not needed when– Can “easily” identify change in active constraints (operating region)
– For each operating region there exists self-optimizing var

165
Outline
• Control structure design (plantwide control)
• A procedure for control structure designI Top Down
• Step 1: Degrees of freedom
• Step 2: Operational objectives (optimal operation)
• Step 3: What to control ? (self-optimizing control)
• Step 4: Where set production rate?
II Bottom Up • Step 5: Regulatory control: What more to control ?
• Step 6: Supervisory control
• Step 7: Real-time optimization
• Conclusion / References

166
Summary: Main steps
1. What should we control (y1=c=z)?
• Must define optimal operation!
2. Where should we set the production rate?• At bottleneck
3. What more should we control (y2)?
• Variables that “stabilize” the plant
4. Control of primary variables• Decentralized?
• Multivariable (MPC)?

167
Conclusion
Procedure plantwide control:
I. Top-down analysis to identify degrees of freedom and primary controlled variables (look for self-optimizing variables)
II. Bottom-up analysis to determine secondary controlled variables and structure of control system (pairing).

168
More examples and case studies
• HDA process
• Cooling cycle
• Distillation (C3-splitter)
• Blending

169
References• Halvorsen, I.J, Skogestad, S., Morud, J.C., Alstad, V. (2003), “Optimal selection of controlled
variables”, Ind.Eng.Chem.Res., 42, 3273-3284.• Larsson, T. and S. Skogestad (2000), “Plantwide control: A review and a new design
procedure”, Modeling, Identification and Control, 21, 209-240. • Larsson, T., K. Hestetun, E. Hovland and S. Skogestad (2001), “Self-optimizing control of a
large-scale plant: The Tennessee Eastman process’’, Ind.Eng.Chem.Res., 40, 4889-4901. • Larsson, T., M.S. Govatsmark, S. Skogestad and C.C. Yu (2003), “Control of reactor,
separator and recycle process’’, Ind.Eng.Chem.Res., 42, 1225-1234• Skogestad, S. and Postlethwaite, I. (1996, 2005), Multivariable feedback control, Wiley
• Skogestad, S. (2000). “Plantwide control: The search for the self-optimizing control structure”. J. Proc. Control 10, 487-507.
• Skogestad, S. (2003), ”Simple analytic rules for model reduction and PID controller tuning”, J. Proc. Control, 13, 291-309.
• Skogestad, S. (2004), “Control structure design for complete chemical plants”, Computers and Chemical Engineering, 28, 219-234. (Special issue from ESCAPE’12 Symposium, Haag, May 2002).
• … + more…..
See home page of S. Skogestad:
http://www.nt.ntnu.no/users/skoge/


