1 PPB GROUP BERHAD Half Year Results 30 June 2007 Presented by Koh Mei Lee Senior Manager (Corporate Affairs) Disclaimer : The contents of this presentation include materials which may be capable of being interpreted as forward-looking statements. Such statements are merely predictions and targets, based on circumstances and reasonable assumptions which apply only at the date of such statements. Accordingly, no reliance should be placed on any forward-looking statements, express or implied, contained in this presentation.
Transcript
1
PPB GROUP BERHAD
Half Year Results 30 June 2007Presented by Koh Mei LeeSenior Manager (Corporate Affairs)
Disclaimer: The contents of this presentation include materials which may be capable of being interpreted as forward-looking statements. Such statements are merely predictions and targets, based on circumstances and reasonable assumptions which apply
only at the date of such statements. Accordingly, no reliance should be placed on any forward-looking statements, express or implied, contained in this presentation.
2
Agenda
1. Group Financial Highlights
3. Share Information
4. Prospects for 2007
2. Dividend Record
3
Group Financial Highlights
4
Financial Results for half year ended 30 June 2007
Continuing Operations
Discontinued Operations
◘ Sugar & Cane Plantation
◘ Grains trading, flour & feed milling
◘ Waste management & utilities
◘ Film exhibition ◘ Property
◘ Others
◘ Edible oil refining & trading
◘ Oil palm plantations
5
Revenue 1.212 bil
Operating Expenses
1.418 bil
1.156 bil 1.299 bil
2006 (RM) 2007 (RM) Change
17%
12%
Continuing Operations
PBT * 196.0 mil 203.8 mil 4%
EPS 11.43 sen 13.43 sen 17%
* PBT includes 2-month share of Wilmar results from May 2007 amounting to RM22 million.* PBT also includes PPB’s 25% share of losses incurred by Trinity Coral Sdn Bhd amounting to RM35 million.
Financial Results for half year ended 30 June 2007
6
4.011 bil 3.165 bil
3.880 bil 3.056 bil
2006 (RM) 2007 (RM) Change
21%
21%
Discontinued Operations
Operating RevenueOperating Expenses
PBT* (one-off gain)
EPS(one-off gain)
- 6.393 bil
12%
- 539.26sen
Financial Results for half year ended 30 June 2007
* PBT from operations includes 4 months PBT of PPBOP and PGEO and 6 months PAT of KOG
EPS(from operations) 9.06 sen 10.93 sen 21%
-
PBT*(from operations)
0.178 bil 0.199 bil
-
7
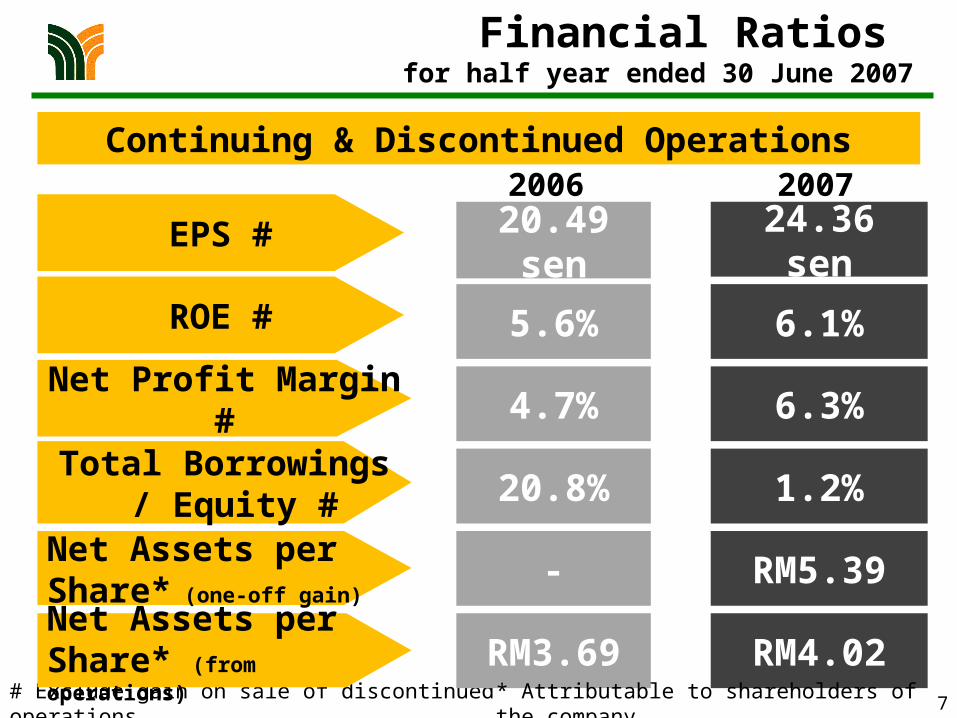
ROE # 5.6%
Net Profit Margin #
6.1%
4.7% 6.3%
2006 2007Continuing & Discontinued Operations
Total Borrowings / Equity #
Net Assets per Share* (one-off gain)
20.8% 1.2%
- RM5.39
24.36 sen20.49 senEPS #
Financial Ratios for half year ended 30 June 2007
# Exclude gain on sale of discontinued operations
Net Assets per Share* (from operations)
RM3.69 RM4.02* Attributable to shareholders of the company
8
Segmental Informationfor half year ended 30 June 2007
Continuing operations
Discontinued operations
30%
70%
TOTAL REVENUE
9
Sugar & cane11.72%
Grains trading,flour & feed
milling 9.82%
Edible oilsrefining & trading
64.46%
Oil palmplantations
5.17%
Waste management &
utilities 0.45%
Film exhibition
1.60%
Property0.58%
Others6.20%
Total RevenueContinuing & discontinued
operations
Total RM4.583 billion
Discontinued Operations
≈ 70%
Segmental Informationfor half year ended 30 June 2007
10
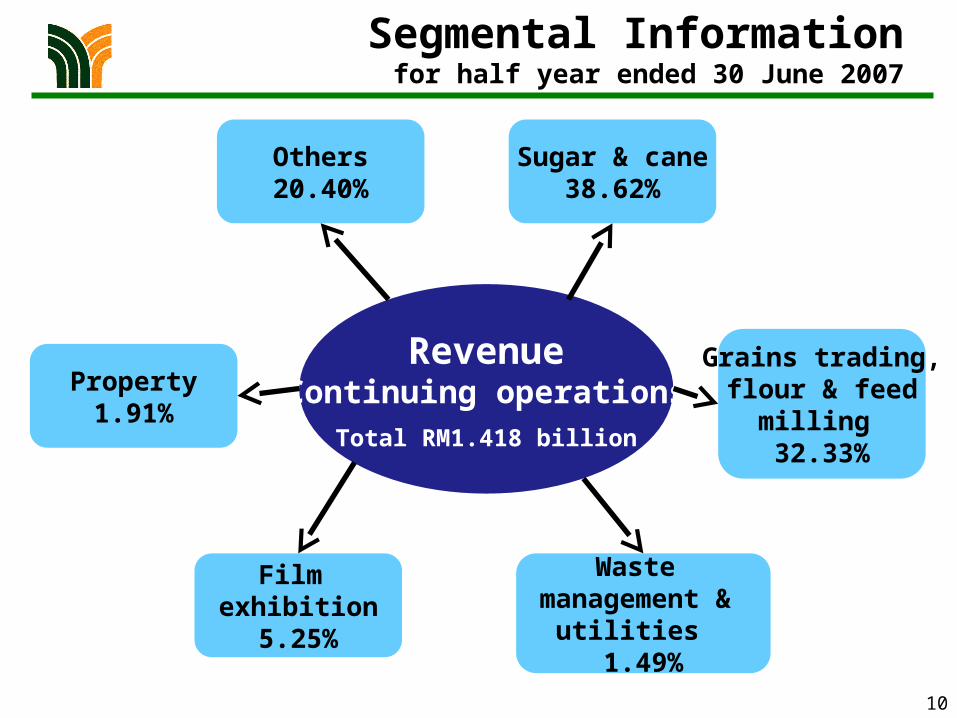
Sugar & cane38.62%
Grains trading,flour & feed
milling 32.33%
Waste management &
utilities 1.49%
Film exhibition
5.25%
Property1.91%
Others20.40%
RevenueContinuing operations
Total RM1.418 billion
Segmental Informationfor half year ended 30 June 2007
11
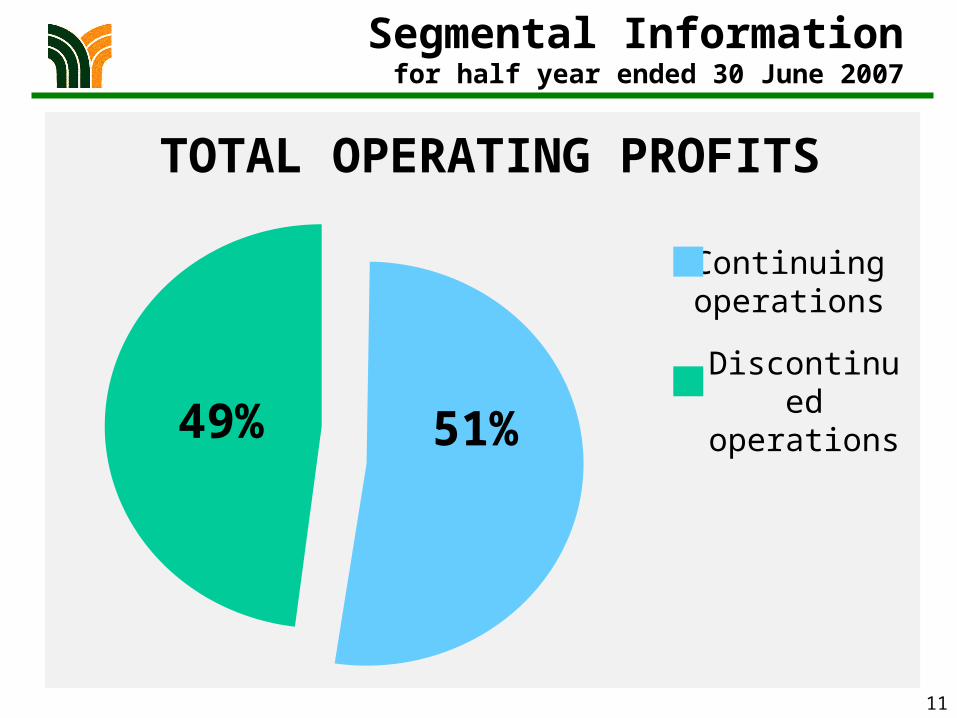
Segmental Informationfor half year ended 30 June 2007
51%49%
Continuing operations
Discontinued operations
TOTAL OPERATING PROFITS
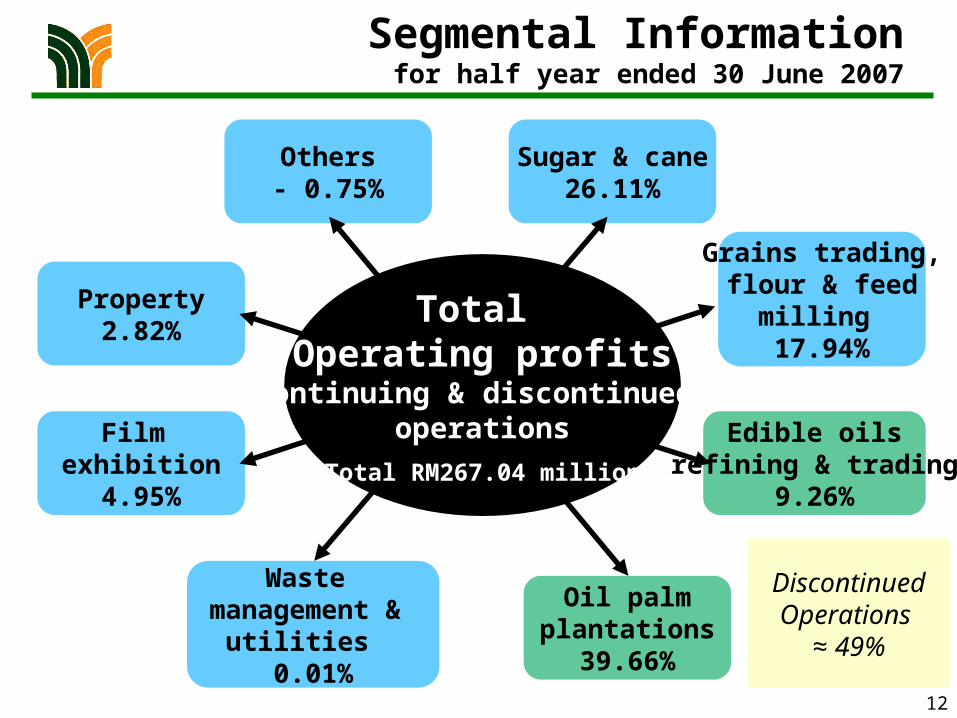
12
Sugar & cane26.11%
Grains trading,flour & feed
milling 17.94%
Edible oilsrefining & trading
9.26%
Oil palmplantations
39.66%
Waste management &
utilities 0.01%
Film exhibition
4.95%
Property2.82%
Others- 0.75%
Total Operating profits
Continuing & discontinued operations
Total RM267.04 million
Discontinued Operations
≈ 49%
Segmental Informationfor half year ended 30 June 2007
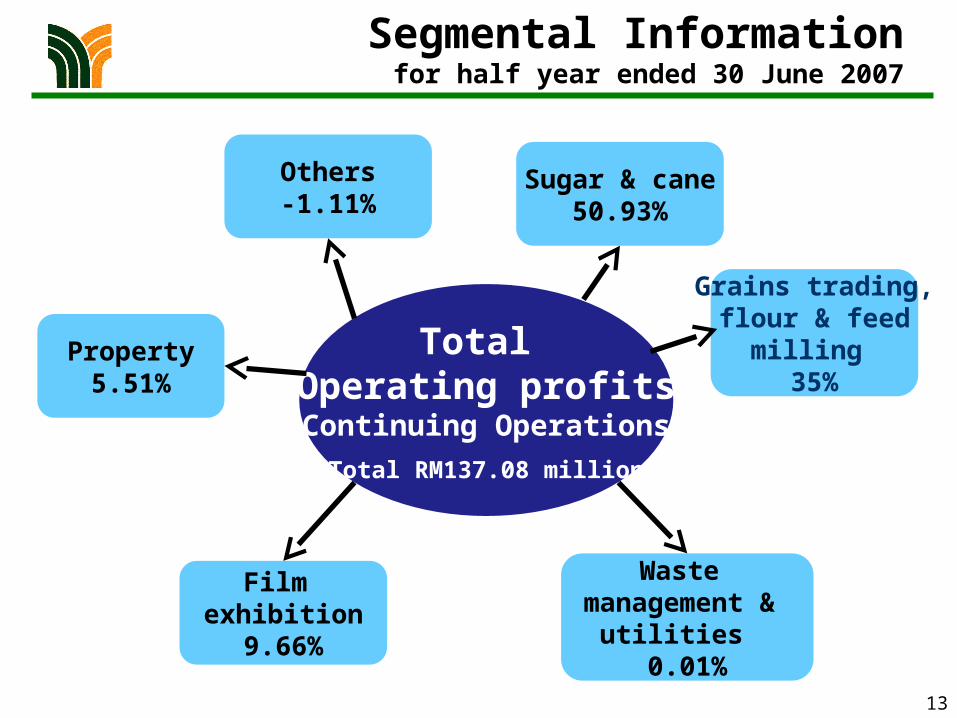
13
Sugar & cane50.93%
Grains trading,flour & feed
milling 35%
Waste management &
utilities 0.01%
Film exhibition
9.66%
Property5.51%
Others-1.11%
Total Operating profitsContinuing Operations
Total RM137.08 million
Segmental Informationfor half year ended 30 June 2007
14
Major Contributors to Group Operating Profit
Reason for higher profits
Sugar & cane Lower raw sugar prices. Higher export sales.
Grain trading, flour & feed milling Better buying of raw materials and freight.
Film exhibition Stronger performance of blockbuster films. More commercial films released.
Property Gain from sale of Masera units.
15
686 710 609 840
6,796
0
1,000
2,000
3,000
4,000
5,000
6,000
7,000
2003 2004 2005 2006 Jan -June2007
5-year PBT
RM Million
Year
Note: RM (mil)
Total PBT 6,796
One-off gain
6,393
PBT (excluding one-off gain)
403
16
1,142
1,083
505
578
745
802
57
15
42
59Net cash
Cash & deposits
Totalborrowings
LT borrowings
ST borrowings
30.6.06 30.6.07RM Million
Cash & Borrowingfor half year ended 30 June 2007
17
Dividend Record
18
Dividend Record
* The Board declared an interim dividend of 5 sen for the financial year 2007 which is payable on 28 September 2007.
Dividend Net NetPayout ratio
Per Share Dividend Dividend
Gross Net Paid/payable Yield Group Company
Year (sen) (sen) (RM Million) (%) (%) (%)
2007*Interim 5 3.65 43.271 0.5 0.6 1.2
2006 20 14.55 172.490 2.7 30.8 103.6
2005 20 14.40 170.712 3.5 43.3 115.9
2004 15 11.85 140.482 3.5 35.1 75.4
2003 12.5 10.26 100.675 3.1 27.1 72.3
19
Share Information
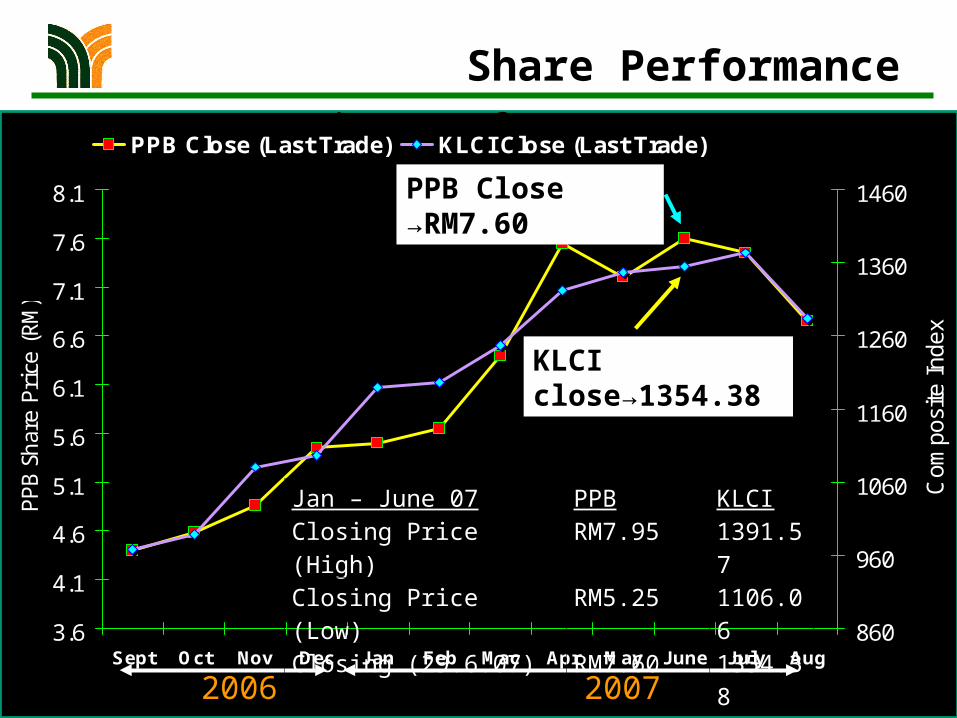
Share performance
3.6
4.1
4.6
5.1
5.6
6.1
6.6
7.1
7.6
8.1
Sept Oct Nov Dec Jan Feb Mac Apr May June July Aug
PPB
Shar
e Pr
ice
(RM
)
860
960
1060
1160
1260
1360
1460
Com
posi
te I
ndex
PPB Close (Last Trade) KLCI Close (Last Trade)
31/12/05
PPB Close →RM7.60
2006 2007
Share Performance
Jan – June 07 PPB KLCIClosing Price (High) RM7.95 1391.57Closing Price (Low) RM5.25 1106.06Closing (29.6.07) RM7.60 1354.38
KLCI close→1354.38
21
Prospects for 2007
22
Prospects for 2007
The Group’s sugar refining divisions, grains trading, flour and feed milling and other
divisions are expected to perform satisfactorily for the financial year.
It is anticipated that Wilmar will also be able to contribute positively in the financial year.
The Group operations should be able to maintain its financial performance for 2007.