1 Pre-regression Basics • Random Vs. Non-random variables • Stochastic Vs. Deterministic Relations • Correlation Vs. Causation • Regression Vs. Causation • Types of Data • Types of Variables • The Scientific Method • Necessary & Sufficient Conditions
Transcript
1
Pre-regression Basics
• Random Vs. Non-random variables• Stochastic Vs. Deterministic Relations• Correlation Vs. Causation• Regression Vs. Causation• Types of Data• Types of Variables• The Scientific Method• Necessary & Sufficient Conditions
2
Random Vs. Non-random Variables
• A random (stochastic, non-deterministic) variable is one whose value is not known ahead of time.
• EX: Your final grade, tomorrow’s temperature, Wednesday’s lecture topics
• What’s random to Jill may not be random to Joe.
3
Non-random Variables
• A non-random (deterministic, non-stochastic variable) is one whose value is known ahead of time or one whose past value is known.
• EX: Tomorrow’s date, yesterday’s temperature.
• Randomness & Time are linked
4
Probability
• Probability is the likelihood that a random variable will take on a certain value.
• EX: There is an 85% chance of snow tomorrow. Variable: Weather, Possible values: Snow, No snow.
• Probability Distribution: The set of all possible values of a random variable with the associated probabilities of each.
5
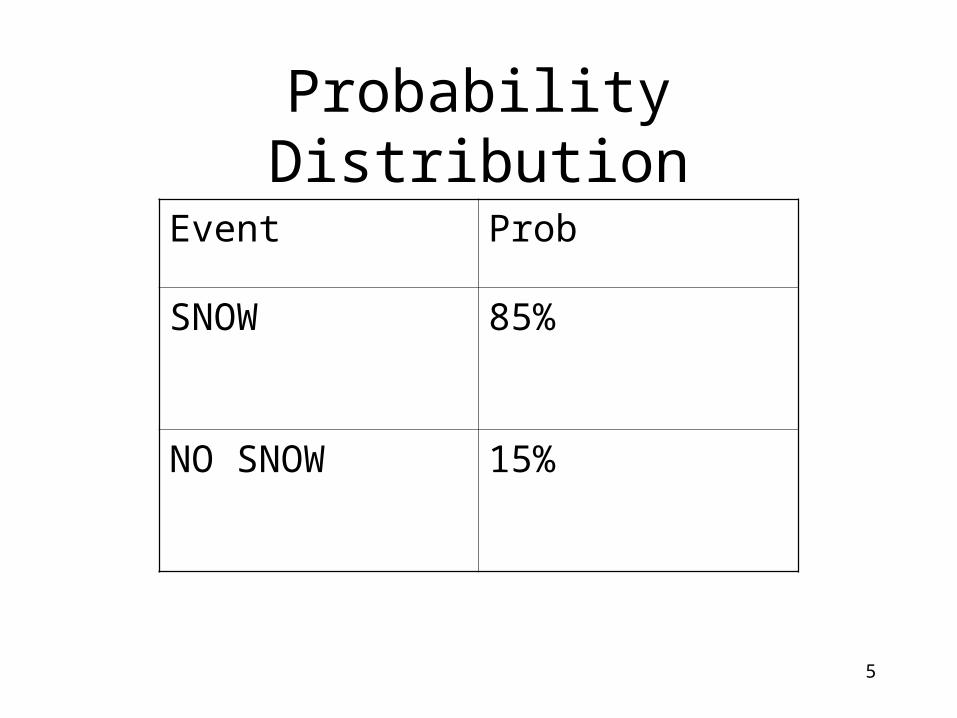
Probability Distribution
Event Prob
SNOW 85%
NO SNOW 15%
6
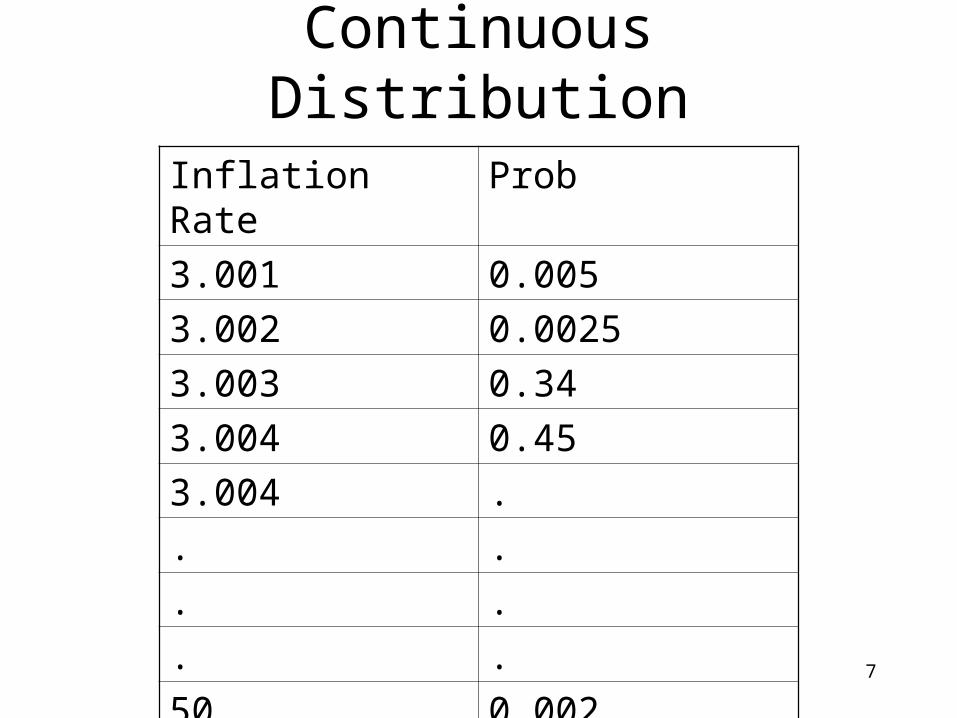
Continuous VS. Discrete Distributions
• A continuous distribution shows the probability of the different outcomes for a variable that can take one of several different values along a continuous scale.
• EX: Future inflation may be 3.001%, 3.002 % …50% etc. (The different possible values are close to each other along a smooth continuous scale)
7
Continuous Distribution
Inflation Rate Prob
3.001 0.005
3.002 0.0025
3.003 0.34
3.004 0.45
3.004 .
. .
. .
. .
50 0.002
8
Discrete Distribution
• A discrete distribution shows the probability of the different outcomes for a variable that can take one of several different values along a discrete scale.
• EX: The number of students in class next time may be 1, 2, 3 etc.
• In reality most distributions (in Econ) are discrete but we sometimes assume continuity for theoretical & analytical ease.
9
Discrete Distribution
STUDENTS PROB.
1 0.005
2 0.05
3 0.5
10
Subjective & Objective Distributions
• A subjective distribution is when a person has some idea of what the probabilities of the different outcomes (for a RV) are but does not have the exact numbers.
• EX: I have a pretty good guess that I will do well in this class.
11
Objective Distributions
• An objective distribution is when the probabilities of each outcome are based on the number of times the outcome occurs divided by the total number of outcomes.
• EX: The probability of drawing a red ball from a jar with 5 red balls and a total of 50 balls is 5/50 or 1 chance in 10.
• Should all probabilities of an event sum to one?
12
Intellectual Doubletalk
• A non-random variable is a random variable with a degenerate distribution.
• Translation: Any certain event can be expressed as random event that happens with probability one.
13
Stochastic Vs. Deterministic Relations
• Deterministic relationships are exact formulas where the dependent and independent variables are non-random.
• EX: Ohm’s Law Current = k*Voltage• Stochastic relationships are not exact formulas that
relate dependent and independent variables.• EX: Quantity demanded = f(Price, Random Term)• Sources of Randomness: Measurement error,
unobservable variables etc.
14
Correlation Vs. Causation• Loosely speaking correlation is the phenomenon of two
(or more) given variables exhibiting a roughly systematic pattern of movement.– Ex: Most of the time when stock prices fall the bond market
rallies.
• Causation is when one of the variables actually causes the other variable to change.
• Correlation does not imply correlation.• Causation implies correlation.• Causation that is not supported by correlation needs to
be examined carefully.
15
Regression Vs. Causation
• A significant sign on a regression coefficient does not imply causation.
• However if you suspect causation between X & Y and the regression does not support this you must proceed with caution. What is causing the lack of significance? Experimental design flaw, unobservable variables or poor theory?
16
Types of Data• Time Series Data: The data are gathered over the
same set of variables in different time periods.– EX: Price and Quantity of Summit Pale Ale Beer for a
ten year period.
• Cross Sectional Data: The data are gathered over the same set of variables at a point in time over different cross-sections.– Ex: Quantity & Price of beer in ’02 across the fifty
states.– EX2: Advertising and sales data across different firms
in MN in ‘02
17
Types of Data
• Pooled Data: The dataset is essentially a cross-sectional dataset collected over the same variables in each of several different time periods.
• EX: Cigarette Price & Quantity data in each of 50 states from 1955 – 1994.
18
Types of Variables
• Dependent (Endogenous)
• Independent(Exogenous)
• Discrete
• Continuous
• Categorical
19
Dependent Vs. Independent
• The determination of a dependent variable is explained by the theory.
• Independent variables come from outside the theory. We do not know what causes these variables but use the independent variables to study the dependent variable.
20
Simultaneity
• Simultaneity: A theory may have more than one dependent variable such that two or more dependent variables influence each other. Such a situation is referred to as a simultaneous relationship.
• EX: Equilibrium price and equilibrium quantity influence each other. Both are endogenous variables explained by price theory.
21
Discrete Vs. Continuous
• A discrete variable is one that takes on finitely many values. They do not have to be integers such as 1, 2, 3 etc.
• A continuous variable can take on infinitely many values.
• Dependent & Independent variables can be either discrete or continuous.
22
Categorical
• Some variables may be either discrete or continuous but may be grouped into categories for ease of analysis.
• EX: Age 0 – 10 yrs, 11 – 20 yrs etc.
23
Historical Origin of Regression
• Regression is the process of finding the line or curve that ‘best’ fit a given set of data points.
• Francis Galton “Family Likeness in Stature”, Proceedings of Royal Society London, vol. 40, 1886.
24
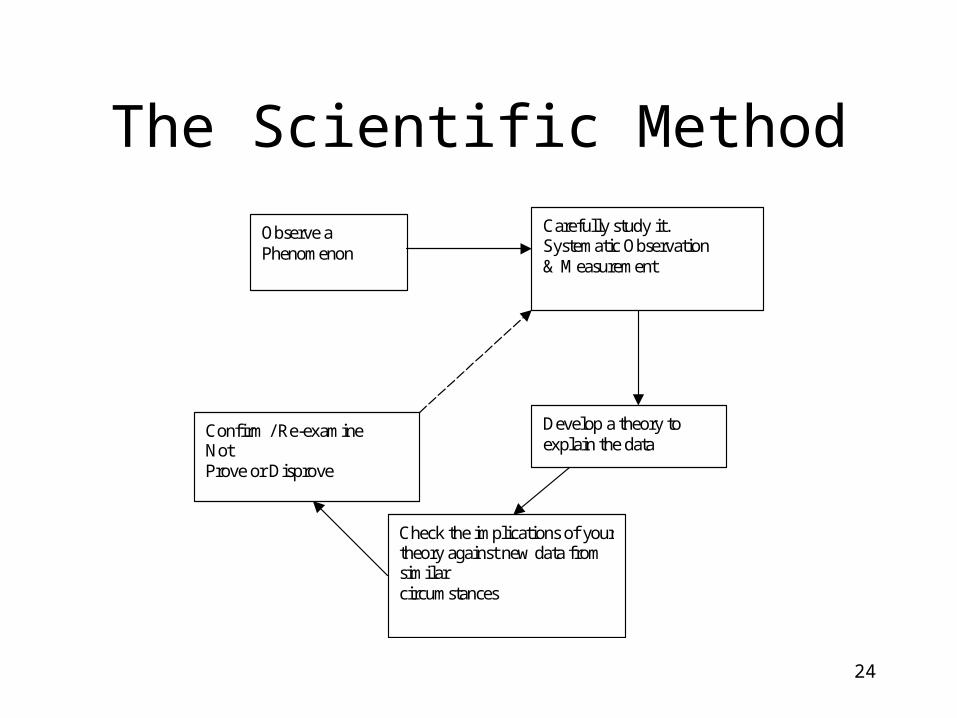
The Scientific Method Carefully study it.
Systematic Observation & Measurement
Confirm / Re-examine Not Prove or Disprove
Observe a Phenomenon
Develop a theory to explain the data
Check the implications of your theory against new data from similar circumstances
25
Necessary & Sufficient Conditions
• A is said to be a sufficient condition for B. If A happens B will be guaranteed to occur.
• EX: Ceteris Paribus, if it rains then the football field will be wet. Necessary & Sufficient Conditions.
BA
26
Testing Causality
• If A is observed and ceteris paribus B does not occur then the idea that A causes B is called into question.
• EX: Theory: C.P. Price is negatively related to quantity demanded. – We observe price falling and ceteris paribus
quantity demanded also falls. Does the data support the theory?
27
Testing Causality
• Econometrically we can estimate an equation for demand.
• Q = f(Price, Income, Other Variables)
• What is the predicted sign on the coefficient of price? (Is it significant?)
28
Fallacies
• Denying the antecedent:It did not rain therefore the football field cannot
be wet (How about a sprinkler system?)
• Affirming the consequent: The field is wet therefore it must have rained.
(Sprinklers may have been on)
BA ~~
AB
29
Contrapositive• The only logical equivalent to A=> B is the
contrapositive statement ~B => ~A.
• EX1: If it rains then the field will be wet.(Contrapositive) The field is dry therefore it did not rain.
• EX2: If cigarettes are addictive then past consumption influences present consumption. (Contrapositive) If past consumption does not influence
present consumption then cigarettes are not addictive.