1 Presentation for University of Chicago Physics Colloquium April 3, 2008 Burton Richter Freeman Spogli Institute of International Studies Senior Fellow Paul Pigott Professor in the Physical Sciences Emeritus Stanford University and Former Director Stanford Linear Accelerator Center
Transcript
1
Presentation for
University of Chicago Physics Colloquium
April 3, 2008
Burton RichterFreeman Spogli Institute of International Studies Senior Fellow
Paul Pigott Professor in the Physical Sciences EmeritusStanford University
andFormer Director
Stanford Linear Accelerator Center
10.000 5,000 0 Years before 2,005
Average Temperature of the Earth
Turn off Greenhouse Effect
All energy radiated from surface escapes.
Average T = -4°F (-20°C).
Turn on Greenhouse Effect
Part of energy radiated is blocked.
Surface T goes up so what gets through balances incoming.
Average T = 64°F (15°C).
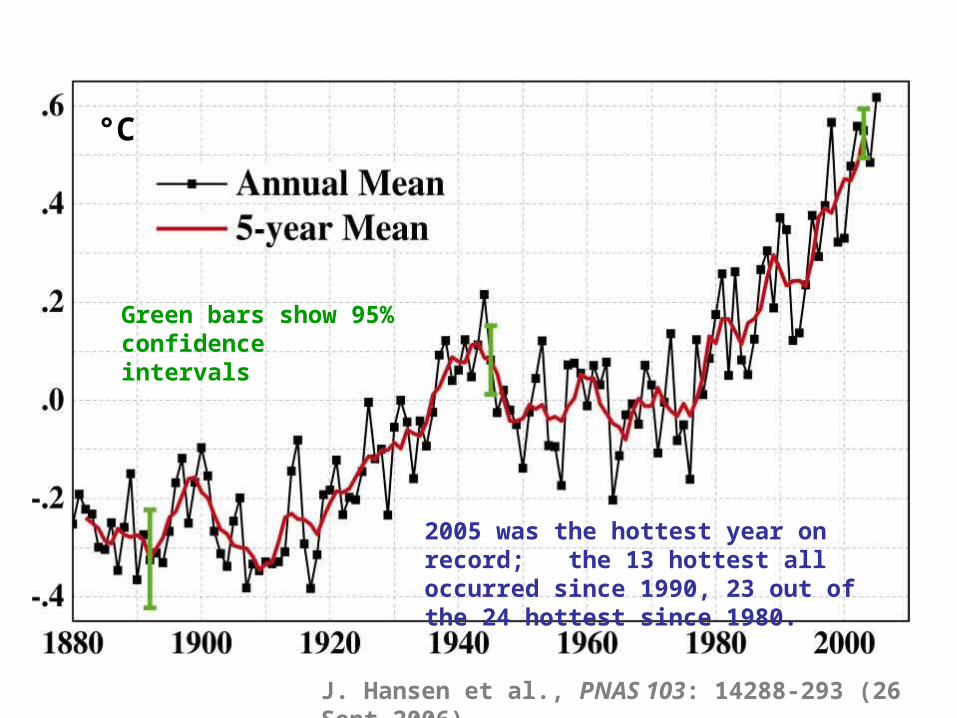
2005 was the hottest year on record; the 13 hottest all occurred since 1990, 23 out of the 24 hottest since 1980.
J. Hansen et al., PNAS 103: 14288-293 (26 Sept 2006)
Green bars show 95% confidence intervals
°C
IIASA Projection of Future Energy Demand Scenario A1 (High
Growth)
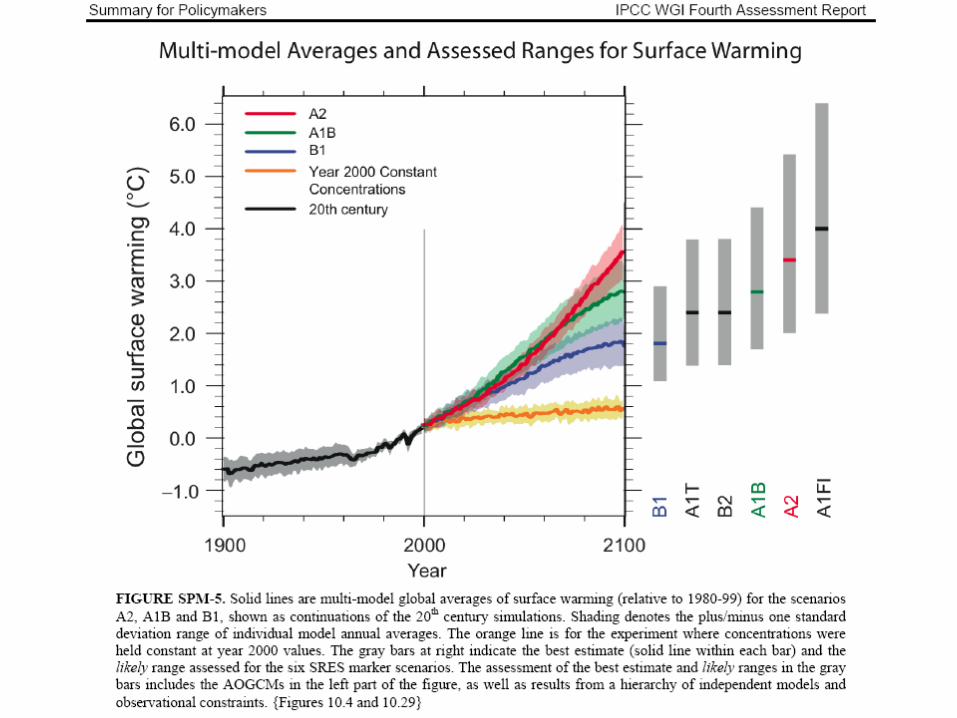
Projected Global Average Surface Warming at the End of the 21st Century
Source IPCC 4AR WG1
CaseTemperature changes
(degrees F) relative to 1980-1999
Best Estimate Range
B1 3.2 2.0 – 5.2
A1T 4.3 2.5 – 6.8
B2 4.3 2.5 – 6.8
A1B 5.0 3.1 – 7.9
A2 6.1 3.6 – 9.7
A1FI 7.2 4.3 – 11.5
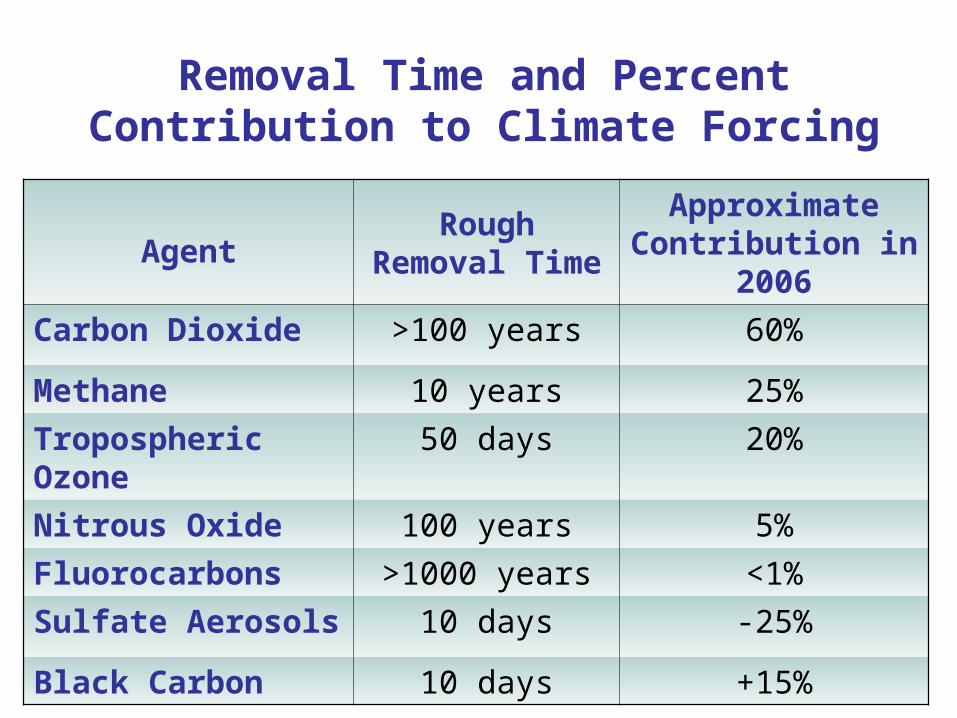
Removal Time and Percent Contribution to Climate Forcing
AgentRough Removal
Time
Approximate Contribution in
2006
Carbon Dioxide >100 years 60%
Methane 10 years 25%
Tropospheric Ozone 50 days 20%
Nitrous Oxide 100 years 5%
Fluorocarbons >1000 years <1%
Sulfate Aerosols 10 days -25%
Black Carbon 10 days +15%
Reference Scenario: World Primary Energy Demand
Global demand grows by more than half over the next quarter of a century, with coal use rising most in absolute terms
Oil
Coal
Gas
BiomassNuclear
Other renewables
0
2 000
4 000
6 000
8 000
10 000
12 000
14 000
16 000
18 000
1970 1980 1990 2000 2010 2020 2030
Mto
e
From International Energy Agency “World Energy Outlook 2006”
Total Primary Energy Supply by Fuel
YearFuel
2005 2030
Oil 35% 33%Coal 25% 26%
Gas 21% 23%
Nuclear 6% 5%Other* 12% 12%* = Includes combustibles (10% in 2005), hydro and renewables.
(Source: IEA “Key World Energy Statistics 2007”)
Path for 50% chance of avoiding ∆Tavg >2°C (gold) is much more
demanding than path for 50% chance of avoiding >3°C (green).
BAU ( 6°C+)
(~3°C)
(~2°C)
CO2 emissions paths: BAU versus stabilizing CO2
concentration to limit ∆Tavg
Primary Power Requirements for 2050 for Scenarios Stabilizing CO2
at 450 ppm and 550 ppm
Source2000 2050
450 ppm 550 ppm
Carbon Based 11 TW 7 TW 12 TW
Carbon Free 3 TW 20 TW 15 TW
M. Hoffert, et al., Nature, 395, p881, (Oct 20, 1998)
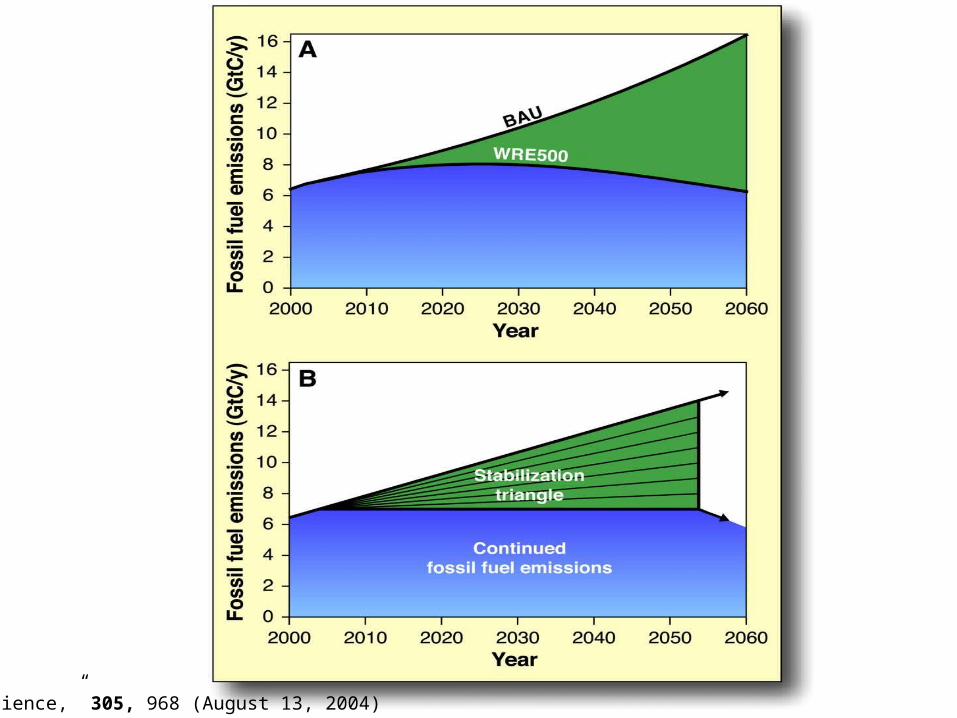
“Science,” 305, 968 (August 13, 2004)
Ready for Large-Scale Deployment Now
Conservation and Efficiency.
Nuclear for Baseload Application.
Ready for Limited Deployment Now
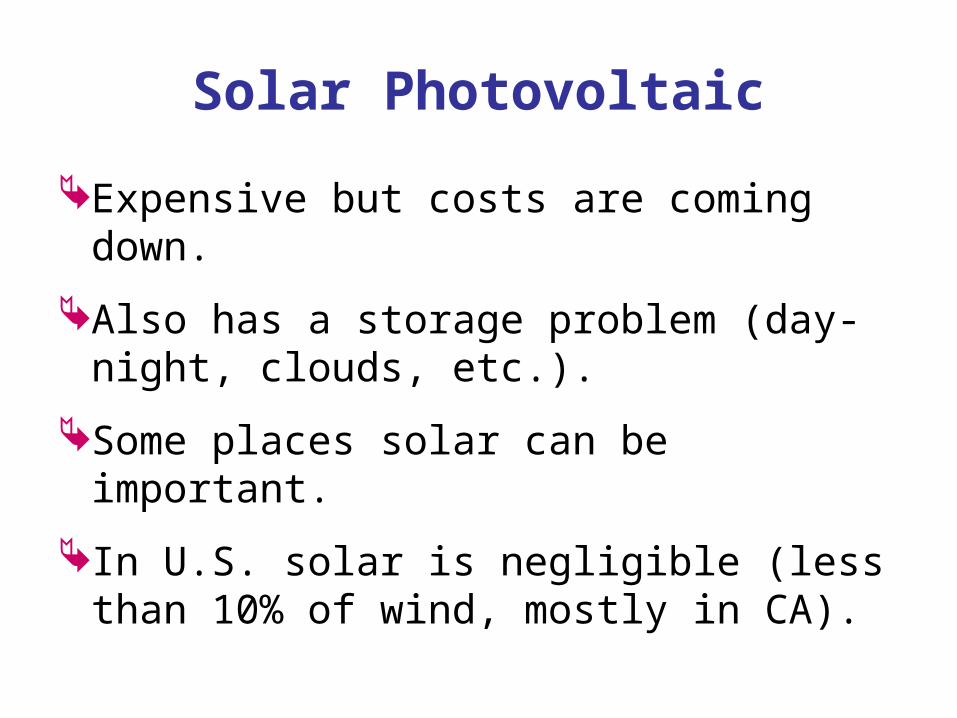
Solar for Daytime Use.
Wind with Back up from Others.
CARBON-FREE ENERGY
Energy Intensity and Composite Fuel Price in North America
Power (TW) Required in 2050 Versus Rate of Decline in Energy
Intensity
Carbon Dioxide Intensity andPer Capita CO2 Emissions -- 2001
Nationally about 11,000 Megawatts of installed capacity (2500 in CA).
But, the wind does not blow all the time and average energy delivered is about 20% of capacity.
Wind cannot be “baseload” power until an energy storage mechanism is found.
EON-NETZ (GERMANY) WIND POWER VARIABILITY
AVERAGE IS 20% OF INSTALLED WIND CAPACITY
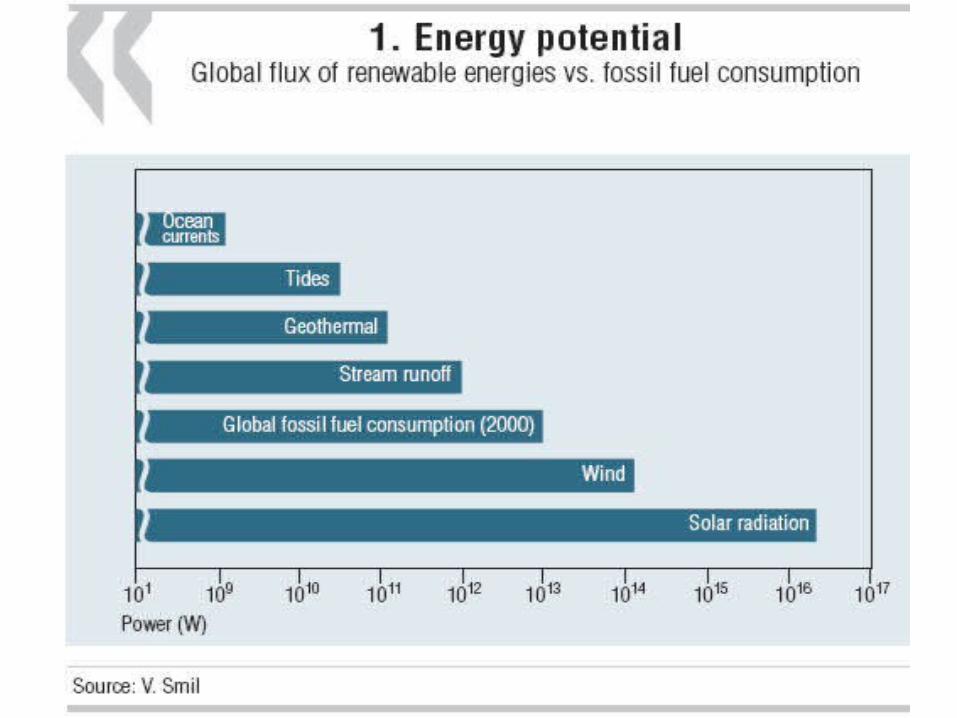
Other Renewables
Big Hydroelectric: About 50% developed world wide.
Geothermal: California, Philippines, and New Zealand are the largest (CA ≈ 1.5 Gigawatts).
Bio Fuel: A very complicated story, and verdict not yet in.
Coal
Largest Fossil Fuel Resource.
US & China each have about 25% of world resources.
IF CO2 emitted can be captured and safely stored underground, problem of reducing Greenhouse Gas emissions is much easier.
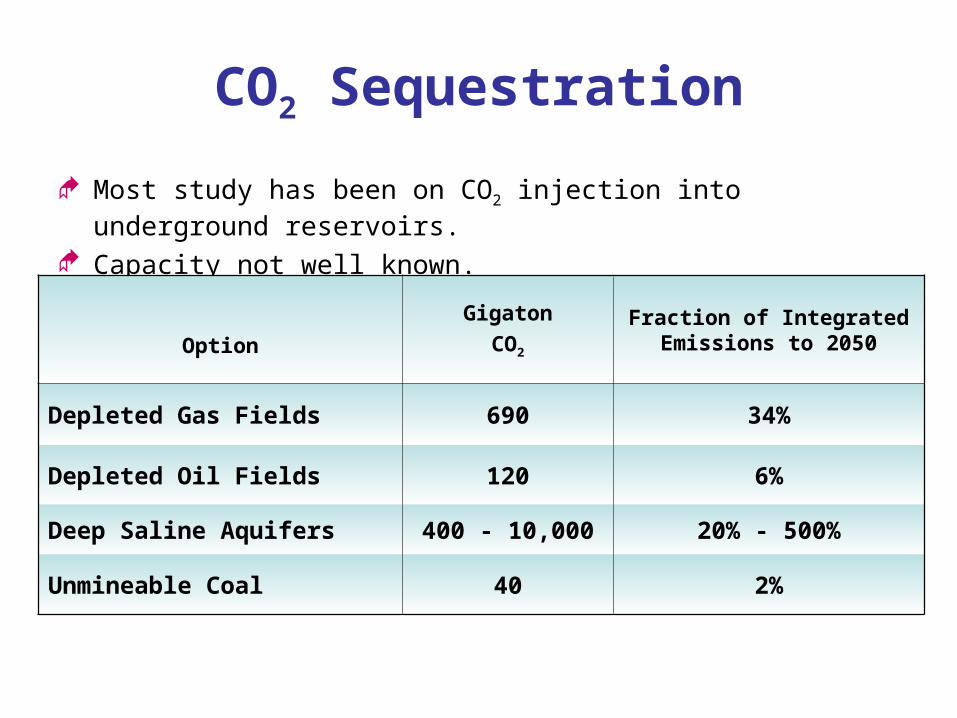
CO2 Sequestration
Most study has been on CO2 injection into underground reservoirs.
Capacity not well known.
Option
Gigaton
CO2
Fraction of Integrated Emissions to 2050
Depleted Gas Fields 690 34%
Depleted Oil Fields 120 6%
Deep Saline Aquifers 400 - 10,000 20% - 500%
Unmineable Coal 40 2%
FutureGen
$1 Billion Industry-Government Partnership to Generate Electricity & Sequester the CO2.
AreaGDP (ppp)
(Billions of U.S. Dollars)
CO2/GDP
Kg/$(ppp)
World 42,400 0.56
France 1,390 0.28
CO2 Intensity(IEA, Key World Energy Statistics 2003)
World Nuclear Expansion(as of December 2007)
Under construction 34
Approved and to be started 94
Under discussion 222
Total 350
The Nuclear Critics
It can’t compete in the market place.
It is too dangerous.We don’t know what to do with
spent fuel.Proliferation risk is too big to
accept.
Costs
Nuclear 1800 €≈$2500/KW (Areva)
Coal $1500 – 2000/KW (EIA)
Wind $1600/KW (peak) (NYT 5/1/07)
$8000/KW (avg.) (20% duty factor)
Solar $5000/KW (peak)(CA Energy
Commision)
$25,000/KW (avg.)
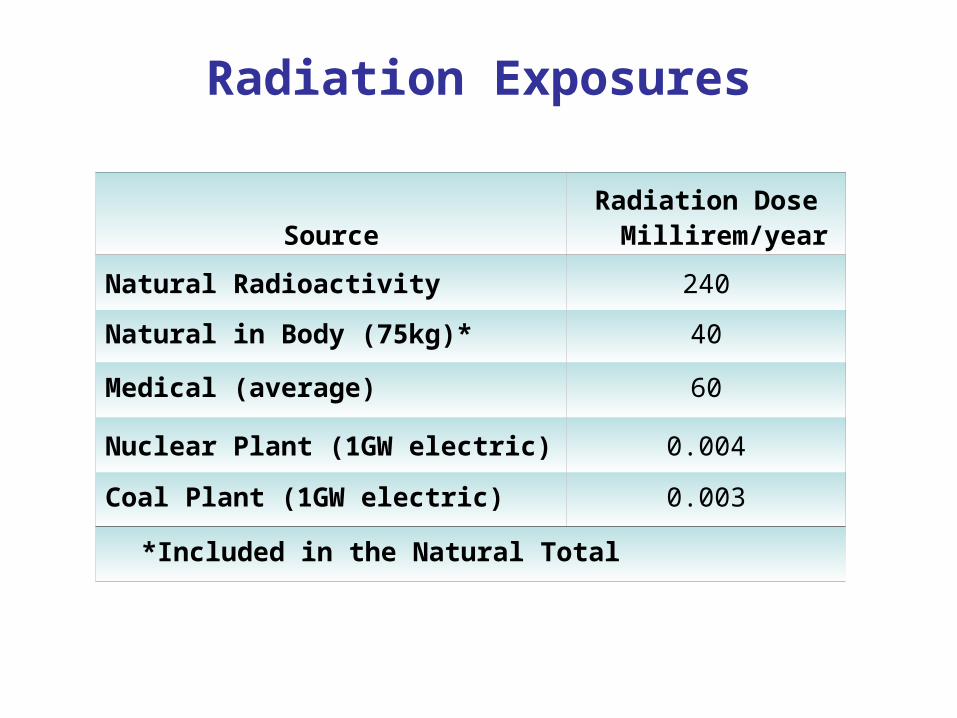
Radiation Exposures
SourceRadiation Dose
Millirem/year
Natural Radioactivity 240
Natural in Body (75kg)* 40
Medical (average) 60
Nuclear Plant (1GW electric) 0.004
Coal Plant (1GW electric) 0.003
*Included in the Natural Total
Nuclear Accidents
Chernobyl (1986) – World’s WorstReactor type not used outside of old Soviet bloc
(can become unstable)
Operators moved into unstable region and disabled all safety systems.
Three Mile Island (1979) – A Partial Core Meltdown
LWRs are not vulnerable to instabilities
All LWRs have containment building
Radiation in region near TMI about 10 mr.
New LWRs have even more safety systems.
Components of Spent Reactor Fuel
Component
Fission
FragmentsUranium
Long-Lived
Component
Per Cent of Total 4 95 1
Radioactivity Intense Negligible Medium
Untreated required
isolation time (years) 200 0 300,000
Yucca Mountain Repository Layout
Internationalize the Fuel Cycle
Supplier States: Enrich Uranium
Take back spent fuel
Reprocess to separate Actinides
Burn Actinides in “Fast Spectrum”
reactors
User States: Pay for reactors
Pay for enriched fuel
Pay for treatment of spent fuel (?)
Conclusion
Global Warming is real and human activity is the driver.
Not clear how bad it will be with no action, but I have told my kids to move to Canada.
We can do something to limit the effects.
The sooner we start the easier it will be.
Conclusion
Best incentives for action are those that allow industry to make more money by doing the right thing.
Carrots and sticks in combination are required.
The economy as a whole will benefit, but some powerful interests will not.
It is not hard to know what to do, but very hard to get it done.
The Most Difficult World Problem
What should be the criteria for action?
Total emissions?
Per capita emissions?
Greenhouse gas per unit GDP?
The poorest countries contribute negligibly – Leave them out.
The rapidly developing countries have to be brought in somehow.
The rich countries have to lead the action agenda.
IEA World Statistics 2005
64
1300
270
6400
Population(Millions)
1.4
2.1
11
36
GDP1
($Trillions)
1.4
8.1
11
55
GDP (PPP)2
($Trillions)
France
China
U.S.
World
0.236.2
0.633.9
0.5319.6
0.504.2
CO2/GDP3
(Kg/$)
CO2per Capita(Tonnes)
(Source: IEA “Key World Energy Statistics 2007”)
1. Nominal exchange rate in constant 2000 dollars.2. Purchasing Power Parity in constant 2000 dollars.3. GDP in PPP terms.
BACK-UP SLIDES
Quantitative Greenhouse Effect
Source: "Life-Cycle Assessment of Electricity Generation Systems and Applications for Climate Change Policy Analysis," Paul J. Meier, University of Wisconsin-Madison, August, 2002.
Comparison of Life-Cycle Emissions
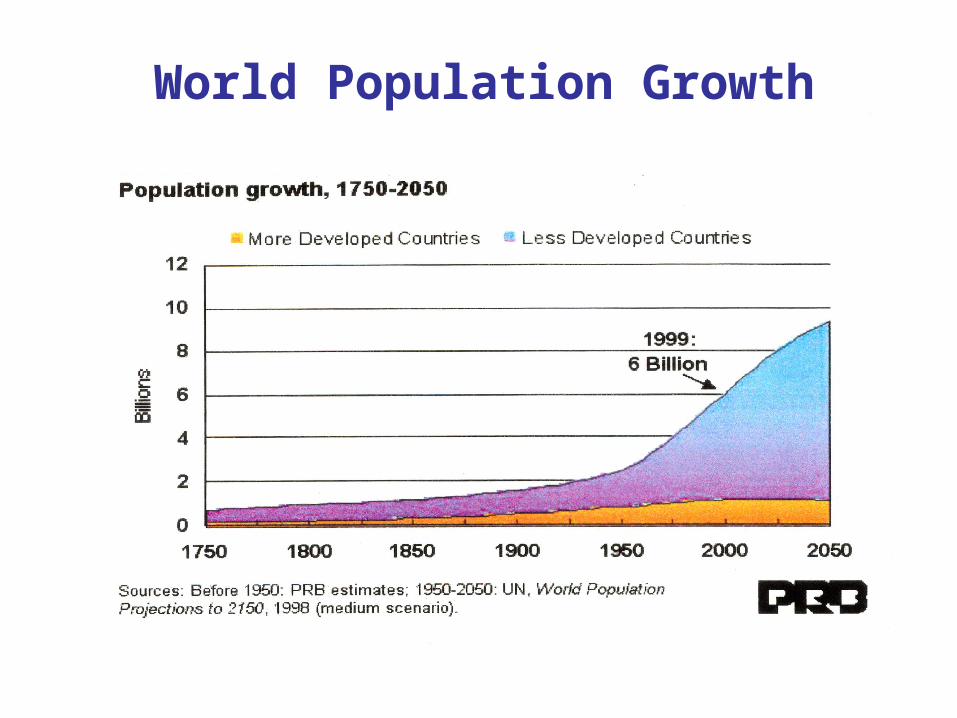
World Population GrowthFigure 7. World Population Growth.
Final Energy by Sector(IIASA Scenario B)
2000 2050 2100
Residential and Commercial
38% 31% 26%
Industry 37% 42% 51%
Transportation 25% 27% 23%
Total (TW-yr) 9.8 19.0 27.4
Energy Intensity(Watt-year per dollar)
(IIASA Scenario B)
Watt-year per dollar 2000
2050 2100
Industrialized 0.30 0.18 0.11
Reforming 2.26 0.78 0.29
Developing 1.08 0.59 0.30
World 0.52 0.36 0.23
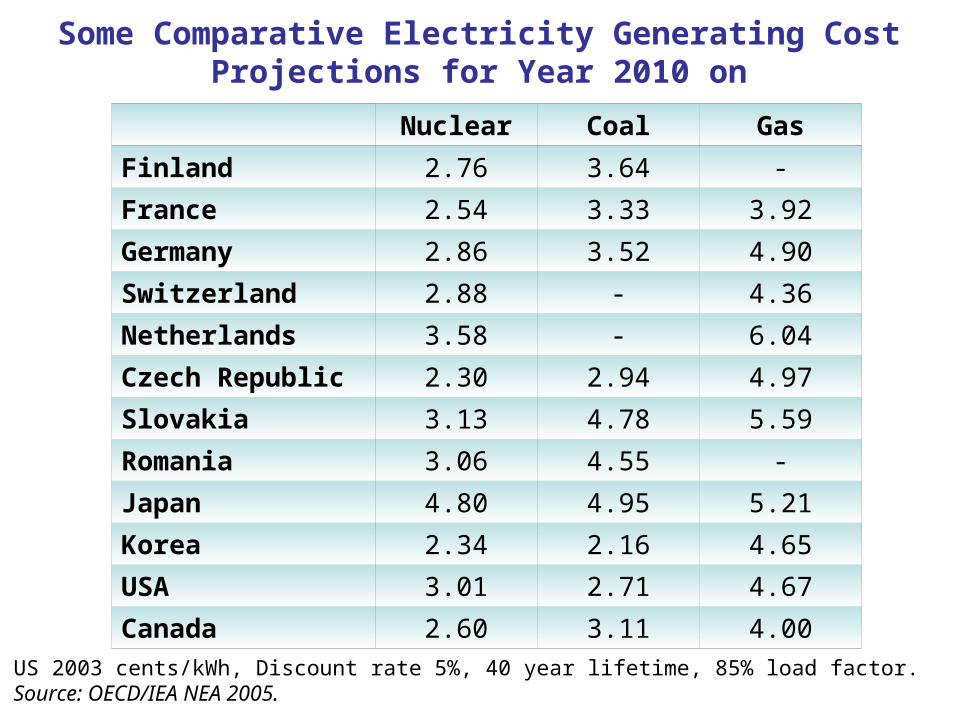
Some Comparative Electricity Generating Cost Projections for Year 2010 on
Nuclear Coal Gas
Finland 2.76 3.64 -
France 2.54 3.33 3.92
Germany 2.86 3.52 4.90
Switzerland 2.88 - 4.36
Netherlands 3.58 - 6.04
Czech Republic 2.30 2.94 4.97
Slovakia 3.13 4.78 5.59
Romania 3.06 4.55 -
Japan 4.80 4.95 5.21
Korea 2.34 2.16 4.65
USA 3.01 2.71 4.67
Canada 2.60 3.11 4.00
US 2003 cents/kWh, Discount rate 5%, 40 year lifetime, 85% load factor.Source: OECD/IEA NEA 2005.
Public Health Impacts per TWh* Coal Lignite Oil Gas Nuclear PV Wind