95
1 Project Profitability Assessment
| Date post: | 25-Dec-2015 |
| Category: |
Documents |
| Upload: | edmund-clarke |
| View: | 213 times |
| Download: | 2 times |

1
Project Profitability Assessment

2
Contents Capital budgeting (of
“environmental” projects) Project cash flows and simple
payback The Time Value of Money (TVM) and
Net Present Value (NPV) Two small group exercises Capital budgeting with inflation and
tax Sensitivity analysis Key profitability indicators

3
Capital Budgeting(of “Environmental”
Projects)[15 min]

4
Capital budgeting
The process by which an organization: Decides which investment projects are
needed & possible, with a special focus on projects that require significant up-front investment (i.e., capital)
Decides how to allocate available capital between different projects
Decides if additional capital is needed
5
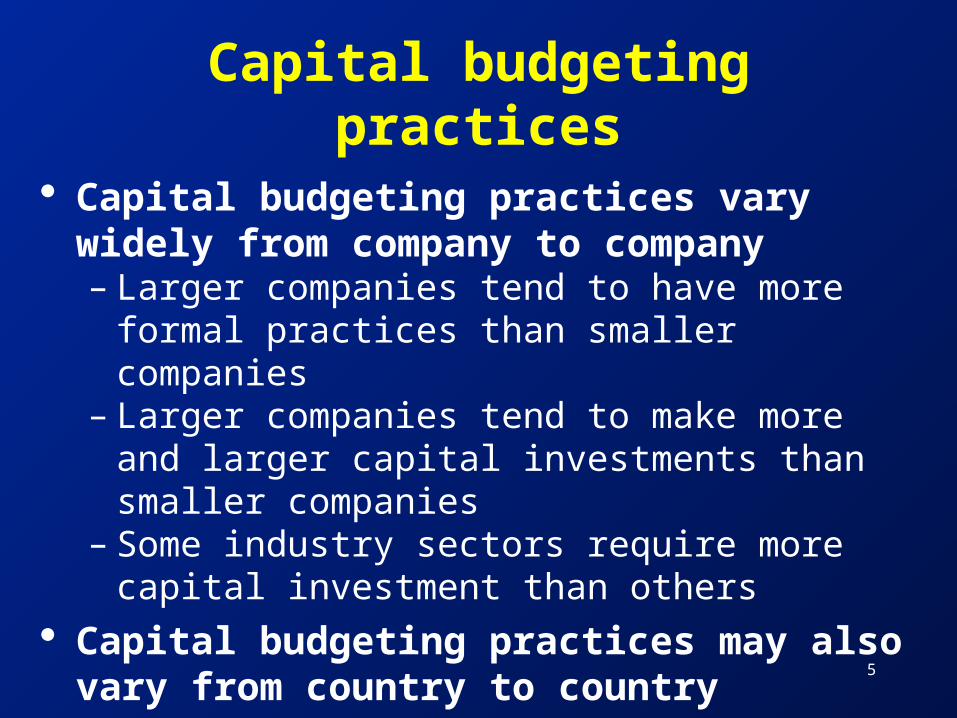
Capital budgeting practices
Capital budgeting practices vary widely from company to company – Larger companies tend to have more
formal practices than smaller companies– Larger companies tend to make more and
larger capital investments than smaller companies
– Some industry sectors require more capital investment than others
Capital budgeting practices may also vary from country to country

6
Typical project types & goals (1)
Maintenance– Maintain existing equipment and operations
Improvement– Modify existing equipment, processes, and
management and information systems to improve efficiency, reduce costs, increase capacity, improve product quality, etc.
Replacement– Replace outdated, worn-out, or damaged
equipment or outdated/inefficient management and information systems

7
Typical project types & goals (2)
Expansion– e.g., obtain and install new process
lines, initiate new product lines Safety
– make worker safety improvements Environmental
– e.g., reduce use of toxic materials, increase recycling, reduce waste generation, install waste treatment
Others...
8
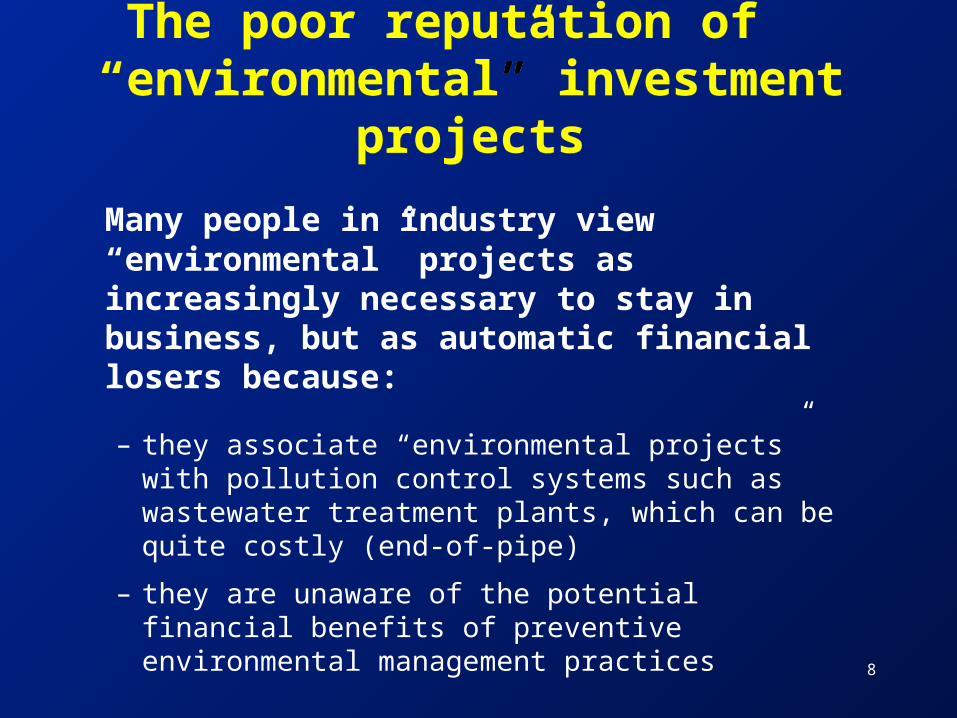
The poor reputation of “environmental” investment
projects
The poor reputation of “environmental” investment
projects
Many people in industry view “environmental” projects as increasingly necessary to stay in business, but as automatic financial losers because:
– they associate “environmental projects” with pollution control systems such as wastewater treatment plants, which can be quite costly (end-of-pipe)
– they are unaware of the potential financial benefits of preventive environmental management practices

9
We know better!We know better!
We have learned that some environmental projects, i.e., Cleaner Production (CP) projects, can go hand in hand with:– Production efficiency improvements– Product quality improvements– Production expansion
So, do not place your project idea into a single narrow category — think broadly about all the possible benefits

10
Decision-making factors
Project selection
Technical
Organizational
FinancialRegulatory
Today’s focus

11
Project Cash Flowsand
Simple Payback
[15 min]

The Cash Flow Concept
The Cash Flow Concept is a common management planning tool.
It distinguishes between:
(a) costs -> cash outflows (b) revenues/savings -> cash inflows
12

13
Cash Flow Analysis
• Relies on every day life principles
• Measures the difference between
– What we received, and
– What we paid out
• Only cash receipts and cash payments are included in the analysis
• Applicable also to forecast cash available

Types of Cash Flows
One-time
Annual
Other
Inflow
Equipment salvage
value
Operating revenues & savings
Working capital
Outflow
Initial investment
cost
Operating costs &
taxes
Working capital
14

15
Cash Outflow Analysis (1)
• Planning/
Engineering
• Permitting
• Site Preparation
• Purchased
Equipment
• Working Capital
• Utility Systems &
Connections
• Start-up/Training
• Contingency
• (Salvage Value)
INITIAL INVESTMENT

Working Capital
Working Capital is: “the total value of goods and money necessary to maintain project operations”
It includes items such as:– Raw materials inventory– Product inventory– Accounts payable/receivable– Cash-on-hand
16

Salvage Value
Salvage Value is the resale value of equipment or other materials at the end of the project
17

18
•Direct costs
•Input costs
•Other costs
•Loan repayments
•Interest on loan application
Cash Outflow Analysis (2)

19
•Sales
•Savings
•Salvage value
•Cash shortfall / surplus
Cash Inflow Analysis

20
Cash Flow Forecast/Projection (1)
•We are looking at the likely future cash position.
•We examine the possible effects of changes in the cash flow components .
21
Cash Flow Forecast/Projection (2)
Make assumptions about likely outcomes regarding:– Inflation– Market size – Demand for goods and services– Interest Rates

22
I nvestment Year 0 1 2 3
I NI TI AL I NVESTMENTTotal I nvestment Costs
OPERATI NG COSTSTotal Operating Costs
OPERATI NG AND MAI NTENANCETotal Operating and Maintenance Costs
WASTE MANAGEMENTTotal Waste Management Costs
COMPLI ANCE AND REG. (LessTangibles)
Total Compliance Costs
REVENUES AND SAVI NGSREVENUESOperating CostsLess DepreciationTaxable I ncomeTax payableNet I ncome af ter Depreciation and Tax
Cashflow Projection Worksheet

23
Operating Inputs
• Materials
• Energy
• Labour
• Floor Space
• Taxes
• Depreciation
• Cost of capital
Waste Management includes waste handling, recycling, treatment, disposal, and regulatory compliance
• Materials
• Energy
• Labour
• Floor space
• Fees
• Taxes & Depreciation
• Cost of Capital
Less Tangibles• Productivity• Future regulation• Potential liability• Insurance• Company image
Revenues• Product sales• By-product sales • Pollution credits
Annual Operating Costs & Savings
(see also Cleaner Production Investment Decision: Costs and Savings checklist)

Timing of Cash Flows
Workingcapital
Annual Operating CostsAnnual Tax Payments
Annual Financing Payments
Salvage Value
End of project:
Time zero:
Initial InvestmentWorking Capital
TIMEYear 1 Year 2 Year 3
Annual Revenues/Savings
24

Cash Flow Analysis structure
There are two basic ways to structure a project financial analysis:
1) Stand-alone analysis Considers only the cash flows of the proposed project
2) Incremental analysisCompares the cash flows of the proposed project to the “business as usual” cash flows
25

Incremental analysis for CP
For many CP projects, you will need to do an incremental analysis — compare the CP cash flows to the “business as usual” cash flows
You only need to estimate the cash flows that change when you improve the “business as usual” operations
26
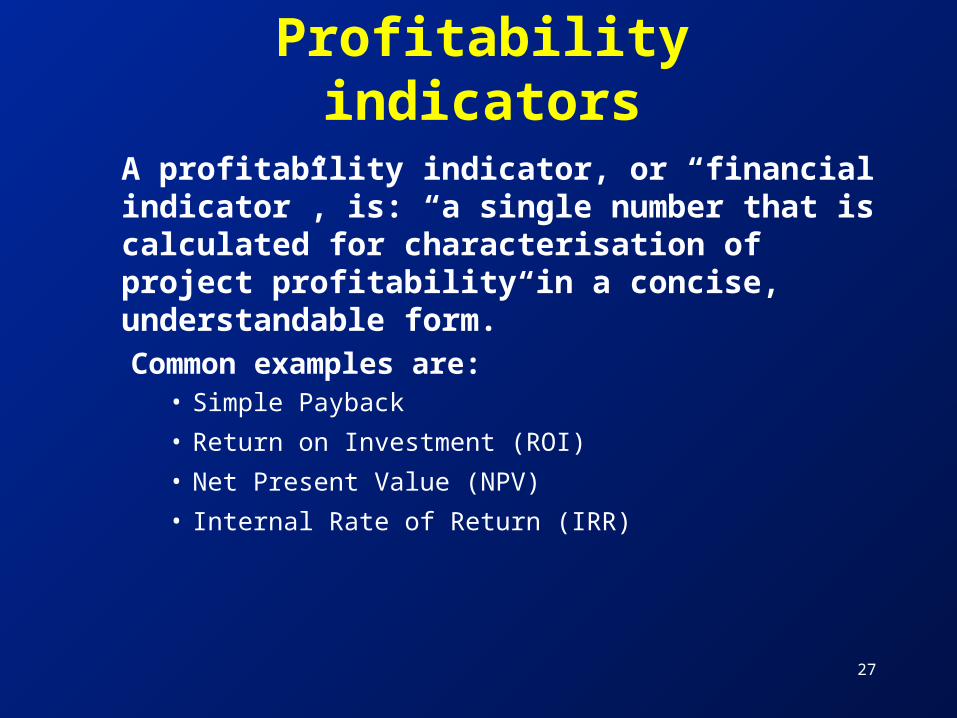
Profitability indicatorsA profitability indicator, or “financial indicator”, is: “a single number that is calculated for characterisation of project profitability in a concise, understandable form.”Common examples are:
• Simple Payback
• Return on Investment (ROI)
• Net Present Value (NPV)
• Internal Rate of Return (IRR)
27

Simple payback
This indicator incorporates:– the initial investment cost – the first year cash flow from the
project
Simple Payback (in years)
Initial Investment
Year 1 Cash Flow=
28

How to interpretsimple payback
The simple payback calculated for a project is usually compared to a company rule of thumb called a “hurdle” rate:
e.g., if the payback period is less than 3 years, then the project is viewed as profitable
29

30
Small Group Exercise:Profitability Assessment
at the PLS Company— Part I
“Cash Flows & Simple Payback”
[30 min]

31
The PLS company’sQC camera project
PLS decided to purchase and install a camera system to monitor quality control (QC) of the print jobs as they actually occur
Allows the operators to detect print errors earlier and halt the operations before too much solid scrap is generated
Has reduced generation of full-run solid scrap by about 40%

Costs and savingsincluded in the QC camera
analysis Initial investment costs
– purchase of the camera system, delivery, installation, start-up
Annual operating costs (and savings)– Operating input — materials (plastic film,
ink), energy, labour– Incineration — fuel, fuel additive, labour,
ash to landfill– Wastewater treatment — chemicals,
electricity, labour, sludge to landfill
32

QC camera projectCash flows
Annual Tax Payments = 0 (PLS has tax holiday)Financing Payments = 0 (PLS paid cash)
Initial Investment = $105,000Working Capital = 0 (not important for this project)
TIMEYear 1 Year 2 Year 3
Annual savings = ???
Time zero:
33

The PLS company’sQC camera project
Initial Investment
Cost
Annual Operating
Costs
BusinessAs
Usual Annual Savings =
???The QC Camera Project
0
US $ 105,000
???
???
34

35
Exercise instructionsPart I
Introduction (5 min.), detailed in your handout
Question 1 (15 min.) Question 2 (5 min.) Discuss your answers with
the other small groups and the instructor (5 min.)

36
The Time Value of Moneyand
Net Present Value (NPV)
[30 min]

37
Question:
If we were giving away money, would you rather
have:(A) $10,000 today, or(B) $10,000 3 years
from now
Explain your answer...
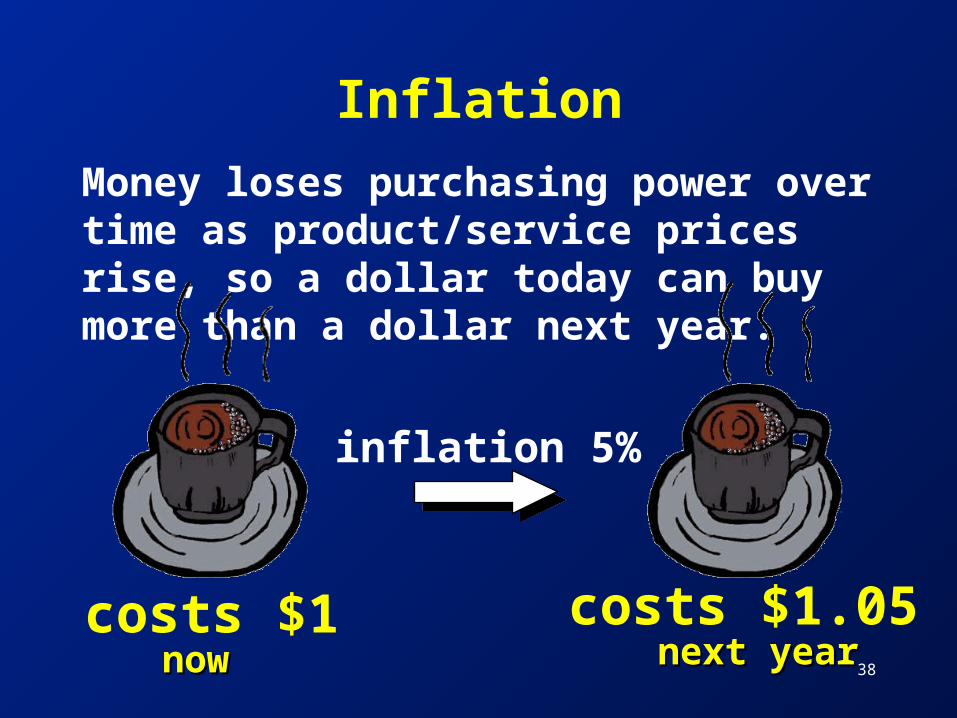
Inflation
Money loses purchasing power over time as product/service prices rise, so a dollar today can buy more than a dollar next year.
costs $1 costs $1.05
inflation 5%
nownow next yearnext year38

Investment opportunity
A dollar that you invest today will bring you more than a dollar next year — having the dollar now provides you with an investment opportunity
Interest, or “return on investment”
Investing $1 now
InvestmentGives you
$1.10 a year from now
39

40
Time Value of Money (TVM)
Money now is worth more than money in the future because of:a) inflationb) investment opportunity
The exact “time value” of your money depends on the magnitude of the:a) rate of inflation andb) rate of return on investment

41
TVM and project profitability
When you invest in a capital project, you have:(1) An initial investment happening NOW(2) A series of future cash inflows, over time,
that pay back the initial investment
So, it is important to take the Time Value of Money (TVM) into account when you are estimating project profitability

The PLS company’sQC camera project
Initial Investment
Cost
Annual Operating
Costs
BusinessAs
Usual Annual Savings =
US$38,463The QC Camera Project
0
$ 105,000
$ 2,933,204
$ 2,894,741
(in US$)42

43
Question:
Is the annual savings of$38,463 per year for 3 years
a sufficient returnon the initial investment of
$ 105,000?

44
You might think about adding up the annual savings over the 3 years:
Savings per year $38,463x 3 years
Total savings $115,389
But: this ignores the Time Value of Money (the fact that $38,463 in year 1 is not the same as $38,463 in year 2 or year 3)
Answer?

Comparing cash flowsfrom different years
Before you can compare cash flows from different years, you need to convert them all to their equivalent values in a single year
It is easiest to convert all project cash flows to their “present value” now, at the very beginning of the project
45

Converting the PLS cash flowsto their “present value”
End of project
Time zero:
Initial Investment = $105,000
TIMEYear 1 Year 2 Year 3
$38,463 $38,463 $38,463
= ??= ??= ??
Annual Savings
46
Converting cash flowsto their present value
You can convert future year cash flows to their present value using a “discount rate” that incorporates:– Desired return on investment– Inflation
The discount rate calculation is simple — mathematically, it is the reverse of an interest rate calculation
47

48
Invested at an interest rate of 20%, how much will $10,000 now be worth after 3 years?
Afteryear
1 $10,000 x 1.20 = $12,000
2 $10,000 x 1.20 x 1.20 = $14,400
3 $10,000 x 1.20 x 1.20 x 1.20 = $17,280
Note: these calculations are on a compound basis
Interest rate calculation

49
The discounting calculation is essentially the opposite of the interest rate calculation.
If you want to have $17,280 in 3 years, how much would you have to invest now?
$17,280 = $10,000
1.20 x 1.20 x 1.20 needed now
In other words, $17,280 in year 3 has a present value of $10,000
Discounting calculation

50
Which discount rate? (1)
The discount rate a company chooses should be equal to the required rate of return for the project investment
The required rate of return will usually incorporate three distinct elements:– A basic return - pure compensation for
deferring consumption– Any ‘risk premium’ for that project’s risk– Any expected fall in the value of money over
time through inflation

51
Which discount rate? (2)
At a minimum, the chosen discount rate should cover the costs of raising the investment financing from investors or lenders (i.e. the company’s “cost of capital”)
Often, rather than trying to identify the exact source of capital (and its associated cost) for each individual project, a firm will develop a single “Weighted Average Cost of Capital” (WACC) that characterises the sources and cost of capital to the company as a whole.

Discounting (1)
Present Value = Future Valuen
(1 + d)n
The value of the cash flow in year n
The value of the cash flow at
“Time Zero,” i.e., at project start-up
d = the discount rate
n = the number of years after
project start-up
52

Discounting (2)
Present Value = Future Valuen x (PV Factor)
The value of the cash flow in year n
The value of the cash flow at
“Time Zero,” i.e., at project start-up
Present Value (PV) Factors have been calculated for various
values of d (discount rate) and n (number of years) and have been
tabulated for easy use.
(Also called discount factors)53

54
PresentValue factors Value of $1 in the future, NOW
Discount rate (d): 10% 20% 30% 40%
Years into future (n)
1 .9091 .8333 .7692 .7142
2 .8264 .6944 .5917 .5102
3 .7513 .5787 .4552 .3644
4 .6830 .4823 .3501 .2603
5 .6209 .4019 .2693 .1859
10 .3855 .1615 .0725 .0346
20 .1486 .0261 .0053 .0012
30 .0573 .0042 .0004 .0000

55
Net Present Value (NPV)
Net Present Value (NPV) = the sum of the present values of all of a project’s cash flows, both negative (cash outflows) and positive (cash inflows)
NPV characterises the present value of the project to the company
If NPV > 0, the project is profitable
If NPV < 0, the project is not

EstimatingNet Present Value
Expected Future Cash
Flows
- $105,000
+ $38,463
+ $38,463
+ $38,463
PVFactor
Present Value of Cash Flows (at time zero)
- $???
$???
$???
$???
$???
Year
0
1
2
3
* =
???
???
???
???
Sum = the project’s Net Present Value = 56

57
Time for lunch! [60 min]
Time for lunch! [60 min]

58
Small Group Exercise:Profitability Assessment
at the PLS Company— Part II
“Net Present Value”
[45 min]
59
Also — you will need the handout:
“Performing Net Present Value (NPV) Calculations”
Also — you will need the handout:
“Performing Net Present Value (NPV) Calculations”
Located in your handout

Converting the PLS cash flowsto their “present value”
End of project
Time zero:
Initial Investment = $105,000
TIMEYear 1 Year 2 Year 3
$38,463 $38,463 $38,463
= ??= ??= ??
60

61
Exercise instructionsPart II
Introduction (5 min.), detailed in your handout
Question 3 (15 min.) Question 4 (5 min.) Discuss your answers with
the other small groups and the instructor (15 min.)
Lessons learned (5 min.)

62
Capital Budgeting: inflation & tax
[30 min]

63
Discounting and inflation (1)
even without inflation, money has a time value due to supply/demand for money
inflation increases both:- future cash flows
- interest rates (and discount rates)
these offset each other

64
Discounting and inflation (2)
With 10% inflation (say), future cash flows will by 10% each year
Investors & lenders will also require a higher rate to compensate for their loss in purchasing power
If 15% was acceptable with no inflation, with 10% inflation they will now require
115% x 110% = 126.5%

65
Discounting and inflation (3)
PLS Company, now assuming 10% inflation and 26.5% discount rate:
Year Cash flow PV factor PV ($) @ 26.5% ($)
1 42,309 0.791 33,466 2 46,540 0.625 29,088 3 51,194 0.494 25,289
87,843less: initial investment 105,000
Net Present Value -17,157
i.e. same NPV* as with zero inflation, 15% discount rate
* ignoring minor rounding difference
66
What is the current rate of inflation in the economy?
What return on their capital will the lender really earn on their money, after allowing for the erosion of their capital over time through inflation?

Tax payments
Taxes can be an important project cash flow
Depending on a facility’s location, a firm may have to pay national and/or local income taxes on the revenues or savings generated by a project
Other types of taxes may also be relevant - sales taxes, pollution taxes, etc.
67
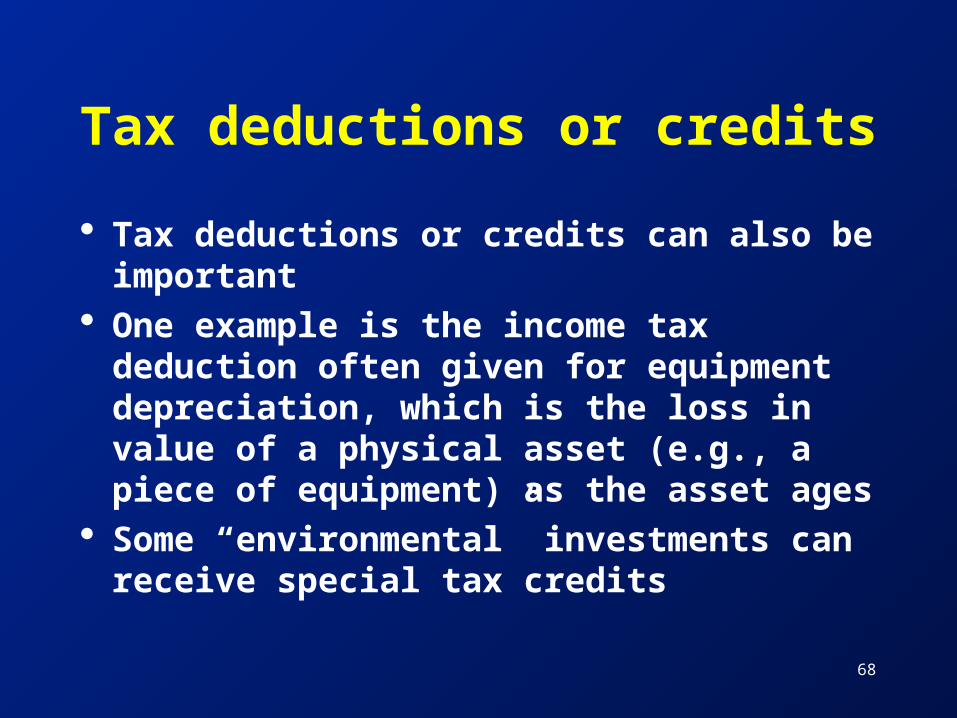
Tax deductions or credits
Tax deductions or credits can also be important
One example is the income tax deduction often given for equipment depreciation, which is the loss in value of a physical asset (e.g., a piece of equipment) as the asset ages
Some “environmental” investments can receive special tax credits
68

69
Tax and project appraisal
assume 30% rate of taxes of firms’ profits
tax is based on accounting profits, not on cashflows
accounting profits are after deducting depreciation
tax is payable 1 year after the profits have been realised

70
Depreciation
A project needs $12,000 for a new machine which will last 3 years
assume the machine has no residual value after 3 years
depreciation per year: initial cost = $12,000 = $4,000 per
yearasset life 3 years

71
Profit earned by project
Profit earned by project in each year:
cash inflow per year $6,000less: depreciation $4,000
contribution to profit $2,000
tax @ 30% $600
72
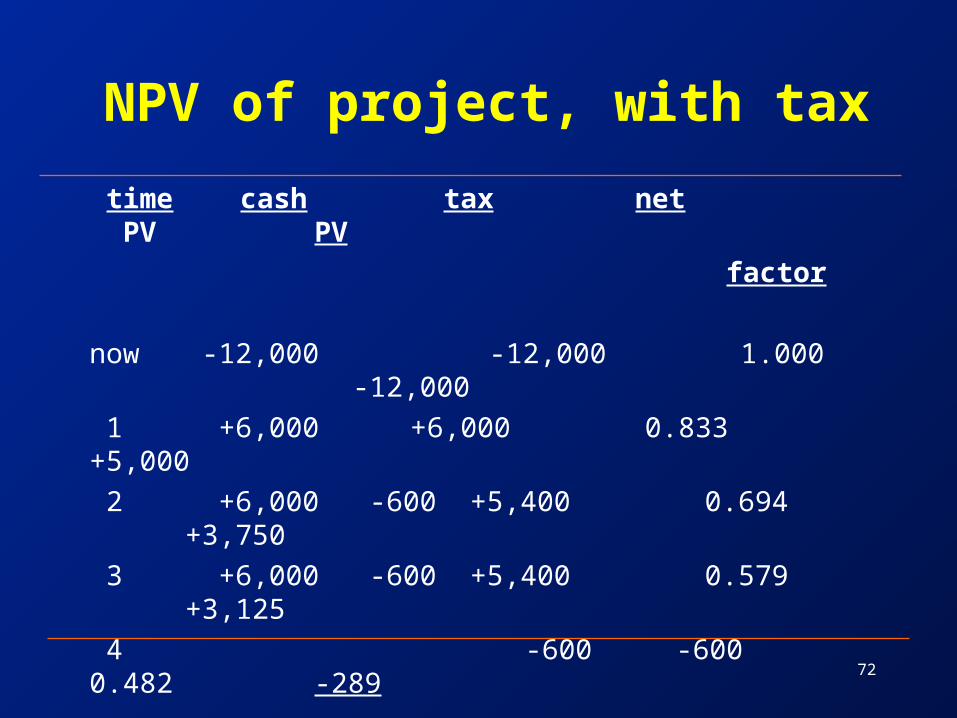
NPV of project, with tax
time cash tax net PV PV factor
now -12,000 -12,000 1.000 -12,000 1 +6,000 +6,000 0.833 +5,000 2 +6,000 -600 +5,400 0.694+3,750 3 +6,000 -600 +5,400 0.579+3,125 4 -600 -600 0.482 -289
Net Present Value - $414
73
Project appraisal with inflation and tax
depreciation (and accounting profits) are based on the asset’s original cost
the asset’s original cost does not increase with inflation over the life of the project
project analysis is then easier using nominal (not real) cashflows and discount rates

74
Some good reasons to use a longer analysis
time horizon
Some good reasons to use a longer analysis
time horizon
Some out-year costs may be missed if the time horizon is too short, e.g., a required wastewater treatment plant upgrade in the future
Some annual operating costs may change significantly over time, e.g., disposal fees at landfills
Short time horizons neglect the impact of the time value of money, especially in times of significant inflation, deflation, changing cost of capital, etc.

75
Profitability assessment tips
Be sure to:– Include all relevant and significant
costs/savings in the profitability analysis
– Think long-term (or at least medium-term!)
– Incorporate the time value of money– Use multiple profitability indicators– Perform sensitivity analyses for data
estimates that are uncertain

76
Time for a break! [15 min]
Time for a break! [15 min]

77
Sensitivity Analysis
[15 min]

78
Sensitivity AnalysisIntroduction
An important management tool questioning potential project benefit risks.
Assumptions surrounding a project are computed to produce a base NPV and IRR.
From the base case, changes in the original assumptions are made to gauge their effect on the NPV and IRR.
Input variables varied adversely by 10%

79
Sensitivity Analysis Example
Input Variables Varied by 10%
OriginalData
10% increasein Cost of
Capital
10% increasein I nvestment
cost
10% decreasein cashflows
Year 0 - 2735000 - 11323650 - 12456015 - 2735000Year 1 - 14978753 12951647 - 14978753 - 14828965Year 2 17122990 2592375 17122990 16951760Year 3 8022274 5151626 8022274 7942051Year 4 376354 117364 376354 372590.5Year 5 8203865 374538 8203865 8121826Year 6 76133 5142598 76133 75371.67DiscountRate
35% 48,5% 35% 35%
Project Life 5 years 5 years 5 years 5 yearsNPV 7810 - $2,741,092 - $8,940,009 $745,846I RR 39% 54% 9% 39%

80
Sensitivity Analysis
Summary
Sensitivity Analysis permits project proposals to be evaluated simply.
The model can evaluate sensitive variables without having to input any additional data.

81
Sensitivity AnalysisConclusion
•By amending the original data, a variable whose change generates a negative NPV and /or an IRR lower than the firm’s cost of capital, is deemed to be sensitive.
•An investigation would need to be undertaken for a contingent plan. If results of the investigation are unfavourable, the project is unacceptable on economic grounds.
However, development projects with social aspects may be treated differently.

82
KeyProfitability Indicators
[15 min]

Profitability indicators
We have seen so far:• Simple Payback
• Net Present Value (NPV)
But there are others, common examples are:
• Return on Investment (ROI)
• Internal Rate of Return (IRR)
83

Simple Payback andReturn on Investment
(ROI)
These indicators incorporate:– the initial investment cost – the first year cash flow
Simple Payback (in years)
Initial Investment
Year 1 Cash Flow=
ROI (in %)Year 1 Cash Flow
Initial Investment=
84

How to interpretSimple Payback and ROI
The simple payback or ROI calculated for a project are usually compared to a company rule of thumb called a “hurdle” rate:– e.g., if the project payback period is
less than 3 years, then the project is viewed as profitable
– e.g., if the ROI is 33%, then the project is viewed as profitable
85

Net Present Value (NPV)
NPV is a more reliable profitability indicator than Simple Payback or ROI as it considers both the time value of money and all future year cash flows
NPV = the sum of the discounted cash flows over the lifetime of the project, using the company’s cost of capital as the discount rate
86

Internal Rate of Return (IRR)
IRR is similar to NPV in that it considers both the time value of money and all future year cash flows
IRR = the discount rate for which NPV = 0, over the project lifetime (calculated in an iterative fashion)
It tells you exactly what “discount rate” makes the project just barely profitable
87
88
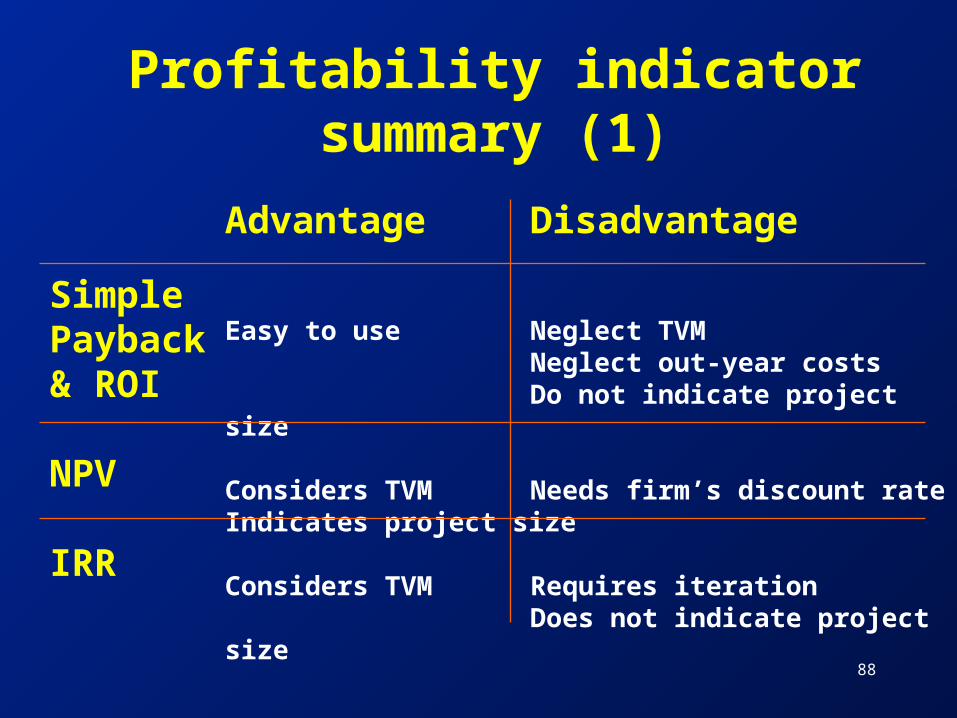
Profitability indicator summary (1)
Profitability indicator summary (1)
Advantage Disadvantage
Easy to use Neglect TVMNeglect out-year costsDo not indicate project size
Considers TVM Needs firm’s discount rateIndicates project size
Considers TVM Requires iterationDoes not indicate project size
SimplePayback& ROI
NPV
IRR
Profitability indicator summary (2)
NPV is generally the most valuable, problem-free indicator
Other indicators that consider the time value of money (e.g., IRR) are also useful
Payback and ROI are easy to understand and use, but of limited accuracy
However, Simple Payback is particularly useful with uncertain or risky investment climates
89

90
Interpret profitability indicators with
caution...
Interpret profitability indicators with
caution... We have seen that Simple Payback
has some limitations as a project profitability indicator
Be aware of the advantages and limitations of the indicators you use
The best approach is to use several indicators to give a balanced view of project profitability

91
Other Profitability Assessment Issues
[15 min]
92
Other issues
There are other issues that impact a project’s profitability, which we do not have time to address today– Source and cost of project financing– Can you think of others?

Project financing
Different sources of project financing may have differing impacts on project profitability
Be sure to take financing payments such as lease payments or payments on loan principal and interest into account appropriately when estimating profitability
93

94
Project Profitability Assessment
Summary and Q&A[15 min]

95
Project profitability assessment
Capital budgeting (of “environmental” projects)
Project cash flows and simple payback
The Time Value of Money and Net Present Value (NPV)
Two small group exercises Capital budgeting : inflation and tax Sensitivity analysis Key profitability indicators


