47
1 Prospective Payment System (PPS) Program Review and Evaluation Health Budgets and Financial Policy OASD(Health Affairs) Data Quality Data Quality Feb 2009 Feb 2009
| Date post: | 13-Dec-2015 |
| Category: |
Documents |
| Upload: | lucas-matthews |
| View: | 216 times |
| Download: | 1 times |
1
Prospective Payment System (PPS)
Program Review and EvaluationHealth Budgets and Financial Policy
OASD(Health Affairs)
Data QualityData Quality Feb 2009Feb 2009

2
Resourcing the Direct Care System for Value
The Direct Care System (DCS) is the heart of military medicine and provides:
– a ready to deploy medical capability– a medically ready force– delivery of the health benefit to warriors and their families
..but at the appropriate value?
Outputs (Activities) + Outcomes (Readiness, Population Health) + Customer satisfaction
Resources (MilPers, appropriations, reimbursements)
3
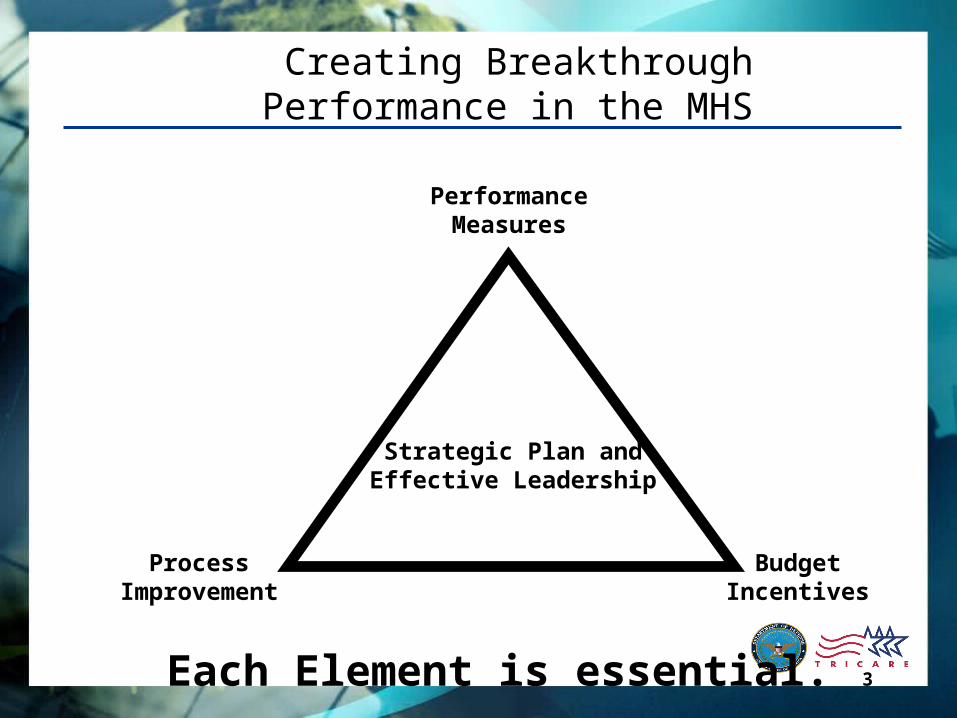
Creating Breakthrough Performance in the MHS
PerformanceMeasures
ProcessImprovement
BudgetIncentives
Strategic Plan and Effective Leadership
Each Element is essential.
4
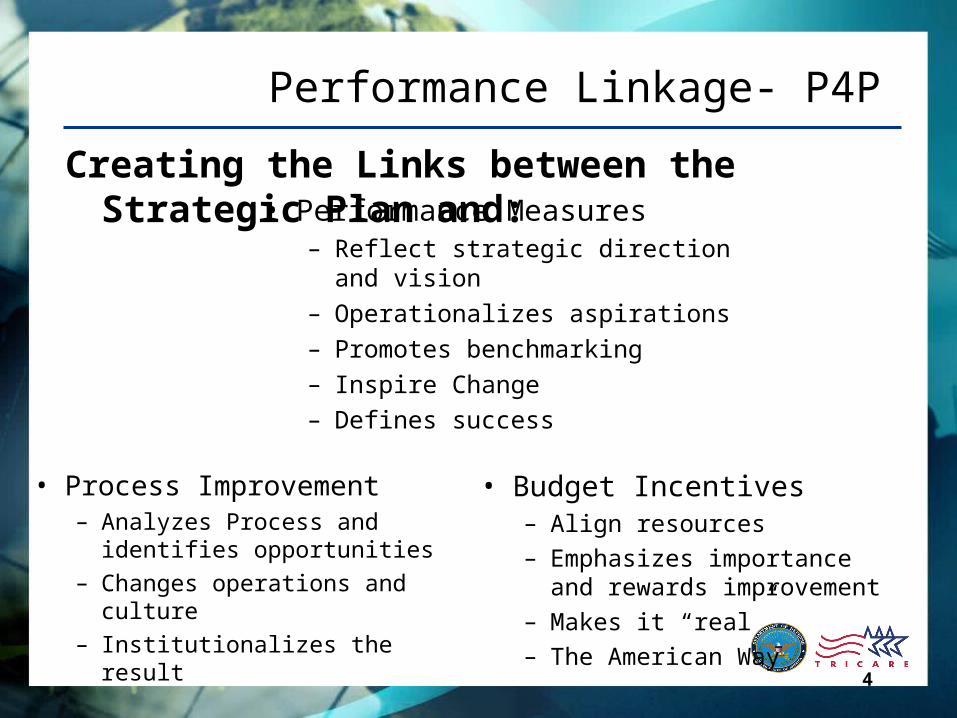
Performance Linkage- P4P
Creating the Links between the Strategic Plan and:• Performance Measures
– Reflect strategic direction and vision
– Operationalizes aspirations
– Promotes benchmarking
– Inspire Change– Defines success
• Budget Incentives– Align resources– Emphasizes importance
and rewards improvement– Makes it “real”– The American Way
• Process Improvement– Analyzes Process and
identifies opportunities– Changes operations and
culture– Institutionalizes the result
6
Agenda
• Current PPS Production and Valuation
• Expansion of PPS workload reporting
• Valuing Quality
• Future Enhancement of PPS– MENBA– Additional Reporting
• Issues for Consideration in Data Quality

7
Current PPS Workload
• Inpatient – MEPRS A Workcenters– Non-Mental Health - Relative Weighted Products
(RWPs)– Mental Health - Bed Days
• Outpatient – MEPRS B Workcenters– Simple (Work) Relative Value Units (RVUs)– Excluding Generic Providers
• A generic provider is outpatient workload where provider specialty is coded as the clinic rather than the specialty, e.g. Cardiology Clinic vs. Cardiologist.
• Issue raised two years ago – Declined from over 10% to less than 1%
8
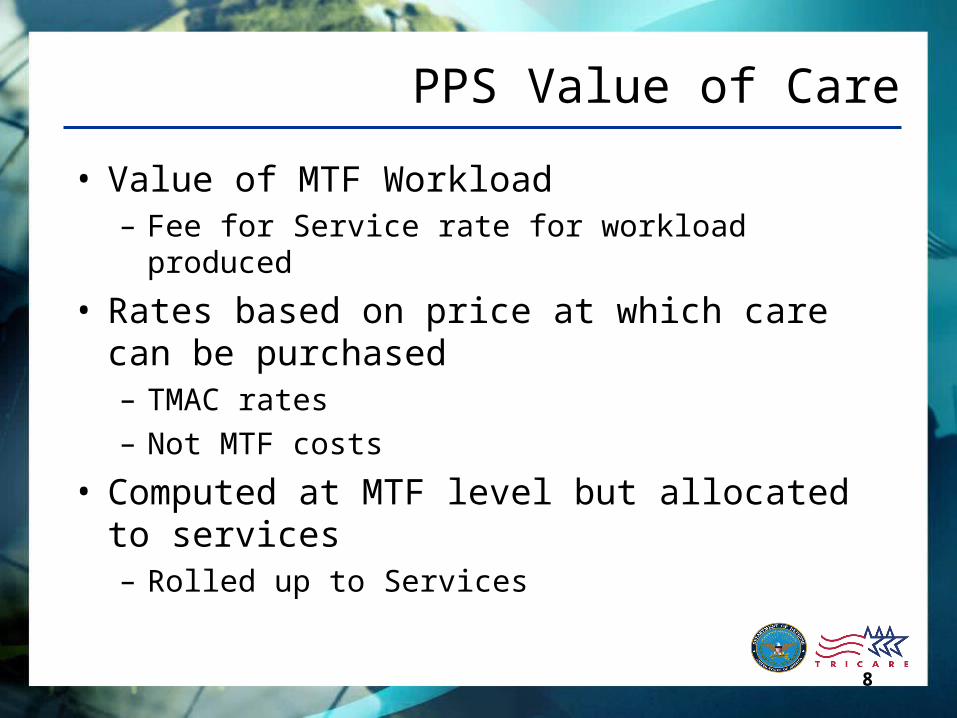
PPS Value of Care
• Value of MTF Workload– Fee for Service rate for workload produced
• Rates based on price at which care can be purchased– TMAC rates– Not MTF costs
• Computed at MTF level but allocated to services– Rolled up to Services

9
TMAC versus PPSCivilian• Inpatient
– Institutional• Hospital (DRG)
– Including ancillaries, pharmacy
– Professional (RVU)• Surgeon• Anesthesiologist• Rounds• Consultants
• Outpatient– Professional (RVU)– Institutional (APC)
• Outpatient Ancillary (RVU)
Direct Care PPS• Inpatient (RWP, i.e. DRG)
– All Institutional and Professional
• Hospital– Including ancillaries,
pharmacy• Surgeon• Anesthesiologist• Internist• Consultants
• Outpatient (RVU)– Professional– No institutional (Pass Thru)
• Except Emergency Room
• Outpatient Ancillary (Pass Thru)– None
10
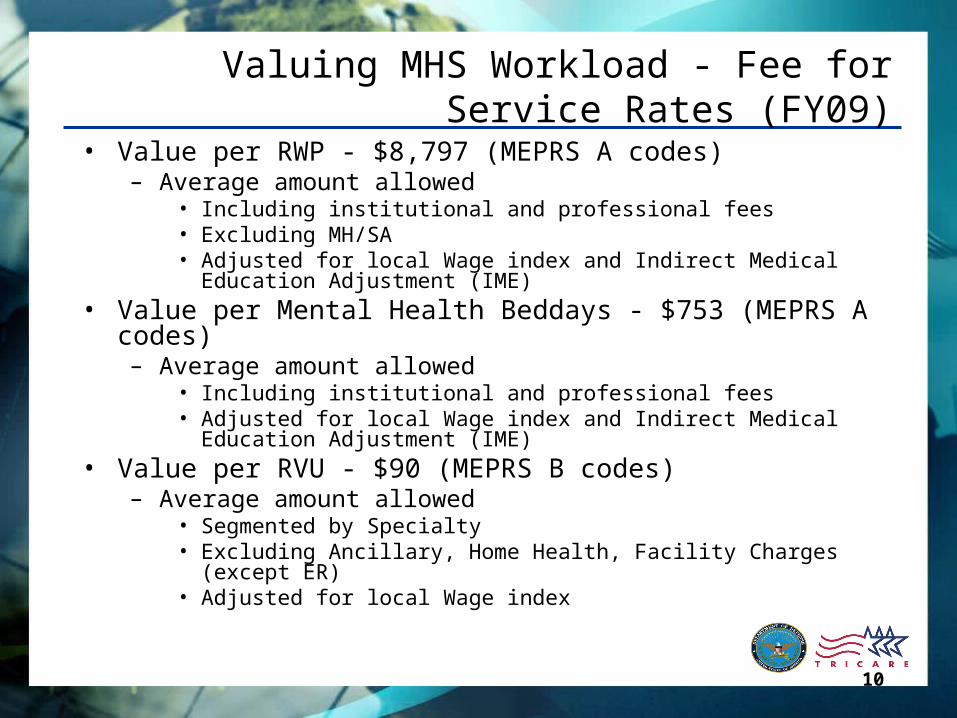
Valuing MHS Workload - Fee for Service Rates (FY09)
• Value per RWP - $8,797 (MEPRS A codes)– Average amount allowed
• Including institutional and professional fees• Excluding MH/SA • Adjusted for local Wage index and Indirect Medical Education Adjustment
(IME)• Value per Mental Health Beddays - $753 (MEPRS A codes)
– Average amount allowed• Including institutional and professional fees• Adjusted for local Wage index and Indirect Medical Education Adjustment
(IME)• Value per RVU - $90 (MEPRS B codes)
– Average amount allowed• Segmented by Specialty • Excluding Ancillary, Home Health, Facility Charges (except ER)• Adjusted for local Wage index
11
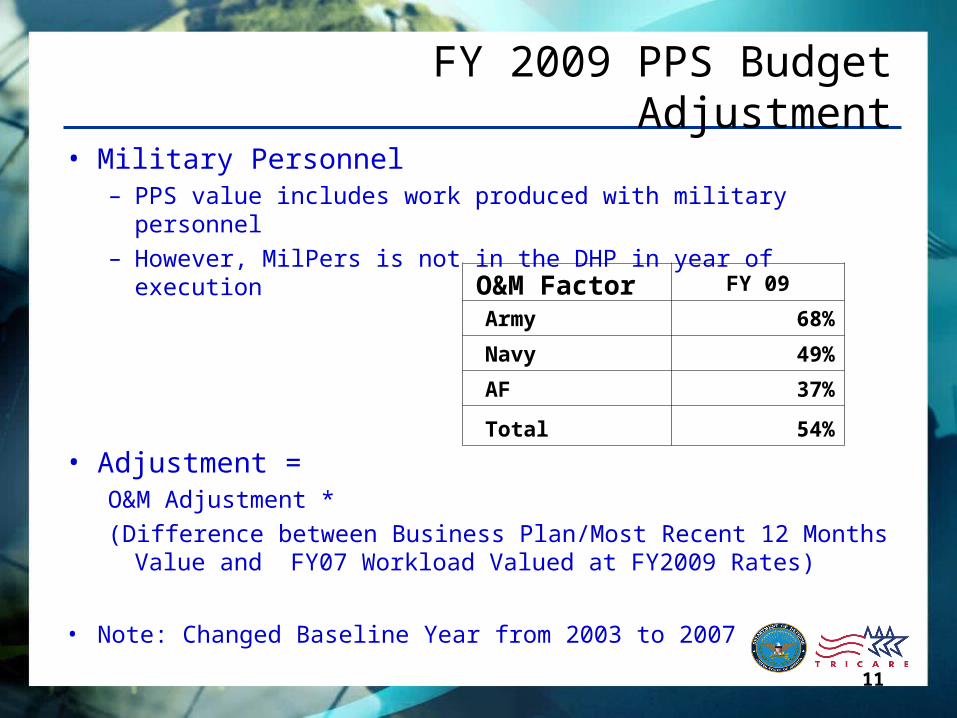
FY 2009 PPS Budget Adjustment
• Military Personnel– PPS value includes work produced with military personnel– However, MilPers is not in the DHP in year of execution
• Adjustment = O&M Adjustment *
(Difference between Business Plan/Most Recent 12 Months Value and FY07 Workload Valued at FY2009 Rates)
• Note: Changed Baseline Year from 2003 to 2007
FY 09
Army 68%
Navy 49%
AF 37%
Total 54%
O&M Factor
12
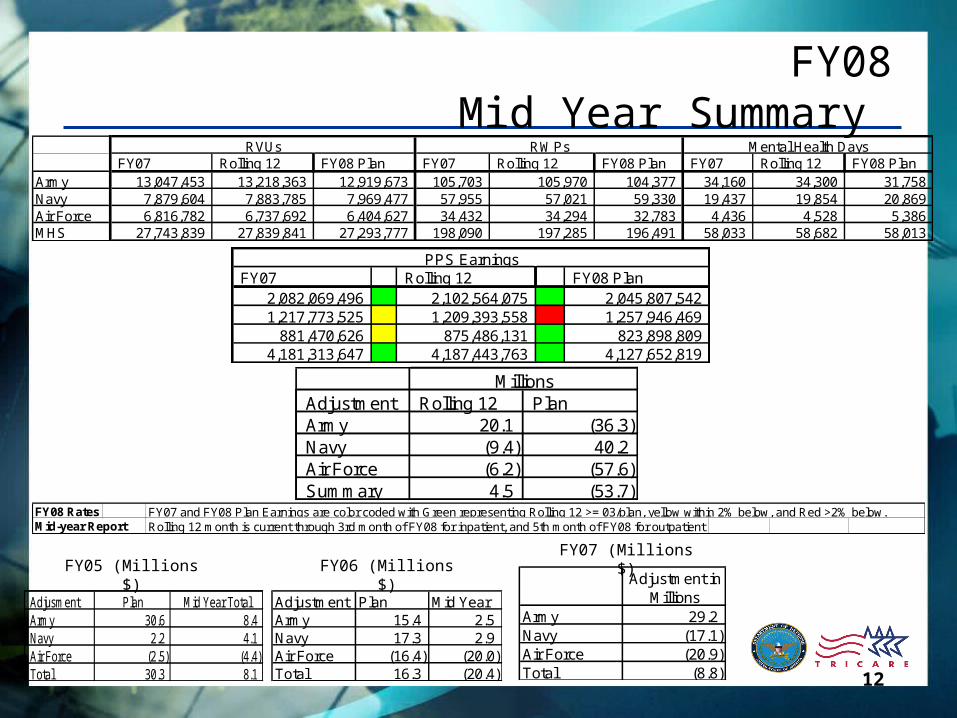
FY08 Mid Year Summary
FY07 Rolling 12 FY08 Plan FY07 Rolling 12 FY08 Plan FY07 Rolling 12 FY08 PlanArmy 13,047,453 13,218,363 12,919,673 105,703 105,970 104,377 34,160 34,300 31,758 Navy 7,879,604 7,883,785 7,969,477 57,955 57,021 59,330 19,437 19,854 20,869 Air Force 6,816,782 6,737,692 6,404,627 34,432 34,294 32,783 4,436 4,528 5,386 MHS 27,743,839 27,839,841 27,293,777 198,090 197,285 196,491 58,033 58,682 58,013
RVUs RWPs Mental Health Days
FY08 Rates FY07 and FY08 Plan Earnings are color coded with Green representing Rolling 12 >= 03/plan, yellow within 2% below, and Red >2% below.Mid-year Report Rolling 12 month is current through 3rd month of FY08 for inpatient, and 5th month of FY08 for outpatient
FY07 Rolling 12 FY08 Plan2,082,069,496 2,102,564,075 2,045,807,542 1,217,773,525 1,209,393,558 1,257,946,469
881,470,626 875,486,131 823,898,809 4,181,313,647 4,187,443,763 4,127,652,819
PPS Earnings
Adjustment Rolling 12 PlanArmy 20.1 (36.3) Navy (9.4) 40.2 Air Force (6.2) (57.6) Summary 4.5 (53.7)
Millions
Adjusment Plan Mid Year TotalArmy 30.6 8.4 Navy 2.2 4.1 Air Force (2.5) (4.4) Total 30.3 8.1
Adjustment Plan Mid YearArmy 15.4 2.5 Navy 17.3 2.9 Air Force (16.4) (20.0) Total 16.3 (20.4)
Adjustment in Millions
Army 29.2 Navy (17.1) Air Force (20.9) Total (8.8)
FY05 (Millions $) FY06 (Millions $)FY07 (Millions $)
13
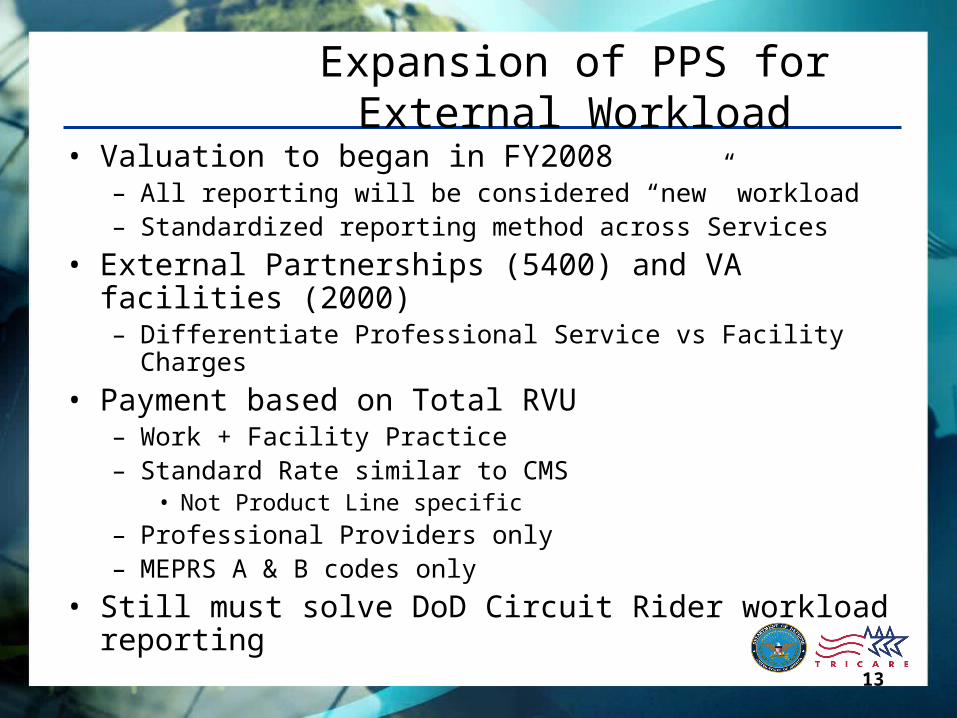
Expansion of PPS forExternal Workload
• Valuation to began in FY2008– All reporting will be considered “new” workload– Standardized reporting method across Services
• External Partnerships (5400) and VA facilities (2000)– Differentiate Professional Service vs Facility Charges
• Payment based on Total RVU– Work + Facility Practice– Standard Rate similar to CMS
• Not Product Line specific
– Professional Providers only– MEPRS A & B codes only
• Still must solve DoD Circuit Rider workload reporting
14
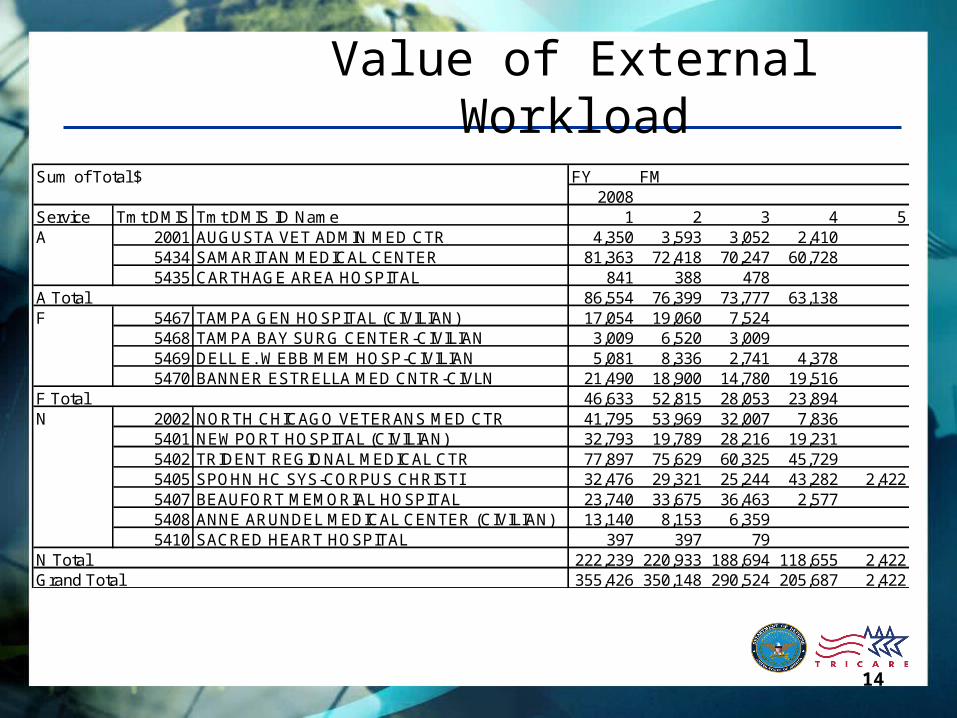
Value of External Workload
Sum of Total $ FY FM2008
Service Tmt DMIS IDTmt DMIS ID Name 1 2 3 4 5A 2001 AUGUSTA VET ADMIN MED CTR 4,350 3,593 3,052 2,410
5434 SAMARITAN MEDICAL CENTER 81,363 72,418 70,247 60,7285435 CARTHAGE AREA HOSPITAL 841 388 478
A Total 86,554 76,399 73,777 63,138F 5467 TAMPA GEN HOSPITAL (CIVILIAN) 17,054 19,060 7,524
5468 TAMPA BAY SURG CENTER-CIVILIAN 3,009 6,520 3,0095469 DELL E. WEBB MEM HOSP-CIVILIAN 5,081 8,336 2,741 4,3785470 BANNER ESTRELLA MED CNTR-CIVLN 21,490 18,900 14,780 19,516
F Total 46,633 52,815 28,053 23,894N 2002 NORTH CHICAGO VETERANS MED CTR 41,795 53,969 32,007 7,836
5401 NEWPORT HOSPITAL (CIVILIAN) 32,793 19,789 28,216 19,2315402 TRIDENT REGIONAL MEDICAL CTR 77,897 75,629 60,325 45,7295405 SPOHN HC SYS-CORPUS CHRISTI 32,476 29,321 25,244 43,282 2,4225407 BEAUFORT MEMORIAL HOSPITAL 23,740 33,675 36,463 2,5775408 ANNE ARUNDEL MEDICAL CENTER (CIVILIAN) 13,140 8,153 6,3595410 SACRED HEART HOSPITAL 397 397 79
N Total 222,239 220,933 188,694 118,655 2,422Grand Total 355,426 350,148 290,524 205,687 2,422
15
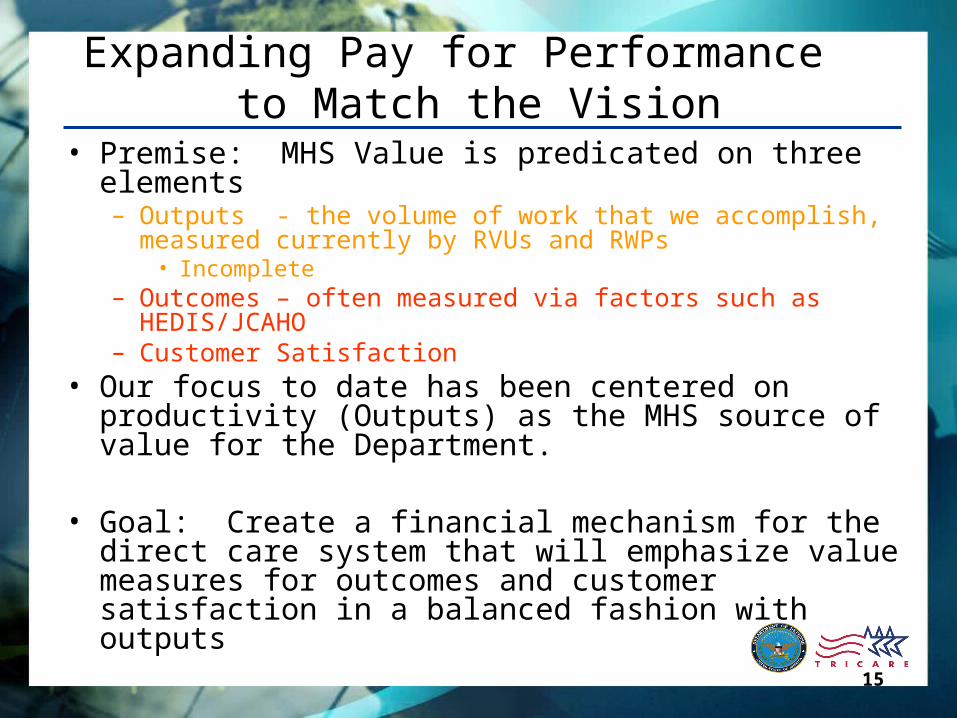
Expanding Pay for Performance to Match the Vision
• Premise: MHS Value is predicated on three elements– Outputs - the volume of work that we accomplish, measured
currently by RVUs and RWPs • Incomplete
– Outcomes – often measured via factors such as HEDIS/JCAHO – Customer Satisfaction
• Our focus to date has been centered on productivity (Outputs) as the MHS source of value for the Department.
• Goal: Create a financial mechanism for the direct care system that will emphasize value measures for outcomes and customer satisfaction in a balanced fashion with outputs

16
Domains
• Quality– HEDIS Preventive Services– ORYX
• Satisfaction– Health Plan– Health Care– Doctor’s Communication
• Access– Getting Needed Care– PCM appointment when available– 3rd next appointment
17
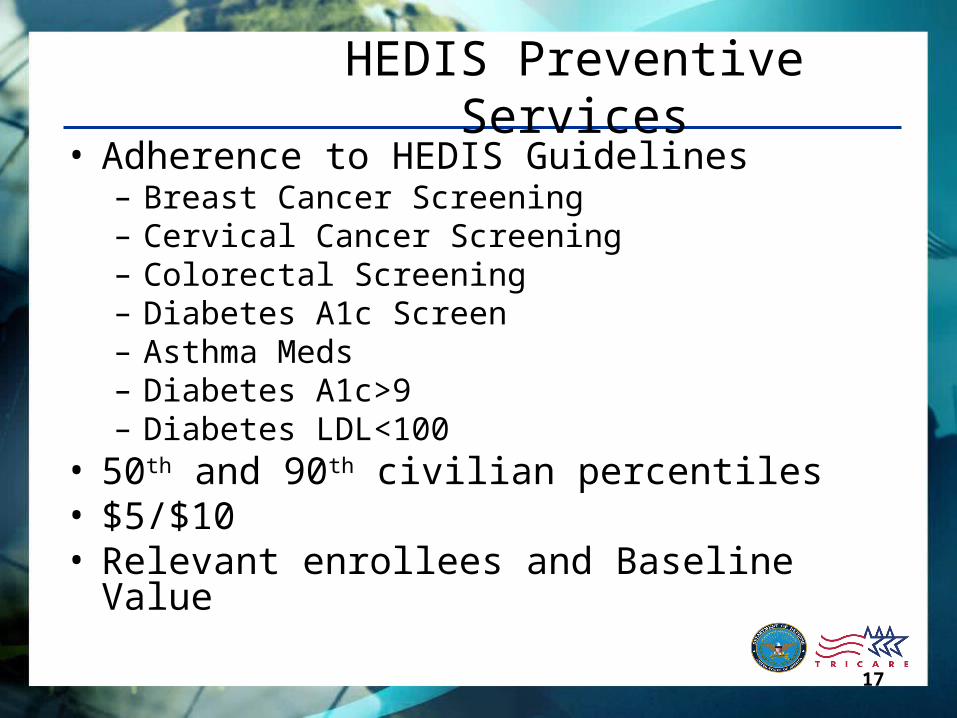
HEDIS Preventive Services• Adherence to HEDIS Guidelines
– Breast Cancer Screening– Cervical Cancer Screening– Colorectal Screening– Diabetes A1c Screen– Asthma Meds– Diabetes A1c>9– Diabetes LDL<100
• 50th and 90th civilian percentiles• $5/$10• Relevant enrollees and Baseline Value
18
ORYX• Adherence to clinical practice guidelines
– CAC– SCIP Antibiotic dc– SCIP Antibiotic overall– Antibiotic Received– Beta Blocker Arrival– Beta Blocker Discharge– HF Discharge– Aspirin
• ORYX benchmark• $400• Relevant patients

19
Health Plan
• % Satisfied (8,9,10) with Health Plan
• Internal DoD 50th, Civilian average
• $10, $25
• Enrollees
20
Health Care
• % Satisfied (8,9,10) with Health Care
• Internal DoD 50th, 90th percentile, Civilian average
• $1, $3, $5
• Visits
21
Doctor’s Communication
• % Response falling in best category (Always) with Doctor’s Communication*
• Internal DoD 50th, 90th percentile, Civilian average
• $1, $3, $5
• Visits
*In the last 12 months, how often did doctors or other health providers listen carefully to you?In the last 12 months, how often did doctors or other health providers explain things in a way you could understand?In the last 12 months, how often did doctors or other health providers show respect for what you had to say?In the last 12 months, how often did doctors or other health providers spend enough time with you?
22
Access to Needed Care
• % Response falling in best category (Not a Problem) with Access to Needed Care*
• Internal DoD 50th, 90th percentile, Civilian average
• $10, $30, $50
• Enrollees
*Since you joined your health plan, how much of a problem, if any, was it to get a personal doctor or nurse you are happy with?In the last 12 months, how much of a problem, if any, was it to see a specialist that you needed to see?In the last 12 months, how much of a problem, if any, was it to get the care, tests or treatment you or a doctor believed necessary?In the last 12 months, did you need approval from your health plan for any care, tests, or treatment?In the last 12 months, how much of a problem, if any, were delays in health care while you waited for approval from your health plan?

23
PCM appointment when available
• % of appointments when PCM is available that are with the enrollees PCM
• Internal DoD 50th, 90th percentile
• $1, $3
• Primary Care Visits
24
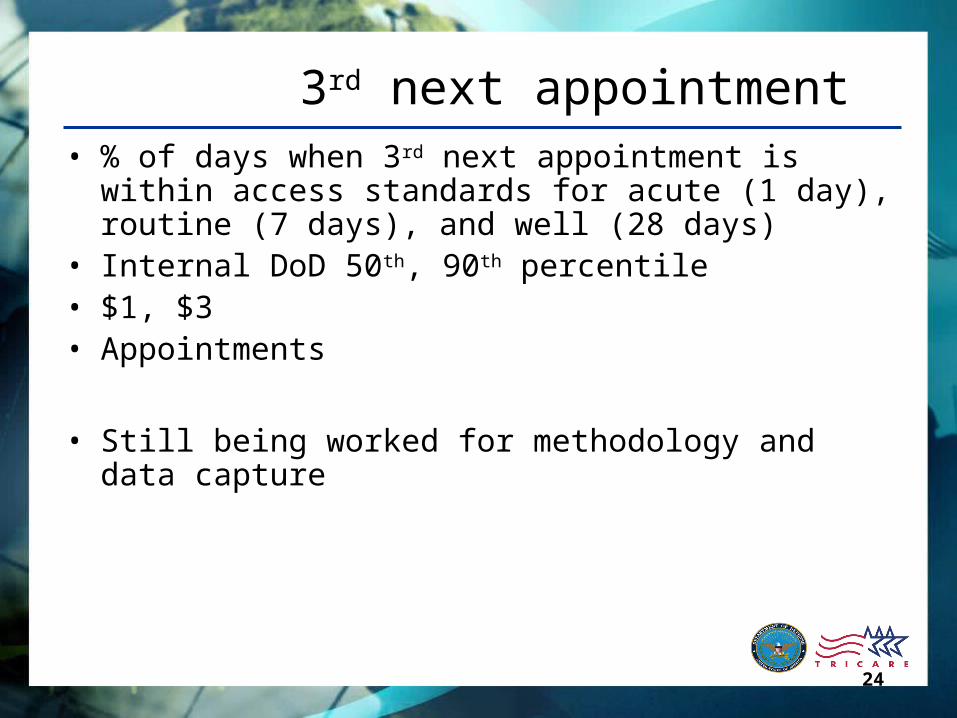
3rd next appointment• % of days when 3rd next appointment is within access
standards for acute (1 day), routine (7 days), and well (28 days)
• Internal DoD 50th, 90th percentile• $1, $3• Appointments
• Still being worked for methodology and data capture
25
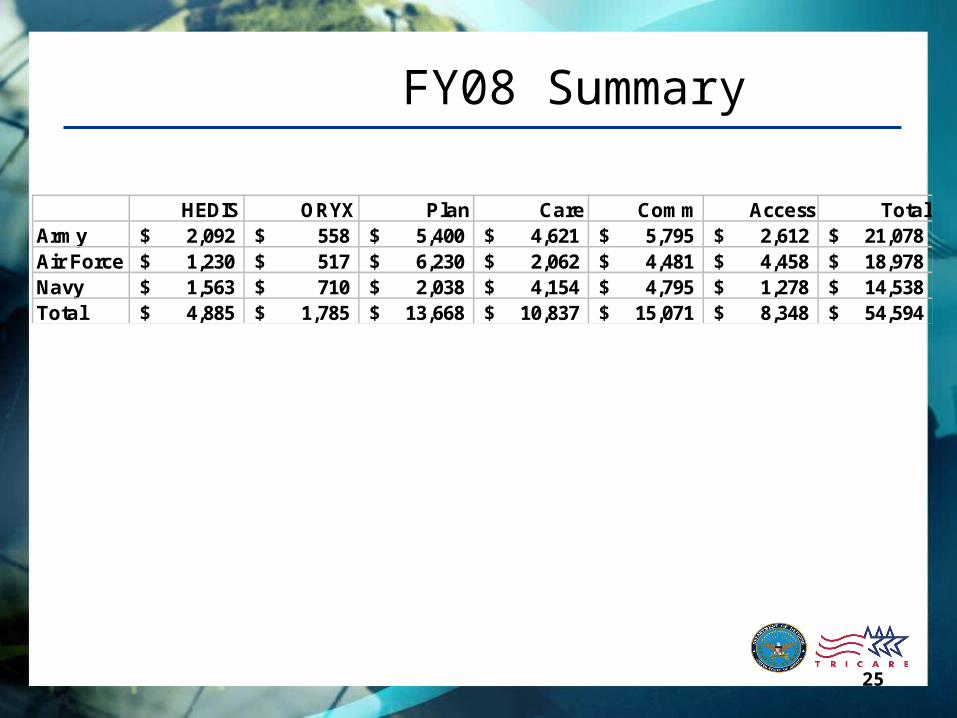
FY08 Summary
HEDIS ORYX Plan Care Comm Access TotalArmy 2,092$ 558$ 5,400$ 4,621$ 5,795$ 2,612$ 21,078$ Air Force 1,230$ 517$ 6,230$ 2,062$ 4,481$ 4,458$ 18,978$ Navy 1,563$ 710$ 2,038$ 4,154$ 4,795$ 1,278$ 14,538$ Total 4,885$ 1,785$ 13,668$ 10,837$ 15,071$ 8,348$ 54,594$

26
Mission Essential Non-Benefit Activities (MENBA)
• QDR: “Capture the quantity, value, and expense of readiness and military-unique services provided by MHS activities”√ Identify and List all Mission Essential/Non-Benefit
Activities (MENBA) performed in the MHS√ Classify & develop Taxonomy for activities– Measure volume of activities– Develop “value”– Incorporate into budget process
27
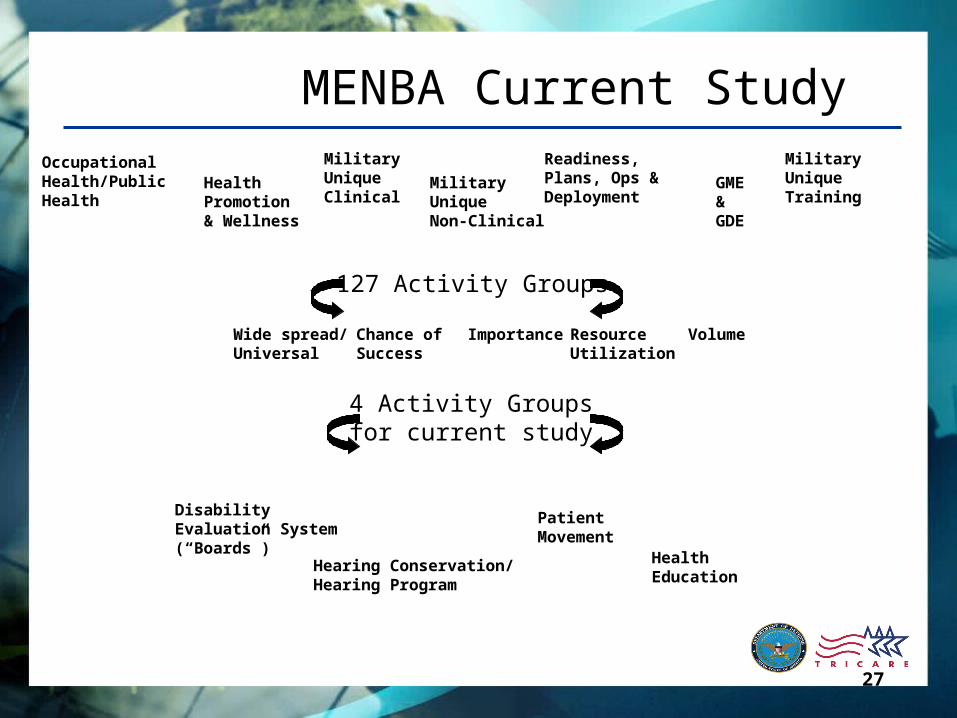
MENBA Current StudyOccupationalHealth/PublicHealth
Health Promotion & Wellness
GME&GDE
MilitaryUniqueTraining
Military UniqueClinical
Military UniqueNon-Clinical
Readiness,Plans, Ops &Deployment
127 Activity Groups
Chance ofSuccess
Wide spread/Universal
Resource Utilization
Importance Volume
4 Activity Groups for current study
DisabilityEvaluation System(“Boards”)
Health Education
Patient Movement
Hearing Conservation/Hearing Program
28
Next Steps – Longer Term
• Expand RBRVS to cover as many of the MENBA activities as possible
• Incorporate MENBA RBRVS into budget process– Build into Business Plans– Justify/adjust MTF budgets based on value of
activities produced

29
Further Improvements
• Total RVUs
• Inpatient Professional
• Ancillary
• Pharmacy
• Dental

30
Issues to Consider
• Incorporate Inpatient Professional Services– Professional services should be coded this year
• UBU has information in guidance• Initial focus External partnerships
– PPS Payment begins FY2008
– Eventually need to expand to all inpatient care• Funding adjustment will begin RWP rate decrease for rounds• Approximately 80% complete (20% lost value)• Began 1 Oct 2002
• Accurate coding– Ensure proper coding for inpatient services are captured in MEPRS A codes– Need to ensure coding matches documentation– Eventually audit adjustments to claims– All MTFs need to Ensure Timely data submission
• Non Provider specialty codes (Generic Clinics)– Last year workload accepted was FY06 – FY07/08 no workload credit
• Treatment of Enrollees– Quality payments will rely on accurate identification of Enrollees– Documentation of treatment for Preventive Services

31
Questions?

32
Back Up Slides
33
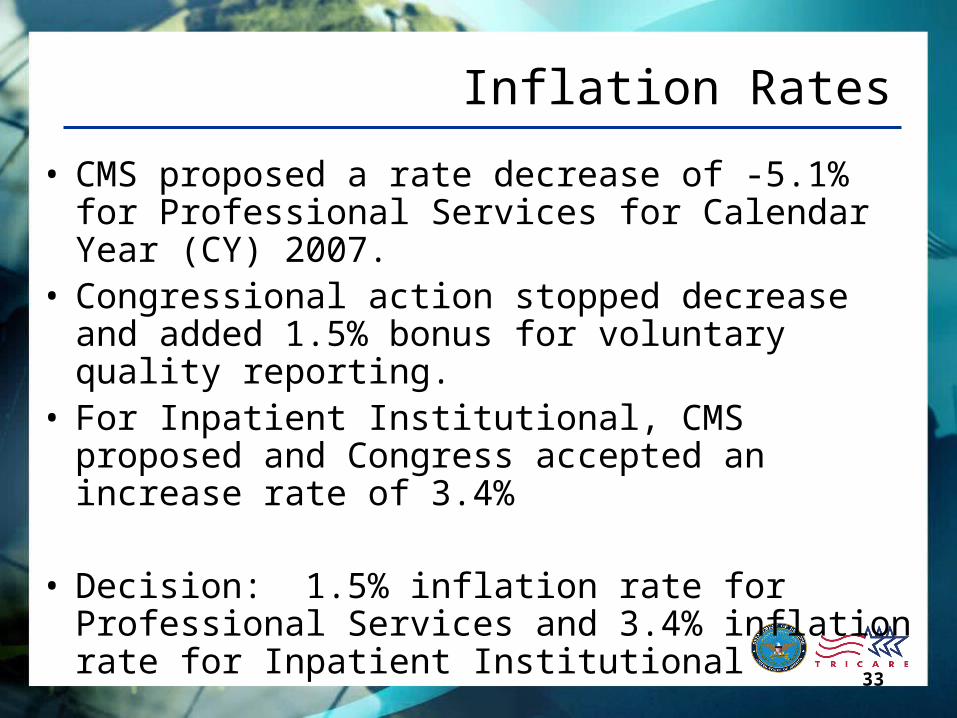
Inflation Rates
• CMS proposed a rate decrease of -5.1% for Professional Services for Calendar Year (CY) 2007.
• Congressional action stopped decrease and added 1.5% bonus for voluntary quality reporting.
• For Inpatient Institutional, CMS proposed and Congress accepted an increase rate of 3.4%
• Decision: 1.5% inflation rate for Professional
Services and 3.4% inflation rate for Inpatient Institutional
34
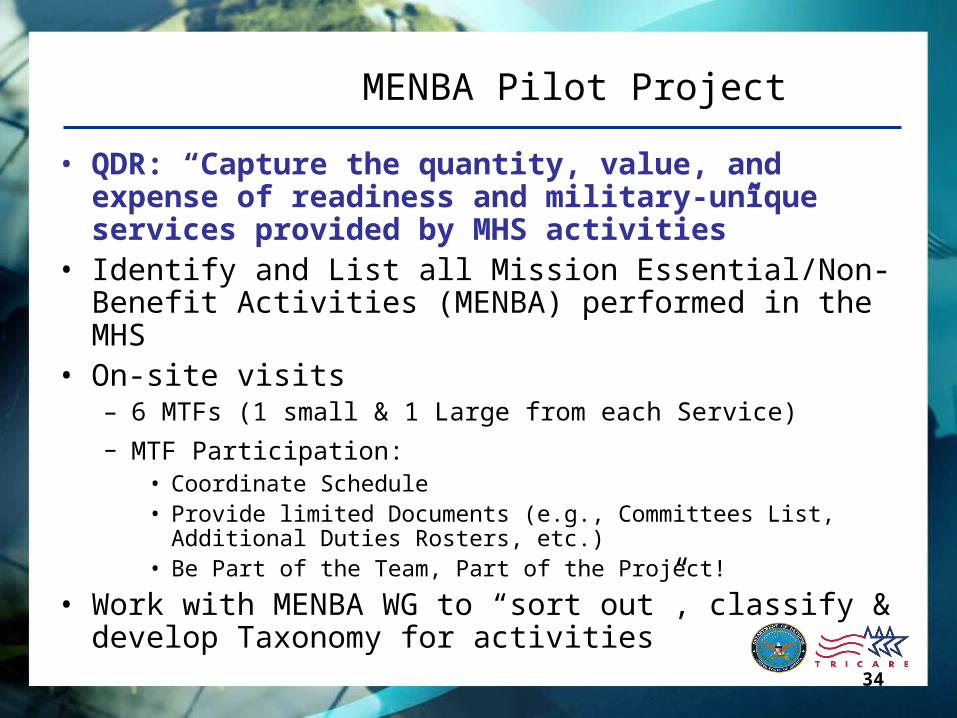
MENBA Pilot Project
• QDR: “Capture the quantity, value, and expense of readiness and military-unique services provided by MHS activities”
• Identify and List all Mission Essential/Non-Benefit Activities (MENBA) performed in the MHS
• On-site visits– 6 MTFs (1 small & 1 Large from each Service)
– MTF Participation: • Coordinate Schedule• Provide limited Documents (e.g., Committees List, Additional Duties
Rosters, etc.)• Be Part of the Team, Part of the Project!
• Work with MENBA WG to “sort out”, classify & develop Taxonomy for activities
35
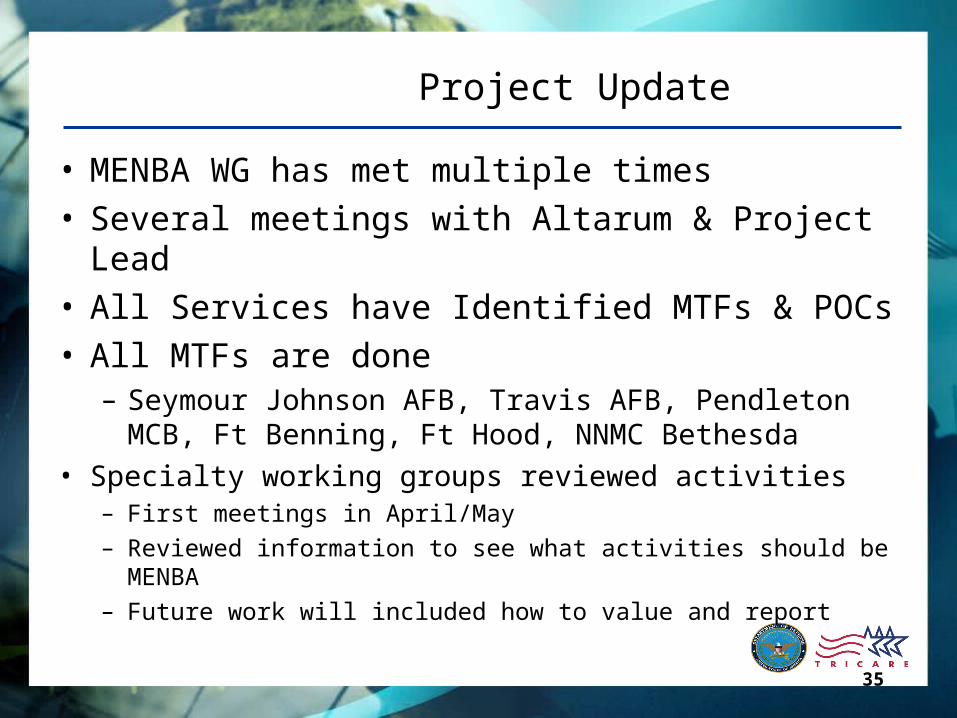
Project Update
• MENBA WG has met multiple times• Several meetings with Altarum & Project Lead• All Services have Identified MTFs & POCs• All MTFs are done
– Seymour Johnson AFB, Travis AFB, Pendleton MCB, Ft Benning, Ft Hood, NNMC Bethesda
• Specialty working groups reviewed activities– First meetings in April/May– Reviewed information to see what activities should be MENBA– Future work will included how to value and report
36
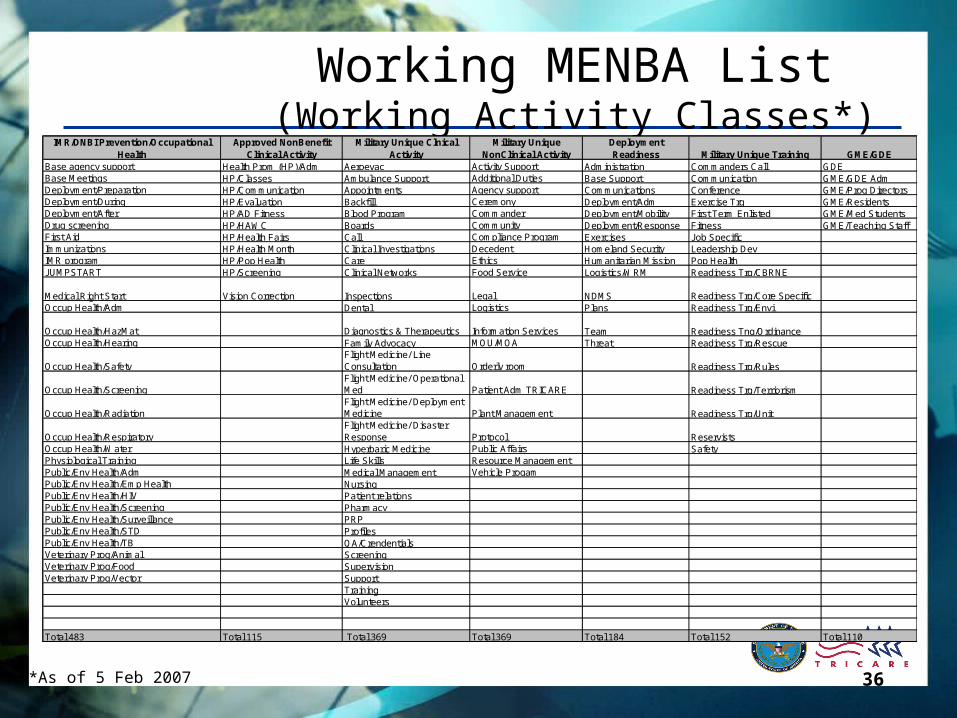
Working MENBA List(Working Activity Classes*)
IMR/DNBI Prevention/Occupational Health
Approved NonBenefit Clinical Activity
Military Unique Clnical Activity
Military Unique NonClinical Activity
Deployment Readiness Military Unique Training GME/GDE
Base agency support Health Prom (HP)/Adm Aeroevac Activity Support Administration Commanders Call GDEBase Meetings HP/Classes Ambulance Support Additional Duties Base Support Communication GME/GDE AdmDeployment/Preparation HP/Communication Appointments Agency support Communications Conference GME/Prog DirectorsDeployment/During HP/Evaluation Backfill Ceremony Deployment/Adm Exercise Trg GME/ResidentsDeployment/After HP/AD Fitness Blood Program Commander Deployment/Mobility First Term Enlisted GME/Med StudentsDrug screening HP/HAWC Boards Community Deployment/Response Fitness GME/Teaching StaffFirst Aid HP/Health Fairs Call Compliance Program Exercises Job SpecificImmunizations HP/Health Month Clinical Investigations Decedent Homeland Security Leadership DevIMR program HP/Pop Health Care Ethics Humanitarian Mission Pop HealthJUMPSTART HP/Screening Clinical Networks Food Service Logistics/WRM Readiness Trg/CBRNE
Medical Right Start Vision Correction Inspections Legal NDMS Readiness Trg/Core SpecificOccup Health/Adm Dental Logistics Plans Readiness Trg/Envi
Occup Health/HazMat Diagnostics & Therapeutics Information Services Team Readiness Tng/OrdinanceOccup Health/Hearing Family Advocacy MOU/MOA Threat Readiness Trg/Rescue
Occup Health/SafetyFlight Medicine/ Line Consultation Orderly room Readiness Trg/Rules
Occup Health/ScreeningFlight Medicine/ Operational Med Patient Adm TRICARE Readiness Trg/Terriorism
Occup Health/RadiationFlight Medicine/ Deployment Medicine Plant Management Readiness Trg/Unit
Occup Health/RespiratoryFlight Medicine/ Disaster Response Protocol Reservists
Occup Health/Water Hyperbaric Medicine Public Affairs SafetyPhysiological Training Life Skills Resource ManagementPublic/Env Health/Adm Medical Management Vehicle ProgamPublic/Env Health/Emp Health NursingPublic/Env Health/HIV Patient relationsPublic/Env Health/Screening PharmacyPublic/Env Health/Surveillance PRPPublic/Env Health/STD ProfilesPublic/Env Health/TB QA/CrendentialsVeterinary Prog/Animal ScreeningVeterinary Prog/Food SupervisionVeterinary Prog/Vector Support
TrainingVolunteers
Total 483 Total 115 Total 369 Total 369 Total 184 Total 152 Total 110
*As of 5 Feb 2007
37
CMS RVU Review/Adjustment
• 5 year review of RVUs• For CY07 significant change in work RVUs• Adjusted to emphasize Patient Doctor
interaction• Result in higher RVU for most E&M codes• Did not dramatically reduce codes for specialists• However, must have balanced budget
– Budget Neutrality Factor reduction– RVUs multiplied by 0.8994

38
Impact of Work RVU change on MHSCY06 MEPRS-B SADR freqs pulled 2/2/2007 from MDR by PPS/BP Product LineWork RVUs based on MHS Master RVU tables for CY06 and CY07
Data
PPS/BP Product
LineSum of CPT
COUNT*
Sum of CY06 Work RVU*Count
Sum of CY07 Work RVU* Count
% Change from CY06
DERM 531,795 382,860 410,653 7.3%ENT 402,139 382,329 420,762 10.1%ER 3,092,846 1,710,620 2,089,619 22.2%IM SUB 3,400,834 1,693,588 1,815,849 7.2%MH 3,701,697 2,787,843 2,831,958 1.6%OB 2,976,090 1,734,160 1,958,748 13.0%OPTOM 4,482,029 2,215,681 2,228,524 0.6%ORTHO 9,027,337 3,221,644 3,360,728 4.3%OTHER 2,657,843 945,825 989,846 4.7%PC 21,306,231 11,319,846 13,311,193 17.6%SURG 529,735 492,782 532,388 8.0%SURG SUB 494,374 413,021 459,713 11.3%OTH 4,049 3,445 3,934 14.2%Grand Total 52,606,999 27,303,646 30,413,915 11.4%
*Includes only CPT codes appearing in both CY06 and CY07 Master RVU tables
39
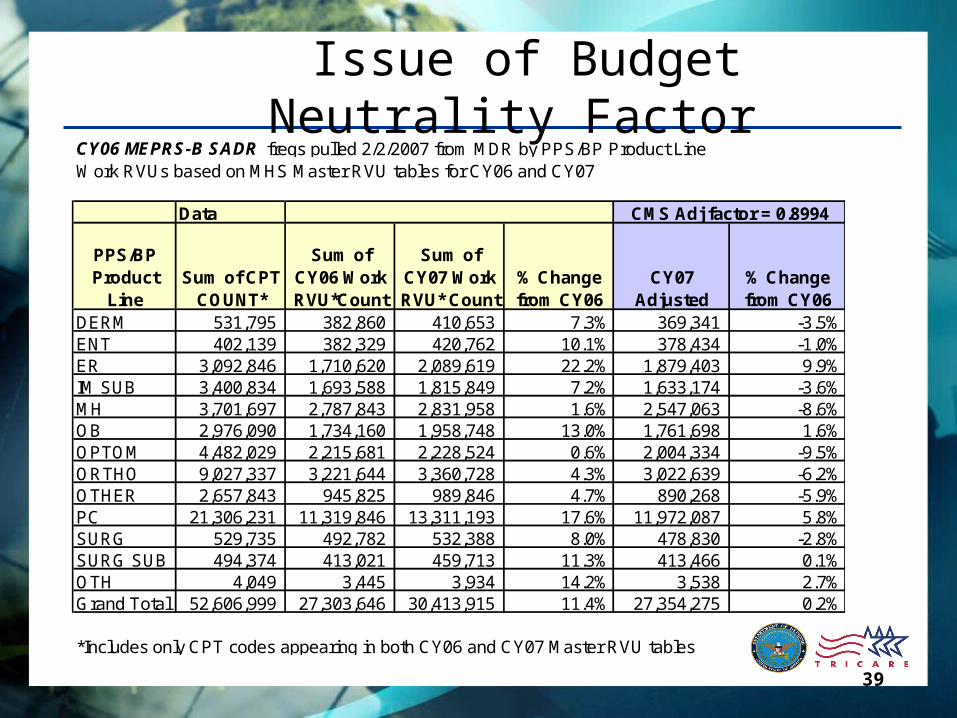
Issue of Budget Neutrality Factor CY06 MEPRS-B SADR freqs pulled 2/2/2007 from MDR by PPS/BP Product LineWork RVUs based on MHS Master RVU tables for CY06 and CY07
Data
PPS/BP Product
LineSum of CPT
COUNT*
Sum of CY06 Work RVU*Count
Sum of CY07 Work RVU* Count
% Change from CY06
CY07 Adjusted
% Change from CY06
DERM 531,795 382,860 410,653 7.3% 369,341 -3.5%ENT 402,139 382,329 420,762 10.1% 378,434 -1.0%ER 3,092,846 1,710,620 2,089,619 22.2% 1,879,403 9.9%IM SUB 3,400,834 1,693,588 1,815,849 7.2% 1,633,174 -3.6%MH 3,701,697 2,787,843 2,831,958 1.6% 2,547,063 -8.6%OB 2,976,090 1,734,160 1,958,748 13.0% 1,761,698 1.6%OPTOM 4,482,029 2,215,681 2,228,524 0.6% 2,004,334 -9.5%ORTHO 9,027,337 3,221,644 3,360,728 4.3% 3,022,639 -6.2%OTHER 2,657,843 945,825 989,846 4.7% 890,268 -5.9%PC 21,306,231 11,319,846 13,311,193 17.6% 11,972,087 5.8%SURG 529,735 492,782 532,388 8.0% 478,830 -2.8%SURG SUB 494,374 413,021 459,713 11.3% 413,466 0.1%OTH 4,049 3,445 3,934 14.2% 3,538 2.7%Grand Total 52,606,999 27,303,646 30,413,915 11.4% 27,354,275 0.2%
*Includes only CPT codes appearing in both CY06 and CY07 Master RVU tables
CMS Adj factor = 0.8994
40
MHS Impact
• M2 Database– Simple Work RVU will show new RVUs
• Resulting in approximately 11% overall increase
– PPS Work RVU not adjusted for neutrality factor• CY07 RVUs multiplied by 0.8994 in reconciliation• Will result in mixed year for FY07
– New RVU measure for comparison across years • Will allow for comparison of same Work RVU across
multiple years• Needed for Metrics and other trending purposes• Will be accomplished during Summer Retro fit• Likely will take place of one of the current RVU measures

41
Ancillary/Dental
• Ancillary– Where are we now
• Ancillary data in MDR• Ancillary tables in M2
– How approach• Reviewing data• Apply weight• Determine payment method
• Dental– Starting to collect data in central systems– Need to review data for consistency across Services– Weights likely from CMS/ADA– Payments still need to be determined
42
Pharmacy
• Pharmacy expenses currently not covered under the PPS
• Goal: PPS for pharmacy • FY08 pharmacy direct care mechanism would
be shadowed• Payment would be the ingredient cost of the
drugs plus a dispensing fee per prescription. – Initially this will just be dispensing fee– Ingredient cost waiting on new system
• In FY09, if feasible, we would adjust the direct care pharmacy budget directly in proportion to the pharmaceuticals provided by MTFs.
43
Industry Standard Workload
• Inpatient/Outpatient vs. Institutional/Professional• Industry Based Workload Alignment (IBWA)
– Rounds capture 2yrs old (appx 80% complete)– Full Inpatient professional workload capture began last year– Enhanced SADR (Standard Provider ID plus Modifiers)– Would allow PPS value to follow more closely TMAC– Would allow credit for professional work done away from facility
• External Resource Sharing• Circuit Riders• Joint Facilities
• Full RVU vice Simple Work RVU

44
Utilization Management/Capitation
• Utilization Management (UM) is used to measure improvement in medical care efficiency and to control costs
• Idea: Give a bonus to an MTF if their UM metric is below the “target” and reduce an MTF revenue if the UM metric is above the target.
• Metric will be based on volume of inpatient and outpatient care provided to MTF enrollees (purchased or direct) adjusted for demographics
• Potential UM target could be based on the PMPM target of staying below a 7% cost growth.
45
Moving from budget to PPS workload
• Adjust target based on dollar budget adjustment– 807700 O&M plus MILPERS adjustments– Must take into account that PPS is not complete
• Apply percentage ratio– Program was adjusted based on MEPRS based full
cost and claims of providing care to AD and ADFM– Use total non-pharmacy MEPRS cost as
denominator and PPS value as numerator
46
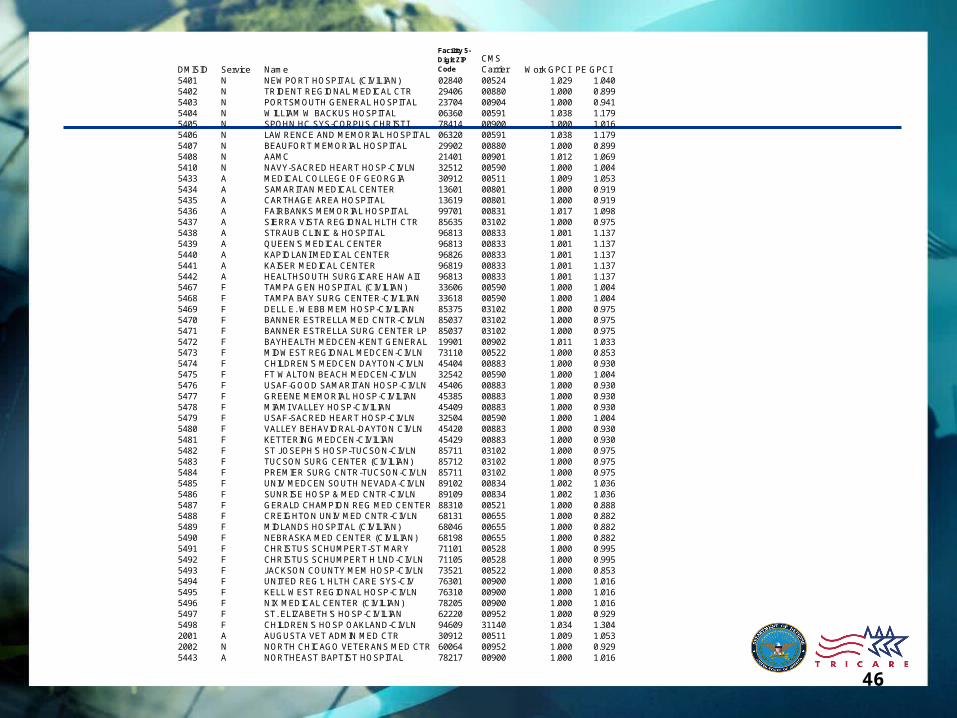
DMISID Service Name
Facility 5-Digit ZIP Code
CMS Carrier Work GPCI PE GPCI
5401 N NEWPORT HOSPITAL (CIVILIAN) 02840 00524 1.029 1.0405402 N TRIDENT REGIONAL MEDICAL CTR 29406 00880 1.000 0.8995403 N PORTSMOUTH GENERAL HOSPITAL 23704 00904 1.000 0.9415404 N WILLIAM W BACKUS HOSPITAL 06360 00591 1.038 1.1795405 N SPOHN HC SYS-CORPUS CHRISTI 78414 00900 1.000 1.0165406 N LAWRENCE AND MEMORIAL HOSPITAL 06320 00591 1.038 1.1795407 N BEAUFORT MEMORIAL HOSPITAL 29902 00880 1.000 0.8995408 N AAMC 21401 00901 1.012 1.0695410 N NAVY-SACRED HEART HOSP-CIVLN 32512 00590 1.000 1.0045433 A MEDICAL COLLEGE OF GEORGIA 30912 00511 1.009 1.0535434 A SAMARITAN MEDICAL CENTER 13601 00801 1.000 0.9195435 A CARTHAGE AREA HOSPITAL 13619 00801 1.000 0.9195436 A FAIRBANKS MEMORIAL HOSPITAL 99701 00831 1.017 1.0985437 A SIERRA VISTA REGIONAL HLTH CTR 85635 03102 1.000 0.9755438 A STRAUB CLINIC & HOSPITAL 96813 00833 1.001 1.1375439 A QUEEN'S MEDICAL CENTER 96813 00833 1.001 1.1375440 A KAPIOLANI MEDICAL CENTER 96826 00833 1.001 1.1375441 A KAISER MEDICAL CENTER 96819 00833 1.001 1.1375442 A HEALTHSOUTH SURGICARE HAWAII 96813 00833 1.001 1.1375467 F TAMPA GEN HOSPITAL (CIVILIAN) 33606 00590 1.000 1.0045468 F TAMPA BAY SURG CENTER-CIVILIAN 33618 00590 1.000 1.0045469 F DELL E. WEBB MEM HOSP-CIVILIAN 85375 03102 1.000 0.9755470 F BANNER ESTRELLA MED CNTR-CIVLN 85037 03102 1.000 0.9755471 F BANNER ESTRELLA SURG CENTER LP 85037 03102 1.000 0.9755472 F BAYHEALTH MEDCEN-KENT GENERAL 19901 00902 1.011 1.0335473 F MIDWEST REGIONAL MEDCEN-CIVLN 73110 00522 1.000 0.8535474 F CHILDREN'S MEDCEN DAYTON-CIVLN 45404 00883 1.000 0.9305475 F FT WALTON BEACH MEDCEN-CIVLN 32542 00590 1.000 1.0045476 F USAF-GOOD SAMARITAN HOSP-CIVLN 45406 00883 1.000 0.9305477 F GREENE MEMORIAL HOSP-CIVILIAN 45385 00883 1.000 0.9305478 F MIAMI VALLEY HOSP-CIVILIAN 45409 00883 1.000 0.9305479 F USAF-SACRED HEART HOSP-CIVLN 32504 00590 1.000 1.0045480 F VALLEY BEHAVIORAL-DAYTON CIVLN 45420 00883 1.000 0.9305481 F KETTERING MEDCEN-CIVILIAN 45429 00883 1.000 0.9305482 F ST JOSEPH'S HOSP-TUCSON-CIVLN 85711 03102 1.000 0.9755483 F TUCSON SURG CENTER (CIVILIAN) 85712 03102 1.000 0.9755484 F PREMIER SURG CNTR-TUCSON-CIVLN 85711 03102 1.000 0.9755485 F UNIV MEDCEN SOUTH NEVADA-CIVLN 89102 00834 1.002 1.0365486 F SUNRISE HOSP & MED CNTR-CIVLN 89109 00834 1.002 1.0365487 F GERALD CHAMPION REG MED CENTER 88310 00521 1.000 0.8885488 F CREIGHTON UNIV MED CNTR-CIVLN 68131 00655 1.000 0.8825489 F MIDLANDS HOSPITAL (CIVILIAN) 68046 00655 1.000 0.8825490 F NEBRASKA MED CENTER (CIVILIAN) 68198 00655 1.000 0.8825491 F CHRISTUS SCHUMPERT-ST MARY 71101 00528 1.000 0.9955492 F CHRISTUS SCHUMPERT H'LND-CIVLN 71105 00528 1.000 0.9955493 F JACKSON COUNTY MEM HOSP-CIVLN 73521 00522 1.000 0.8535494 F UNITED REG'L HLTH CARE SYS-CIV 76301 00900 1.000 1.0165495 F KELL WEST REGIONAL HOSP-CIVLN 76310 00900 1.000 1.0165496 F NIX MEDICAL CENTER (CIVILIAN) 78205 00900 1.000 1.0165497 F ST. ELIZABETH'S HOSP-CIVILIAN 62220 00952 1.000 0.9295498 F CHILDREN'S HOSP OAKLAND-CIVLN 94609 31140 1.034 1.3042001 A AUGUSTA VET ADMIN MED CTR 30912 00511 1.009 1.0532002 N NORTH CHICAGO VETERANS MED CTR 60064 00952 1.000 0.9295443 A NORTHEAST BAPTIST HOSPITAL 78217 00900 1.000 1.016
47
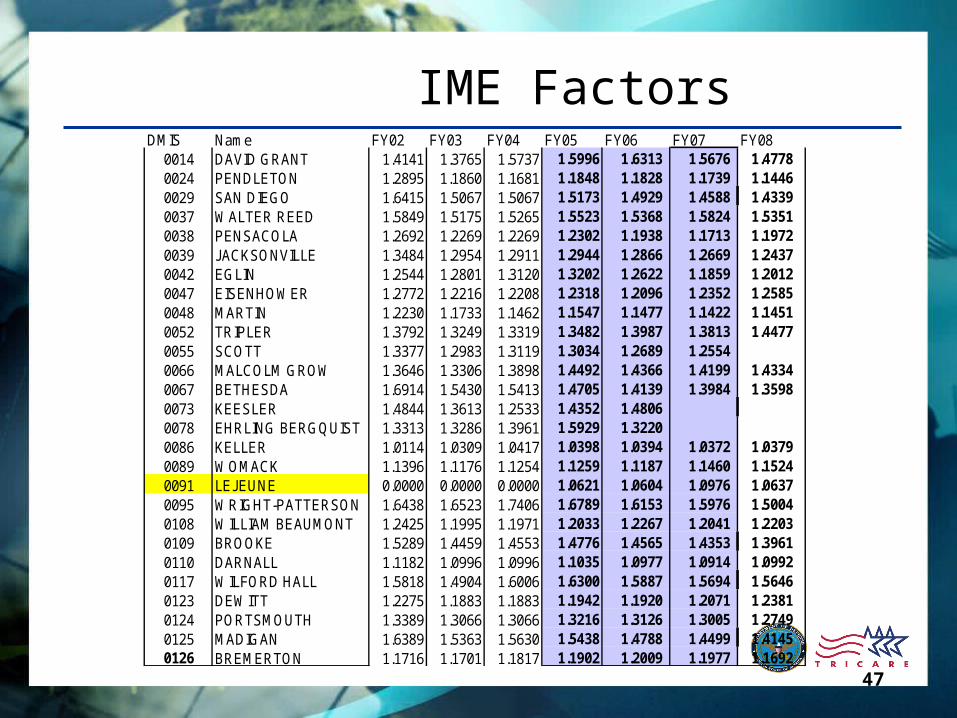
IME FactorsDMIS Name FY02 FY03 FY04 FY05 FY06 FY07 FY08
0014 DAVID GRANT 1.4141 1.3765 1.5737 1.5996 1.6313 1.5676 1.47780024 PENDLETON 1.2895 1.1860 1.1681 1.1848 1.1828 1.1739 1.14460029 SAN DIEGO 1.6415 1.5067 1.5067 1.5173 1.4929 1.4588 1.43390037 WALTER REED 1.5849 1.5175 1.5265 1.5523 1.5368 1.5824 1.53510038 PENSACOLA 1.2692 1.2269 1.2269 1.2302 1.1938 1.1713 1.19720039 JACKSONVILLE 1.3484 1.2954 1.2911 1.2944 1.2866 1.2669 1.24370042 EGLIN 1.2544 1.2801 1.3120 1.3202 1.2622 1.1859 1.20120047 EISENHOWER 1.2772 1.2216 1.2208 1.2318 1.2096 1.2352 1.25850048 MARTIN 1.2230 1.1733 1.1462 1.1547 1.1477 1.1422 1.14510052 TRIPLER 1.3792 1.3249 1.3319 1.3482 1.3987 1.3813 1.44770055 SCOTT 1.3377 1.2983 1.3119 1.3034 1.2689 1.2554 0066 MALCOLM GROW 1.3646 1.3306 1.3898 1.4492 1.4366 1.4199 1.43340067 BETHESDA 1.6914 1.5430 1.5413 1.4705 1.4139 1.3984 1.35980073 KEESLER 1.4844 1.3613 1.2533 1.4352 1.4806 0078 EHRLING BERGQUIST 1.3313 1.3286 1.3961 1.5929 1.3220 0086 KELLER 1.0114 1.0309 1.0417 1.0398 1.0394 1.0372 1.03790089 WOMACK 1.1396 1.1176 1.1254 1.1259 1.1187 1.1460 1.15240091 LEJEUNE 0.0000 0.0000 0.0000 1.0621 1.0604 1.0976 1.06370095 WRIGHT-PATTERSON 1.6438 1.6523 1.7406 1.6789 1.6153 1.5976 1.50040108 WILLIAM BEAUMONT 1.2425 1.1995 1.1971 1.2033 1.2267 1.2041 1.22030109 BROOKE 1.5289 1.4459 1.4553 1.4776 1.4565 1.4353 1.39610110 DARNALL 1.1182 1.0996 1.0996 1.1035 1.0977 1.0914 1.09920117 WILFORD HALL 1.5818 1.4904 1.6006 1.6300 1.5887 1.5694 1.56460123 DEWITT 1.2275 1.1883 1.1883 1.1942 1.1920 1.2071 1.23810124 PORTSMOUTH 1.3389 1.3066 1.3066 1.3216 1.3126 1.3005 1.27490125 MADIGAN 1.6389 1.5363 1.5630 1.5438 1.4788 1.4499 1.41450126 BREMERTON 1.1716 1.1701 1.1817 1.1902 1.2009 1.1977 1.1692
48
Current PPS Measures
• Process– Breast Cancer Screening– Cervical Cancer Screening– Colorectal Screening– Diabetes A1c Screen– Asthma Meds
• Outcome– Diabetes A1c>9– Diabetes LDL<100


