68
1 Regional Energy Accounting, Disputes Mechanism and Resolutions -R M Rangarajan & Asit Singh. -Executive Engineer, -SRPC, Bangalore
| Date post: | 27-Dec-2015 |
| Category: |
Documents |
| Upload: | bennett-owen |
| View: | 214 times |
| Download: | 0 times |

1
Regional Energy Accounting, Disputes Mechanism and
Resolutions
-R M Rangarajan & Asit Singh.-Executive Engineer,-SRPC, Bangalore

2
WHAT IS Regional Energy Account (REA) ?
• “ REA is Statement of Allocation, Availability,Energy Scheduled/ injected and drawn which forms the basis for payment/ receipt among the constituents”
3
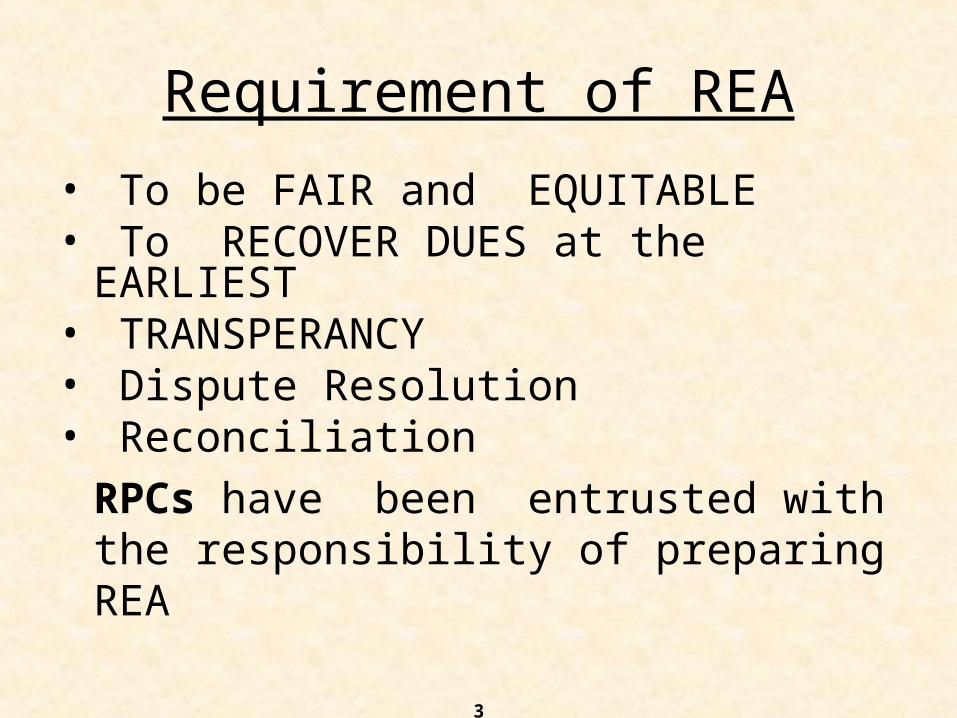
Requirement of REA
• To be FAIR and EQUITABLE• To RECOVER DUES at the EARLIEST • TRANSPERANCY• Dispute Resolution• Reconciliation
RPCs have been entrusted with the responsibility of preparing REA
4
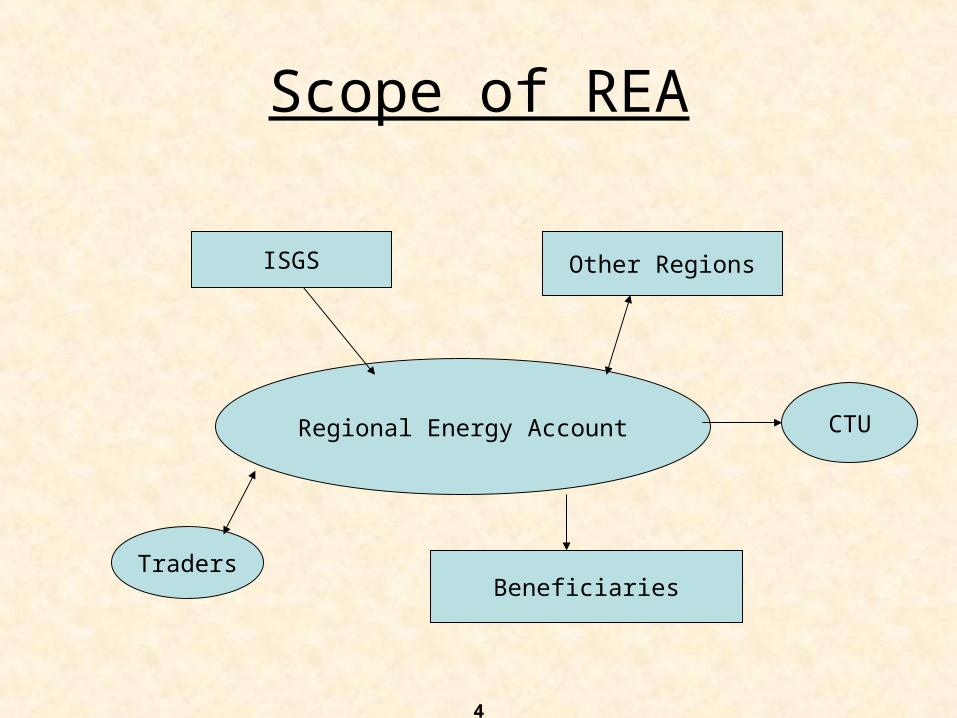
Scope of REA
Regional Energy Account
ISGS Other Regions
BeneficiariesTraders
CTU
5
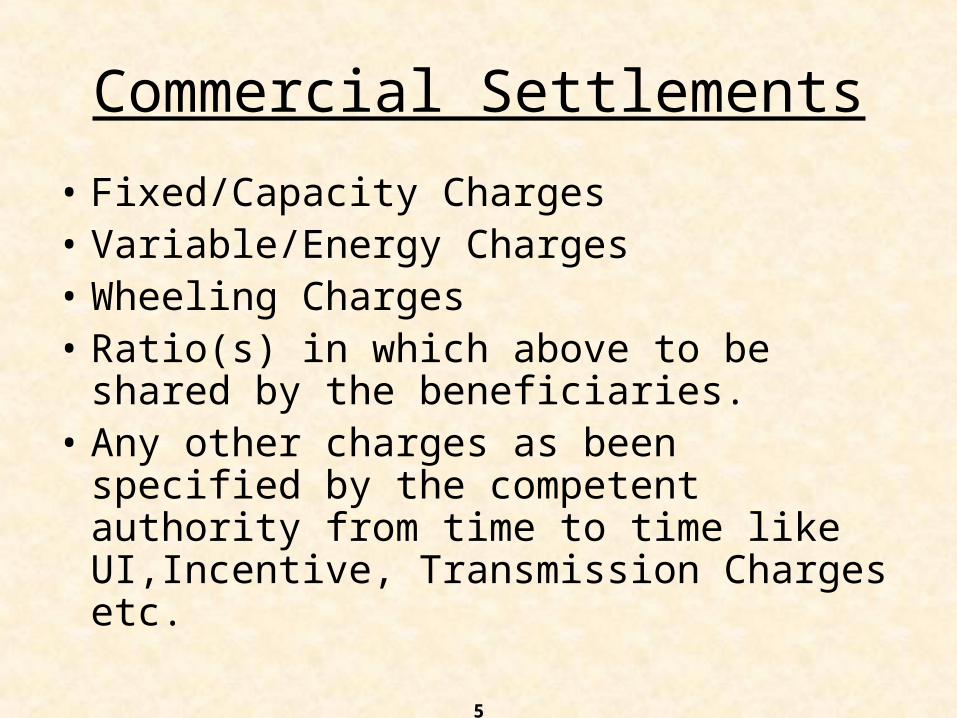
Commercial Settlements
• Fixed/Capacity Charges• Variable/Energy Charges• Wheeling Charges• Ratio(s) in which above to be shared by
the beneficiaries.• Any other charges as been specified by
the competent authority from time to time like UI,Incentive, Transmission Charges etc.
6
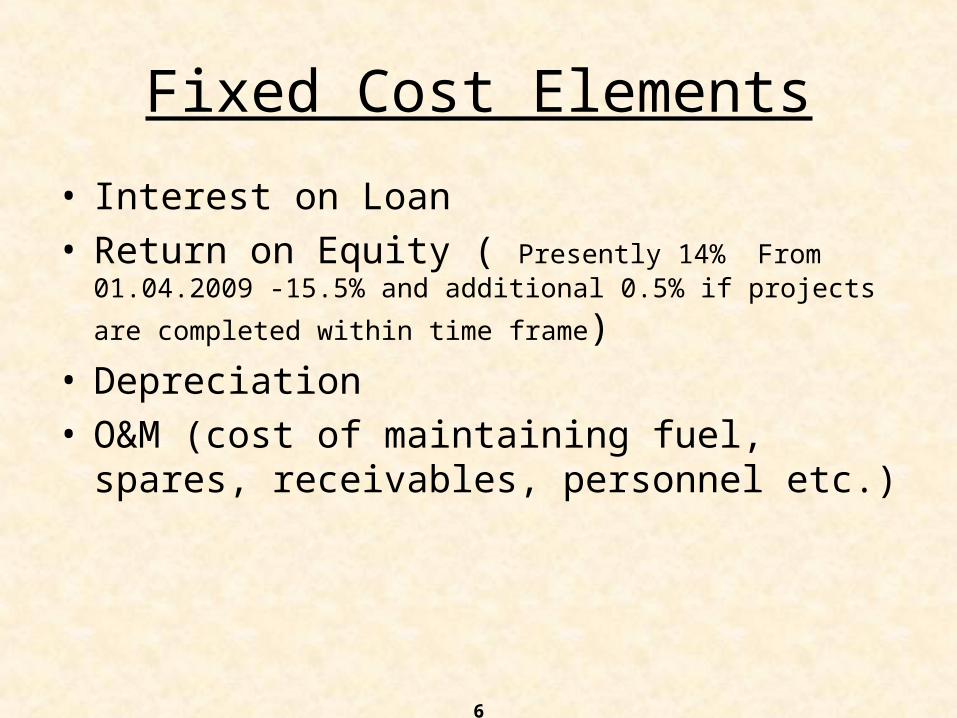
Fixed Cost Elements
• Interest on Loan• Return on Equity ( Presently 14% From 01.04.2009 -15.5%
and additional 0.5% if projects are completed within time frame)• Depreciation• O&M (cost of maintaining fuel, spares,
receivables, personnel etc.)

O & M for Thermal
Year 200/210/250 MW
300/330/350 MW
500 MW 600 MW and above
2009-10 18.20 16.00 13.00 11.70
2010-11 19.24 16.92 13.74 12.37
2011-12 20.34 17.88 14.53 13.08
2012-13 21.51 18.91 15.36 13.82
2013-14 22.74 19.99 16.24 14.62
7
Rs. In lakh/MW
Hydro Normalised O& M for 2003-04 to 2007-08 escalated at 5.17 %

O & M for Transmission System
SS 2009-10 2010-11 2011-12 2012-12 2013-14
765 kV 73.36 77.56 81.99 86.68 91.64
400 kV 52.40 55.40 58.57 61.92 65.46
220 kV 36.68 38.78 41.00 43.34 45.82
132 kV & < 26.20 27.70 29.28 30.96 32.73
HVDC Stations
HVDC B2B Rs. Lakh/ 500 MW
443.00 468.00 495.00 523.00 553.00
Rihand-Dardri (Rs. Lakh)
1450.00 1533.00 1621.00 1713.00 1811.011
Talcher-Kolar (Rs. Lakh)
1699.00 1796.00 1899.00 2008.00 2122.00
8
Rs. In lakh/bay

O & M for Transmission System
TL 2009-10 2010-11 2011-12 2012-12 2013-14
AC and HVDC lines
S/C ( Bundled conductor)
0.537 .568 .600 .635 .671
S/C( Twin or Triple conductor)
0.358 0.378 0.400 0.423 0.447
S/C( Single conductor)
0.179 0.189 0.200 0.212 0.224
D/C (Bundled Conductor
0.940 0.994 1.051 1.111 1.174
D/C ( Twin & Triple Conductor)
0.627 0.663 0.701 0.741 0.783
D/C ( Single) 0.269 0.284 0.301 0.318 0.336
9
Rs. In lakh/km

10
Fixed Cost Elements
• Cost of secondary fuel( for coal-based and lignite fired
generating stations only – From 01.04.2009)• Insurance, Taxes, etc. ( Not there from 01.04.2009)
• Special allowance in lieu of R&M or separate compensation allowance
(Independent of Energy produced)
11
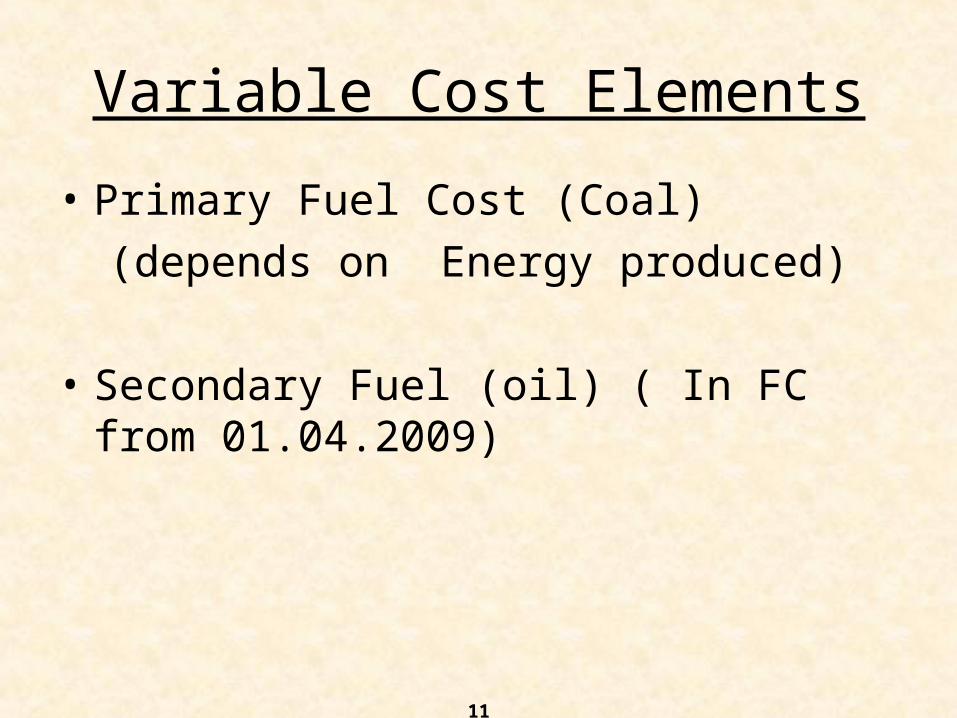
Variable Cost Elements
• Primary Fuel Cost (Coal)
(depends on Energy produced)
• Secondary Fuel (oil) ( In FC from 01.04.2009)
12
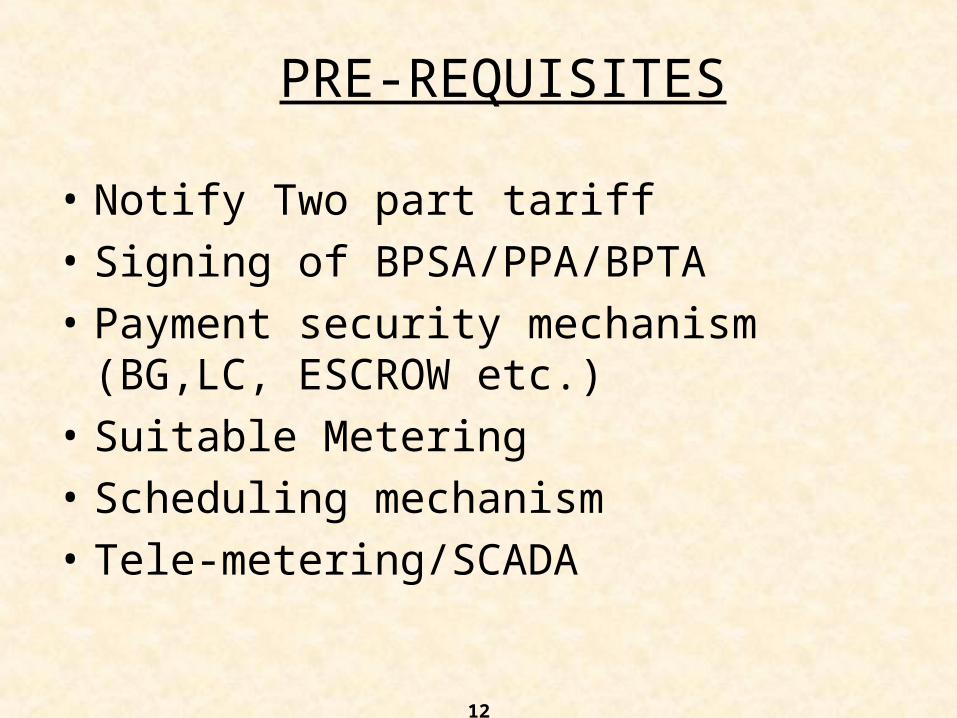
PRE-REQUISITES
• Notify Two part tariff
• Signing of BPSA/PPA/BPTA
• Payment security mechanism (BG,LC, ESCROW etc.)
• Suitable Metering
• Scheduling mechanism
• Tele-metering/SCADA

13
Pre ABT REA
• Fixed and variable charges merged to make single rate in paisa/KWhr
• Charges to be paid by beneficiaries on the basis of energy drawal
• No weightage to Entitlement/schedule of various beneficiaries in a particular generator (Typically in SR)

14
PRE ABT TARIFF MECHANISM - ProblemsAll inter-utility exchanges based on single flat paise/kWHThis rate neither change with time of the day i.e; peak/off-peak or system conditions(generation surplus or deficit)Do not discourage MW overdrawals by SEBs.They could avoid this by proper load management, run their own higher cost generator DGs,GTs durng contingenciesDo not induce power plant operator to back down generation during off-peak hoursNo financial compensation to any party for over stressing its power plants for assisting during contingenciesSEBs view this composite figure only and compare with their own generating stations for their dispatch decisionsISGS(pit head plant)with lower incremental costs used to back down before backing down their own costlier load center generatorsThis leads to perpetual operational and commercial disputes in the operation of region grid
15
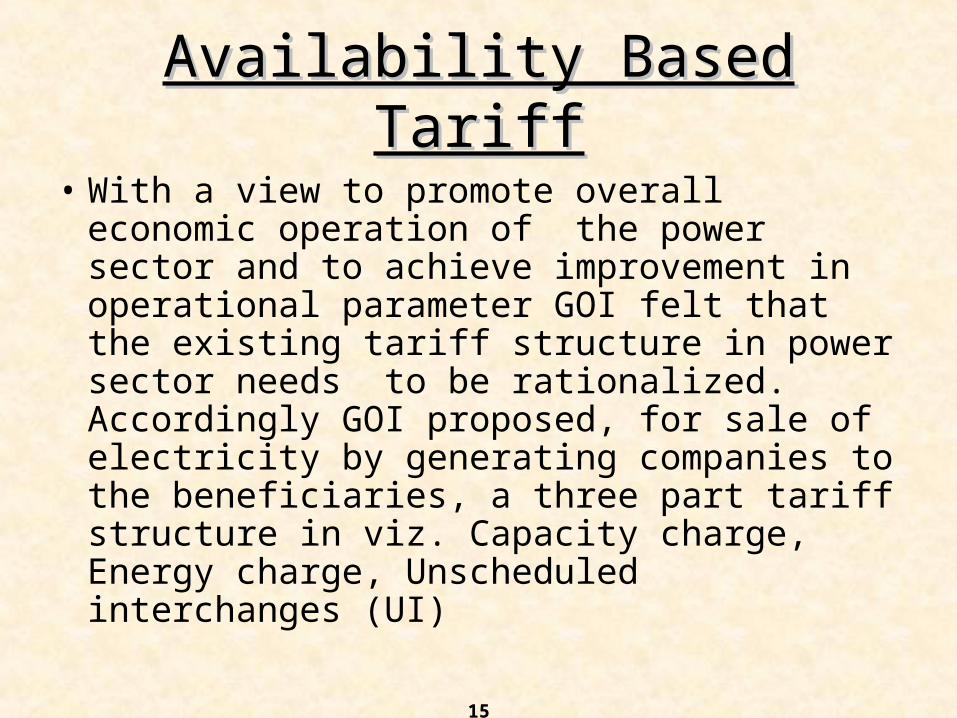
Availability Based TariffAvailability Based Tariff
• With a view to promote overall economic operation of the power sector and to achieve improvement in operational parameter GOI felt that the existing tariff structure in power sector needs to be rationalized. Accordingly GOI proposed, for sale of electricity by generating companies to the beneficiaries, a three part tariff structure in viz. Capacity charge, Energy charge, Unscheduled interchanges (UI)

16
AVAILABILITY BASED TARIFF(ABT)(a) CAPACITY CHARGE(b) ENERGY CHARGE(c) ADJUSTMENT FOR DEVIATIONS
(UI CHARGE)
(a) = a function of Ex-bus MW availability of power plant for the day declared before the day starts x SEB’s % share
.(b) = MWh for the day as per ex=bus drawl schedule for the SEB
finalized before the day starts x Energy charge rate
(c) =Σ(Actual energy interchange in a 15 min time block – scheduled energy interchange for the time block) x UI rate for the time block.
TOTAL PAYMENT = (a) + (b)± ( c)

Advantages of ABT• Improved frequency and voltage ?• Economic despatch ?• Autonomy to the utility ?• Incentive for high plant availability,but no incentive to
over generation during off-peak hours• Technically and commercially right ?• Immediate solution for IPPs and Captives ??• True free market ; market forces decide the pool price ?• Pool price known on-line ?• Total transparency ; No regulator required ?• Simple practicable ; Meters already developed and
installed
18
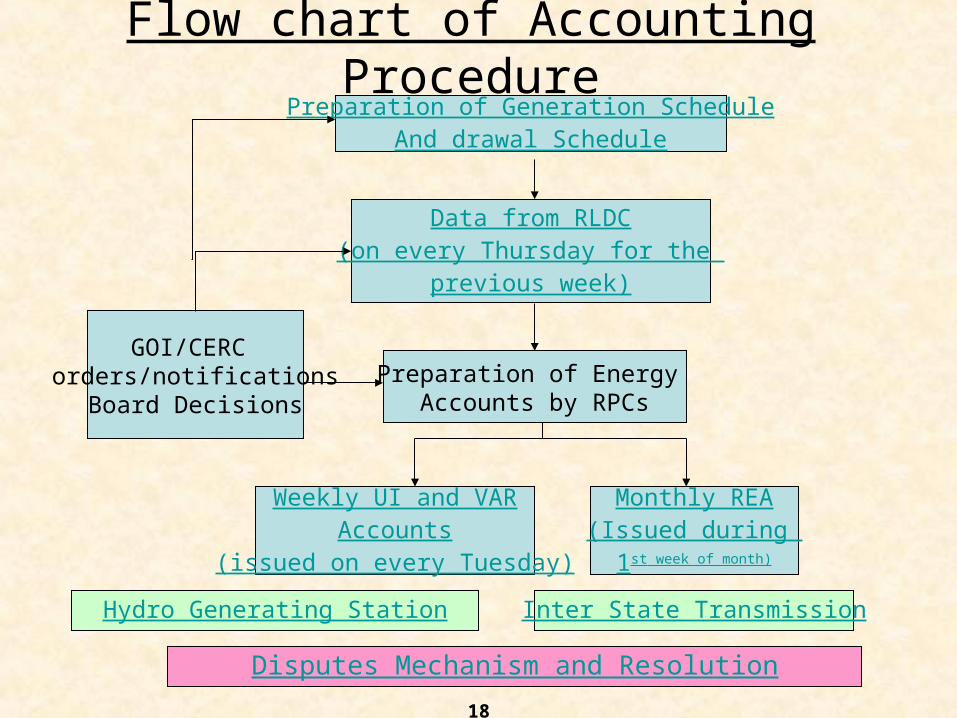
Flow chart of Accounting Procedure
Data from RLDC(on every Thursday for the
previous week)
Preparation of Energy Accounts by RPCs
Weekly UI and VARAccounts
(issued on every Tuesday)
Monthly REA(Issued during
1st week of month)
GOI/CERC orders/notifications
Board Decisions
Preparation of Generation ScheduleAnd drawal Schedule
Disputes Mechanism and Resolution
Hydro Generating Station Inter State Transmission

19
Preparing final schedule
12 1 2 3 4 5 6 7 8 9 10 11 12 1 2 3 4 5 6 7 8 9 10 11 12 1noon
ISGS
SLDC
Despatch schedule
net Drawal
schedule
revision
revisionstation-wise MW/MWH capability
station-wise W/MWH entitlement
required Drawal
schedule
AM PM
RLDC
Despatch schedule starts
Drawalschedule starts
finalDespatch schedule
final Drawal
schedule
BACKBACK

20
Data Required for Preparing these accounts – to be furnished by RLDC
• Declared Capability (DC) and Dispatch/generation Schedule (GS) – Annexure 1A
• Entitlement of various beneficiaries – Annexure 1B• Requisition by various beneficiaries – Annexure 1C• Any bilateral Trading under STOAC – Bilateral Files• Wheeling to/from other regions – • Processed Meter (SEM) data – 15 min block wise
actual injection/drawal at various locations and reactive drawal/injection for a day –
SEM FilesBACKBACK
21
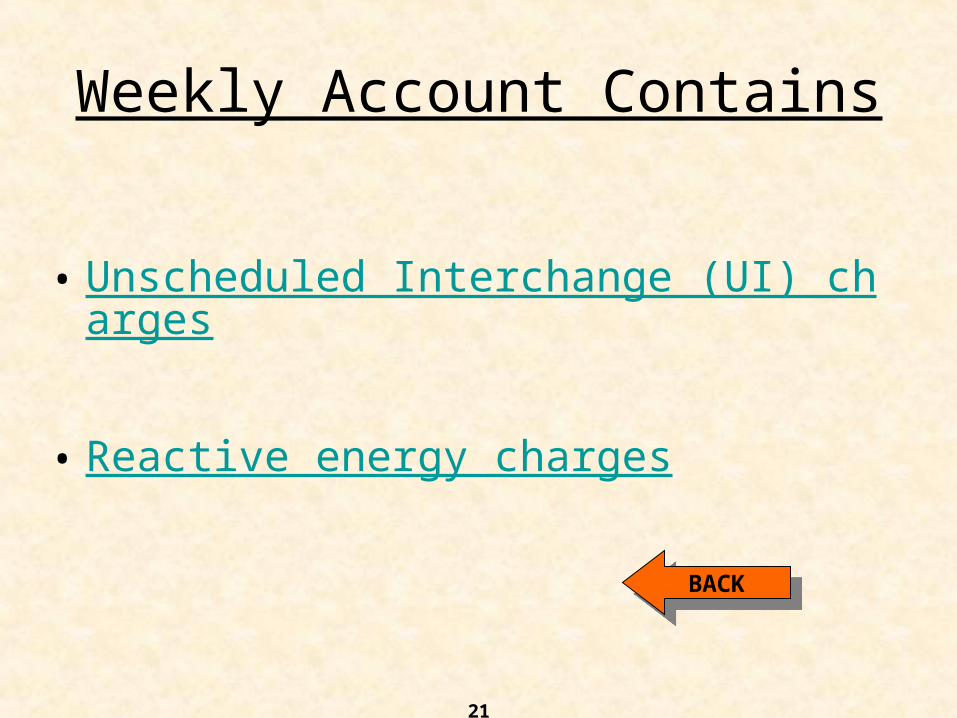
Weekly Account Contains
• Unscheduled Interchange (UI) charges
• Reactive energy charges
BACKBACK

22
Monthly REA Contains
(a) Availability % for Capacity Charge recovery(b) Energy Scheduled for Energy Charges(c) Energy scheduled beyond target PLF for Incentive(d) Ratio for sharing of monthly Transmission Charge
s of CTU(e) Ratio for sharing of monthly RLDC fees and O&M
charges(f) Wheeling Charges for ISGS Power wheeled on sta
te owned inter state lines.(g) Energy Exchanged with other Regions(h) Energy scheduled under STOA
BACKBACK

23
Unscheduled Interchange (UI) charges
• For Generators
- UI = Actual Generation – Generation Schedule
• For Beneficiaries
- UI = Actual Drawal – Ex-Periphery drawal Schedule
• For Other Regions
- UI = Actual Metered energy – Net Schedule at Interregional Periphery

24
For the day: 0000 hrs. to 2400 hrs. Central Generating Stations
1 2 3
Ex-Bus Declared Capability x1 x2 x3(Forecast) ____ ____ ___
SEB-A’s share a1 a2 a3SEB-B’s share b1 b2 b3SEB-C’s share c1 c2 c3
For a particular 15 minute time block
SEB-A’s requisition a’1 a’2 a’3SEB-B’s requisition b’1 b’2 b’3SEB-C’s requisition c’1 c’2 c’3
___ ___ ___CGS’s schedule x1’ x2’ x3’
MW
Sample UI Calculation
25
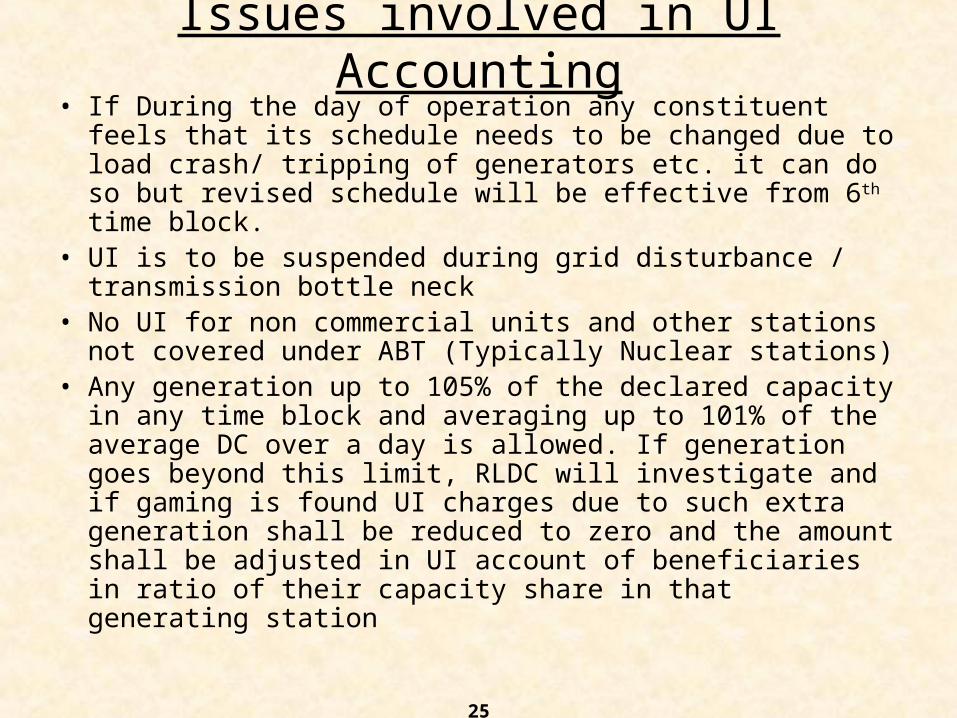
Issues involved in UI Accounting• If During the day of operation any constituent feels that
its schedule needs to be changed due to load crash/ tripping of generators etc. it can do so but revised schedule will be effective from 6th time block.
• UI is to be suspended during grid disturbance / transmission bottle neck
• No UI for non commercial units and other stations not covered under ABT (Typically Nuclear stations)
• Any generation up to 105% of the declared capacity in any time block and averaging up to 101% of the average DC over a day is allowed. If generation goes beyond this limit, RLDC will investigate and if gaming is found UI charges due to such extra generation shall be reduced to zero and the amount shall be adjusted in UI account of beneficiaries in ratio of their capacity share in that generating station
26
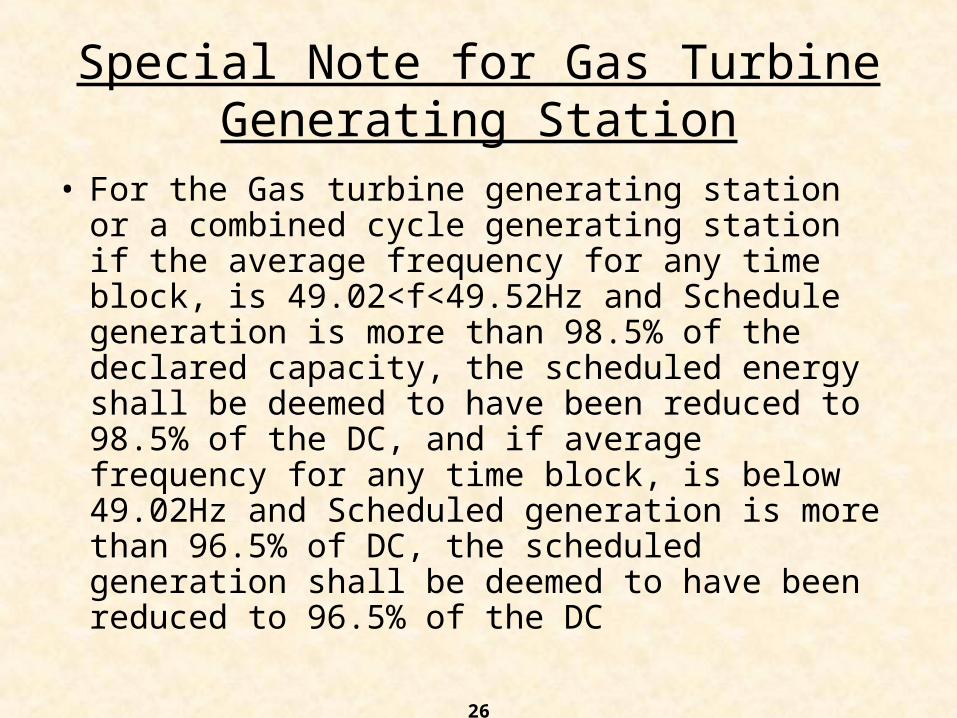
Special Note for Gas Turbine Generating Station
• For the Gas turbine generating station or a combined cycle generating station if the average frequency for any time block, is 49.02<f<49.52Hz and Schedule generation is more than 98.5% of the declared capacity, the scheduled energy shall be deemed to have been reduced to 98.5% of the DC, and if average frequency for any time block, is below 49.02Hz and Scheduled generation is more than 96.5% of DC, the scheduled generation shall be deemed to have been reduced to 96.5% of the DC

27
For the day: 0000 hrs. to 2400 hrs. Central Generating Stations
1 2 3
Ex-Bus Declared Capability x1 x2 x3(Forecast) ____ ____ ___
SEB-A’s share a1 a2 a3SEB-B’s share b1 b2 b3SEB-C’s share c1 c2 c3
For a particular 15 minute time block
SEB-A’s requisition a’1 a’2’ a’3SEB-B’s requisition b’1 b’2’ b’3SEB-C’s requisition c’1 c’2’ c’3
___ ___ ___CGS’s schedule x1’ x2’’ x3’
MW
Revised Schedules

28
Actual (metered) injection of CGS-1 in the time block = X1 MWh.
Excess injection = (X1 – x1’ ) MWh.
4
Amount payable to CGS-1 for this =(X1-x1’) X UI rate for the block.
4
SEB-A’s scheduled drawl for time block = a’1+a’2’+a’3 = a’ MW (ex-ISGS Bus)
SEB-A’s NET drawal schedule = (a’ – Notional Transm. Loss) MW
= (a’ – Notional Transm. Loss) = A’ MWH
4
Actual (metered) net drawal of SEB-A during time block = A MWH
Excess drawal by SEB-A = (A-A’) MWh.
Amount payable by SEB-A for this = (A-A’) * UI rate for the block.
All above payments for deviations from schedules to be routed through a pool A/C operated by RLDC
SAMPLE UI ACCOUNT STATEMENT

29
Variations in actual generation/drawal and scheduled generation /drawal are accounted through UI. This is a frequency linked charge which is worked out for each 15 minute time block.
Charges for all UI transaction, based on average frequency have following rate of paise per KWh from
Unscheduled Interchanges (UI)

30
UI rate in effect UI rate (Paise per KWh)
Average Frequency of time block50.5 Hz. and above 0At 49.82 Hz 280Between 50.5 Hz and 49.80 Hz 8 P/ 0.02 HzAt 49.80 Hz 298Between 49.80 Hz and 49.00 Hz 18 P/ 0.02 HzAt 49.00 Hz and less then 1000
ISG Stations capped at 406 P

31
1000 18 P/Unit/0.02Hz280
049 49.8 50.5
8 P
32
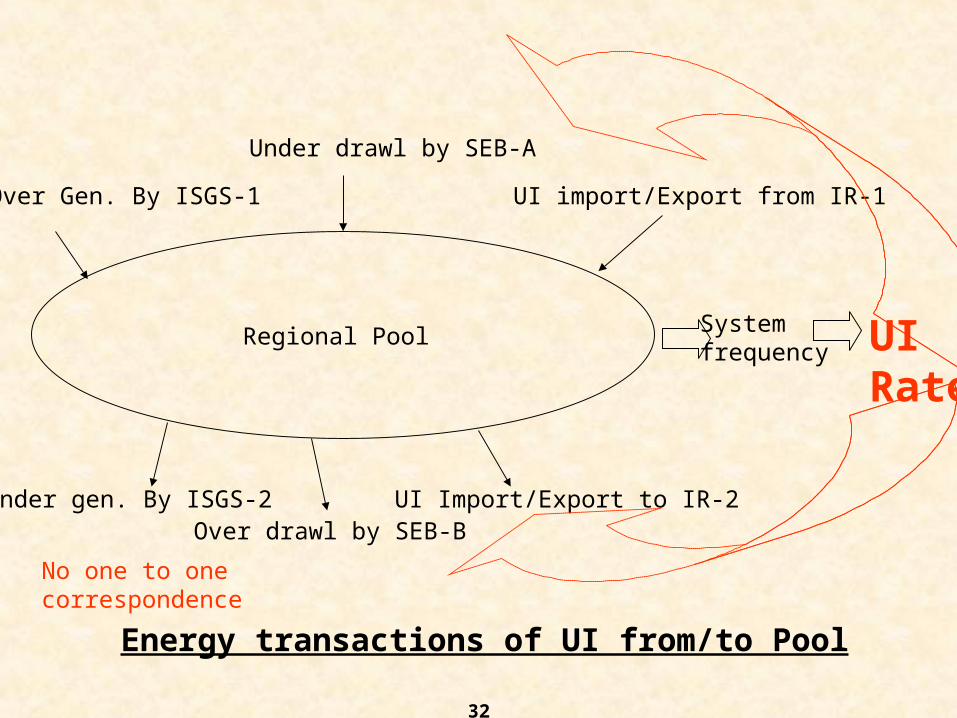
Energy transactions of UI from/to Pool
Over Gen. By ISGS-1
Under drawl by SEB-A
UI import/Export from IR-1
Under gen. By ISGS-2
No one to one correspondence
System frequency UI
RateRegional Pool
Over drawl by SEB-BUI Import/Export to IR-2
33
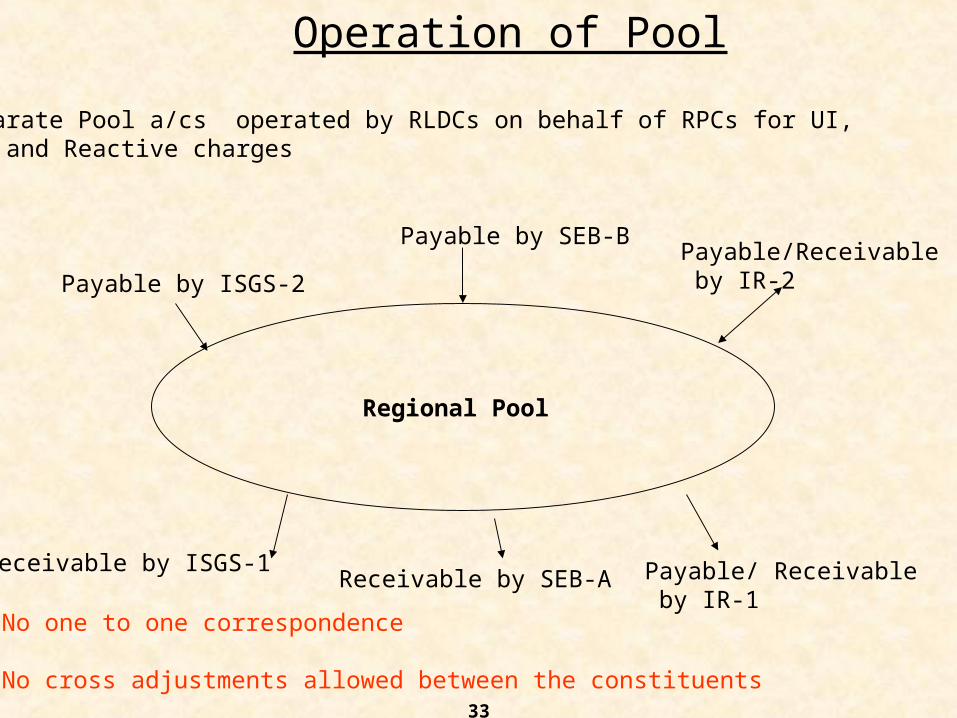
Operation of Pool
Separate Pool a/cs operated by RLDCs on behalf of RPCs for UI, IRE and Reactive charges
Regional Pool
Payable by ISGS-2
Payable by SEB-BPayable/Receivable by IR-2
Receivable by ISGS-1Receivable by SEB-A Payable/ Receivable
by IR-1No one to one correspondence
No cross adjustments allowed between the constituents
34
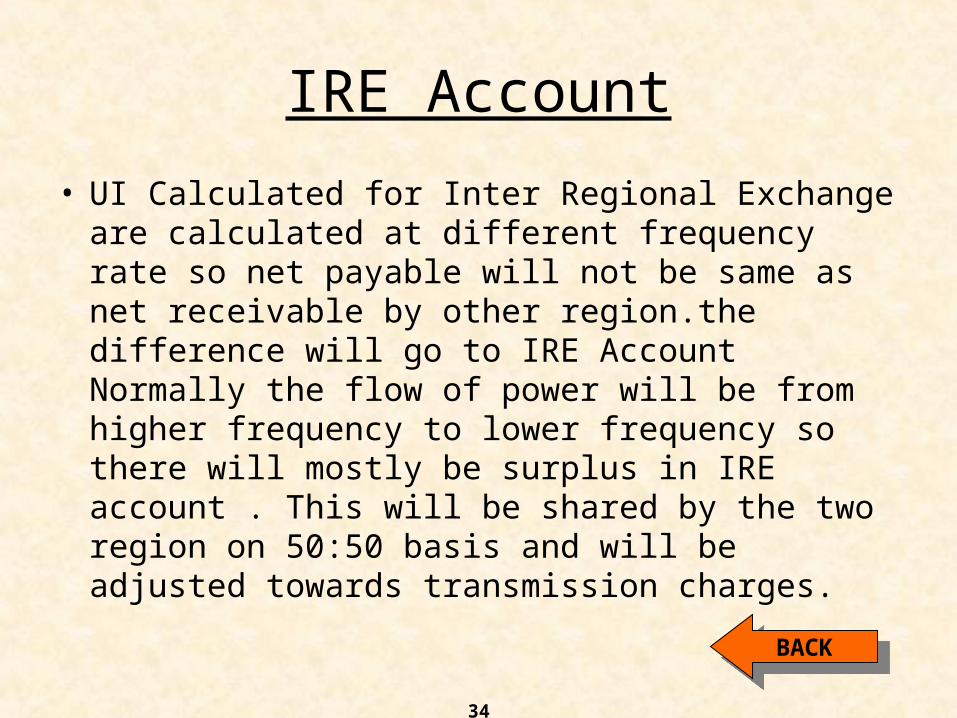
IRE Account
• UI Calculated for Inter Regional Exchange are calculated at different frequency rate so net payable will not be same as net receivable by other region.the difference will go to IRE Account Normally the flow of power will be from higher frequency to lower frequency so there will mostly be surplus in IRE account . This will be shared by the two region on 50:50 basis and will be adjusted towards transmission charges.
BACKBACK

35
REACTIVE ENERGY CHARGE :
PAYABLE FOR :
1. VAR DRAWALS AT VOLTAGES BELOW 97%2. VAR INJECTION AT VOLTAGES ABOVE 103%
RECEIVABLE FOR:
1. VAR INJECTION AT VOLTAGES BELOW 97%2. VAR DRAWAL AT VOLTAGES ABOVE 103%
APPLIED FOR VAR EXCHANGES BETWEEN :
A) BENEFICIARY SYSTEM AND ISTS- THROUGH A POOL ACCOUNT
B) TWO BENEFICIARY SYSTEMS ON INTER-STATE TIES- BY THEMSELVES
Basic Rate : 5 paise/kvArh ( for the year 2006-09 ) 0.25 Paisa ESCALATION PER YEAR
SAMPLE VAR ACCOUNT STATEMENT

36
Issues in Reactive Energy charges
• Deficit in pool (SR & ER)-due to continuous High voltages in SR
• Surplus in Pool (NR &WR)
Utilization of Accruals
Disputes in payments between Beneficiaries for Reactive charges in Inter-state Lines
BACKBACK
37
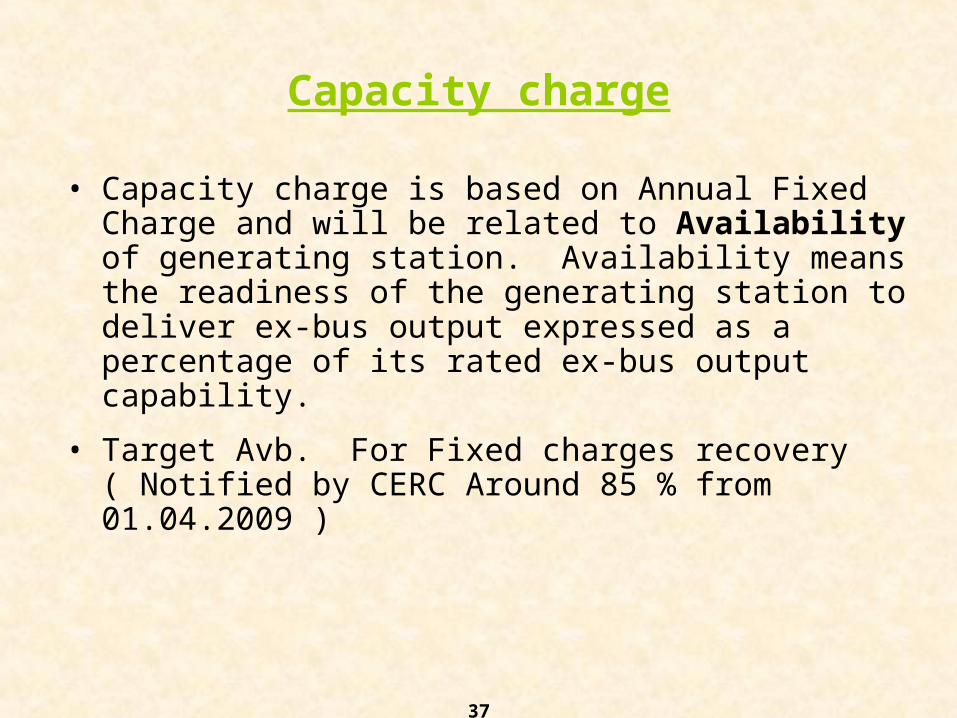
Capacity charge
• Capacity charge is based on Annual Fixed Charge and will be related to Availability of generating station. Availability means the readiness of the generating station to deliver ex-bus output expressed as a percentage of its rated ex-bus output capability.
• Target Avb. For Fixed charges recovery ( Notified by CERC Around 85 % from 01.04.2009 )

38
Calculation Of Availability
% Availability =i=1
N
DCi/ {NxICx(100-Auxn) }%10000
Where DCi = Average Declared Capacity for i th day of the period in MW N = Total no. of days during the period Auxn = Normative Auxiliary Consumption as % of gross Gen.
IC= installed capacity in MW
% Availability forms the basis for calculations

Capacity Charges for Thermal
• Inclusive of Incentive
• GS < 10 years of COD
= AFC x ( NDM/NDY) x ( 0.5 +0.5 x (PAFM/NAPAF) (in Rupees)
• GS > 10 years of COD
= AFC x ( NDM/NDY) x (PAFM/NAPAF) (in Rupees)AFC = Annual FC
NAPAF= Normative Annual Plant Availability Factor
NDM= Number of days in a month
NDY= Number of days in a year
PAFM= PAF achieved for the month
PAFY= PAF acheived for the year
39

40
Monthly Capacity charges receivable by an ISGS: (Not there from 01.04.2009)1 st Month = (1xACC1)/122 nd Month = (2xACC2-1ACC1)/12….….12 th month = (12xACC12-11ACC11)/12where ACC1,ACC2…….ACC12 = Annual capacity charges corresponding to the cum. Availability up to the corresponding month.
Monthly Capacity charges payable by a beneficiary :1 st Month = (1xACC1xWB1)/122 nd Month = (2xACC2xWB2-1ACC1xWB1)/12….….12 th month = (12xACC12xWB12-11xACC11xWB11)/12where WB1,WB2…..WB12 = Weighted average % share up to the corresponding month.
BACKBACKExtract from SR REA

41
Energy charge:Energy charge is related to the scheduled ex-bus energy to be sent out from the generating station and will be worked out on the basis of paise per KWh.
The Energy Charges Payable by beneficiary to the ISGS = Variable Charge of ISGS X
Ex – Power Plant Schedule
The Energy Charges Receivable by ISGS from beneficiaries = Variable Charge of ISGS X
Despatch schedule of ISGS
BACKBACKExtract from SR REA

42
• From 01.04.2009 Incentive recovered in Fixed charges
• Flat rate of 25ps/u
• For ex-bus Schedule Energy in Excess of ex-bus energy corresponding to Target PLF
Incentive for ISGS
PLF = 10000
i=1
N
SGi/ {NxICx(100-Auxn) }%
BACKBACK

43
Ratio for sharing of monthly Transmission Charges of CTU
• Monthly Weighted average entitlement % from all ISGS in the region and other regions
BACKBACK
Extract from REA

44
Ratio for sharing of monthly RLDC fees and O&M charges
• Monthly Weighted average entitlement % from all ISGS in the region
BACKBACK
Extract from REA
45
Wheeling Charges for ISGS Power wheeled on state owned inter state lines.
BACKBACK
Extract from REA

46
Energy Exchanged with other Regions• As furnished by RLDC
BACKBACK
Extract from REA
47
HYDRO POWER GENERATING STATIONS

48
CAPACITY INDEX
Daily Capacity Index = Declared Capacity(MW)
Maximum Available Capacity(MW)
Monthly Capacity Index
= (Average of Daily Capacity Index)
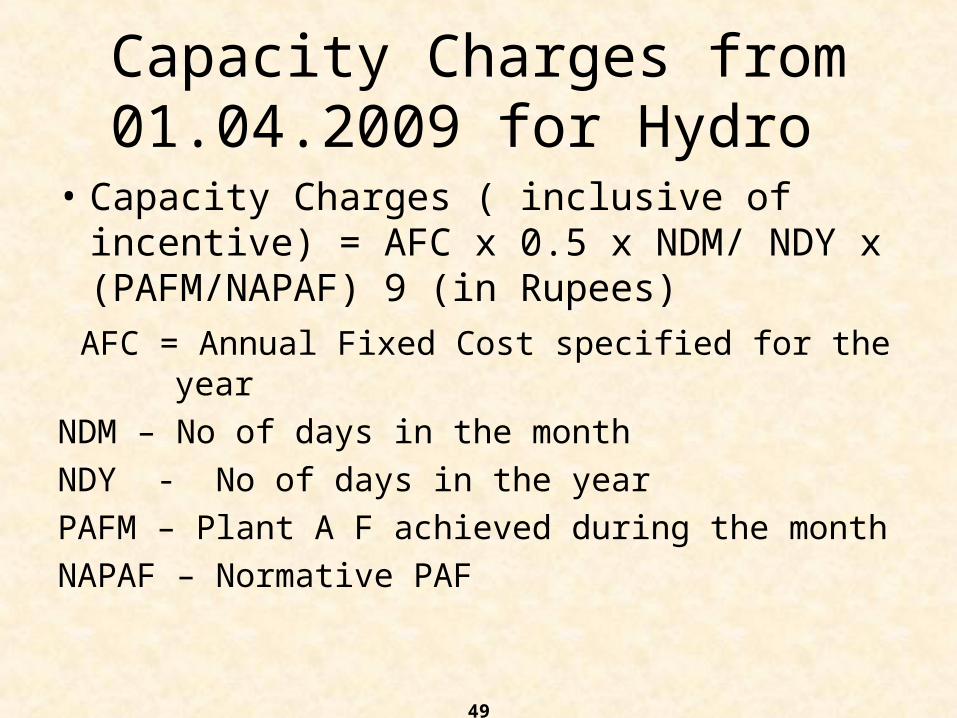
Capacity Charges from 01.04.2009 for Hydro
• Capacity Charges ( inclusive of incentive) = AFC x 0.5 x NDM/ NDY x (PAFM/NAPAF) 9 (in Rupees)
AFC = Annual Fixed Cost specified for the year
NDM – No of days in the month
NDY - No of days in the year
PAFM – Plant A F achieved during the month
NAPAF – Normative PAF
49

50
• PAFM=10000 *
• AUX – Normative Aux. Cons.
• DCi - Declared Capacity for the ith day of the month (atleast 3 hours) certified by nodal LDC
• IC - Installed Capacity in MW
• N - No of days in a month
PAFM for HYDRO
i=1
N
DCi/ {NxICx(100-Aux) }%
BACKBACK

51
NORMATIVE CAPACITY INDEX FOR RECOVERY OF FULL CAPACITY
CHARGES• During 1st Year of Commercial Operation
Run-of-river 85%
Storage Type 80%
• After 1st Year of Commercial Operation
Run-of-river 90%
Storage Type 85%
From 01.04.2009 Norms are revised

52
COMPUTATION OF ANNUAL CHARGES
• TWO PART TARIFF– Annual Capacity Charge based on
Capacity Index
– Primary Energy Charge based on Scheduled Energy
53
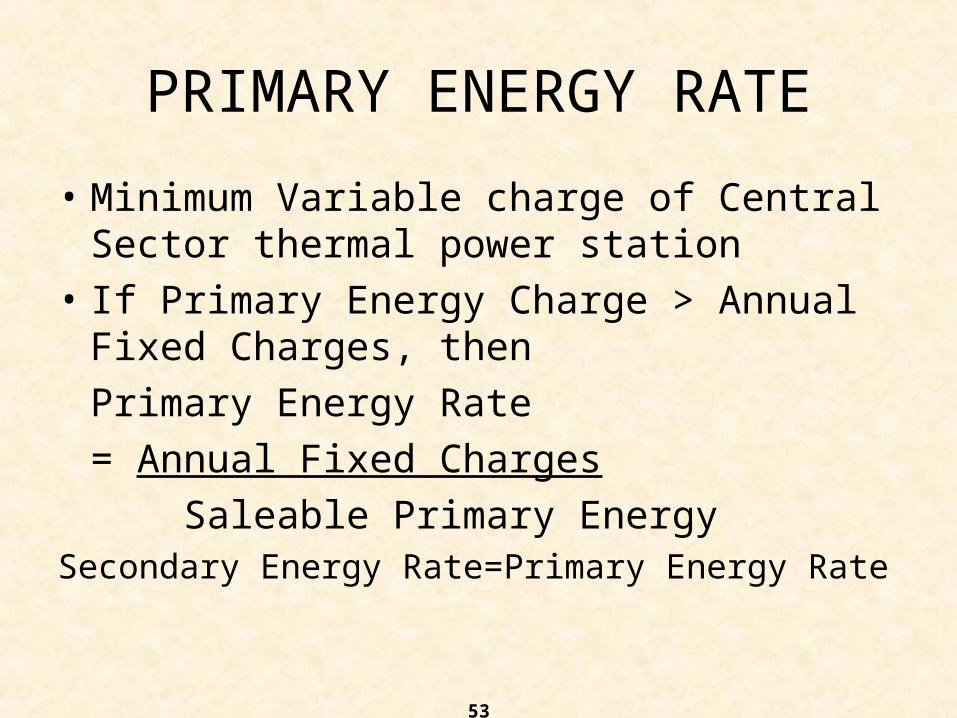
PRIMARY ENERGY RATE
• Minimum Variable charge of Central Sector thermal power station
• If Primary Energy Charge > Annual Fixed Charges, then
Primary Energy Rate
= Annual Fixed Charges
Saleable Primary EnergySecondary Energy Rate=Primary Energy Rate

Energy Charges for Hydro from 01.04.2009
• EC=(Engy chg rate (ECR) in Rs/KWH *Sch. Engy)*(100-FEHS)/100
ECR = AFC*0.5*10/(DE*(100-AUX)*(100-FEHS)
DE - Annual Design Energy in MU
FEHS – Free Energy for Home State
54

55
INCENTIVE
= 0.65 x Annual Fixed Charges (CIA-CIN)/100
CIA = Capacity Index Achieved
CIN = Normative Capacity Index
From 01.04.2009 incentive included in the Capacity Charges
BACKBACK

56
INTER STATE TRANSMISSION

57
TARGET AVAILABILTY• Target Availability for recovery of full
transmission charges
AC system 98%
DC system 95%
(HVDC Bi-pole links and HVDC back- back stations)

58
TARGET AVAILABILTY From 01.04.2009
• Normative Annual Transmission System Availability Factor (NATAF)
AC system 98%
HVDC Bi Pole 92%
HVDC B2B 95%
59
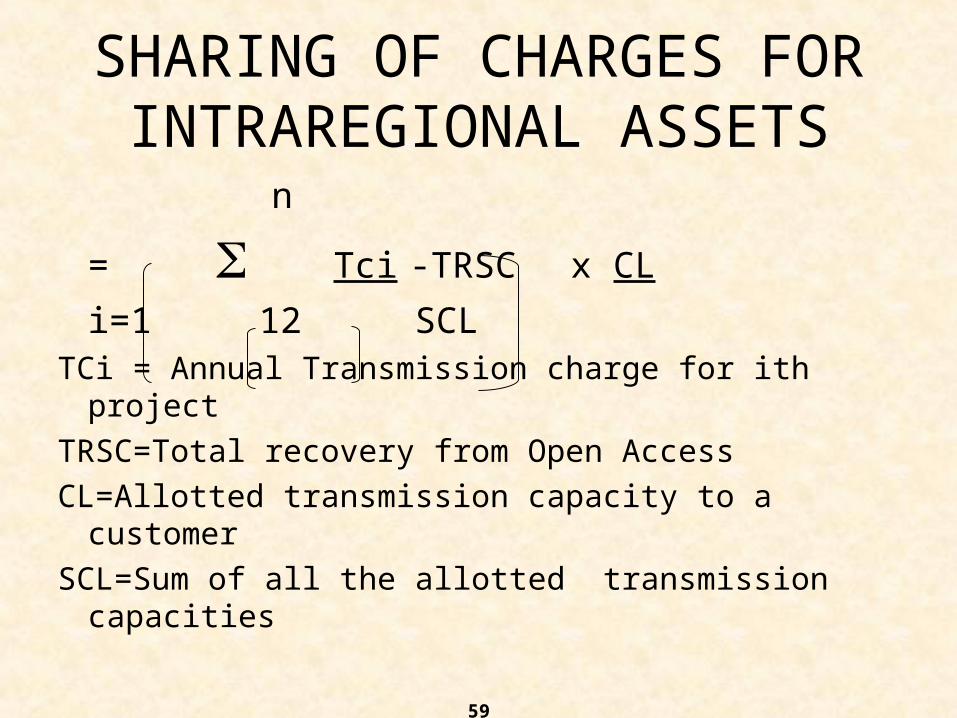
SHARING OF CHARGES FOR INTRAREGIONAL ASSETS
n
= Tci -TRSC x CL
i=1 12 SCLTCi = Annual Transmission charge for ith project
TRSC=Total recovery from Open Access
CL=Allotted transmission capacity to a customer
SCL=Sum of all the allotted transmission capacities

60
SHARING OF CHARGES FOR INERREGIONAL ASSETS
= 0.5x TCj -RSCj x CL
12 SCLTCj = Annual Transmission charge for jth
interregional assetRSCj=Total recovery from Open Access CL=Allotted transmission capacity to a customerSCL=Sum of all the allotted transmission
capacities

61
INCENTIVE
= Equity x (Annual Availability-Target Availability)/100
BACKBACK
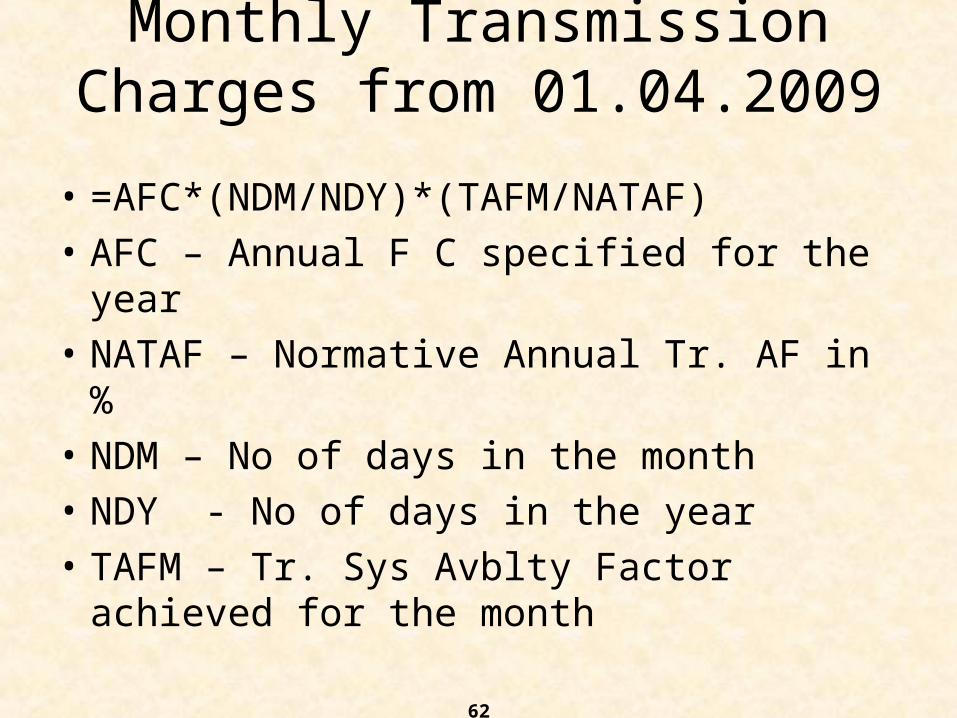
Monthly Transmission Charges from 01.04.2009
• =AFC*(NDM/NDY)*(TAFM/NATAF)
• AFC – Annual F C specified for the year
• NATAF – Normative Annual Tr. AF in %
• NDM – No of days in the month
• NDY - No of days in the year
• TAFM – Tr. Sys Avblty Factor achieved for the month
62
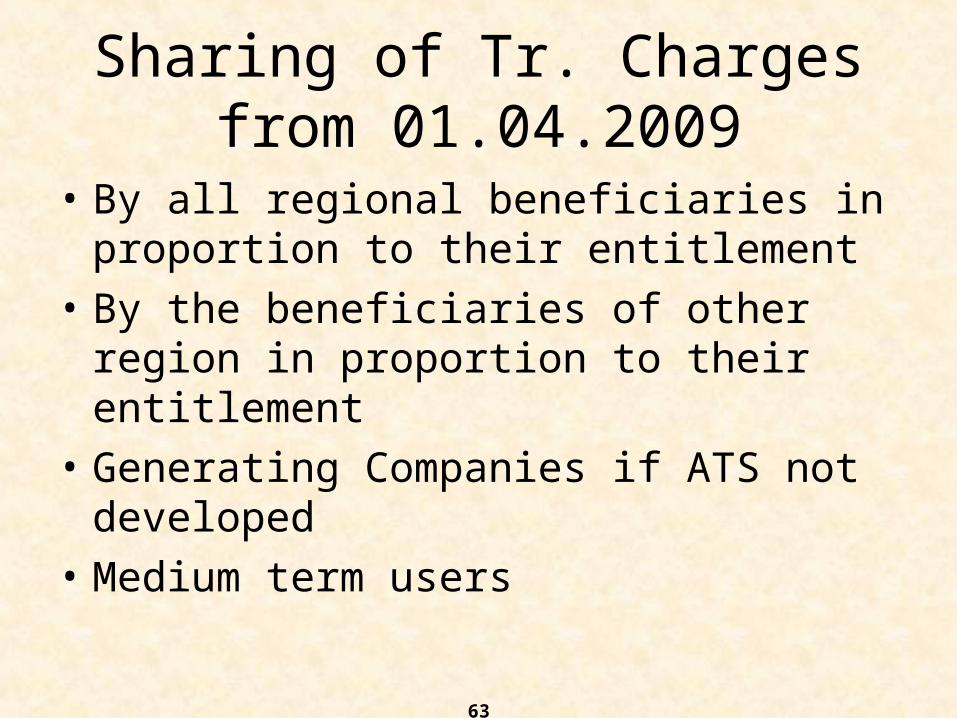
Sharing of Tr. Charges from 01.04.2009
• By all regional beneficiaries in proportion to their entitlement
• By the beneficiaries of other region in proportion to their entitlement
• Generating Companies if ATS not developed
• Medium term users
63

Sharing of Inter Regional Link Charges from 01.04.2009
• ER – NR by NR beneficiaries
• ER-WR by WR beneficiearies
• ER-SR by SR beneficiaries
• NR-WR and WR-SR 50:50
64

New Regulations from 01.04.2009
• ATS not to be pooled would shared by the concerned beneficiaries
• 400/220 KV step down ICTs and down stream systems by the beneficiary only(DOC after 28.03.2008)
• For MW Benificiary not identified Tr. Charges to be borne by the concerned gen station.
65
66
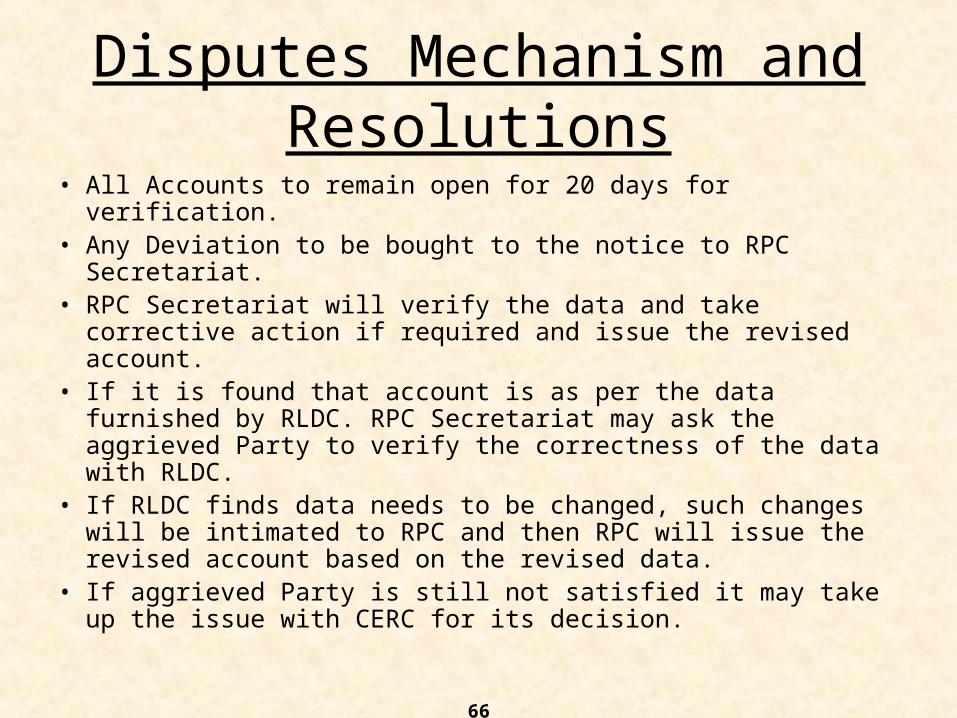
Disputes Mechanism and Resolutions
• All Accounts to remain open for 20 days for verification.• Any Deviation to be bought to the notice to RPC
Secretariat.• RPC Secretariat will verify the data and take corrective
action if required and issue the revised account.• If it is found that account is as per the data furnished by
RLDC. RPC Secretariat may ask the aggrieved Party to verify the correctness of the data with RLDC.
• If RLDC finds data needs to be changed, such changes will be intimated to RPC and then RPC will issue the revised account based on the revised data.
• If aggrieved Party is still not satisfied it may take up the issue with CERC for its decision.

Rebate and Late Payment Surcharges
• 2% Rebate for payment of bills through LC
• 1% Rebate for payment made within one month
• Late Payment 1.25% per month for delayed payment beyond a period of 60 days
67

68


