17
1 REW.ca Real Estate Consumer Survey Q4 2011
| Date post: | 15-Dec-2015 |
| Category: |
Documents |
| Upload: | tariq-hinman |
| View: | 216 times |
| Download: | 0 times |
1
REW.ca Real Estate Consumer Survey
Q4 2011
Real Estate Consumer Survey Q4 2011
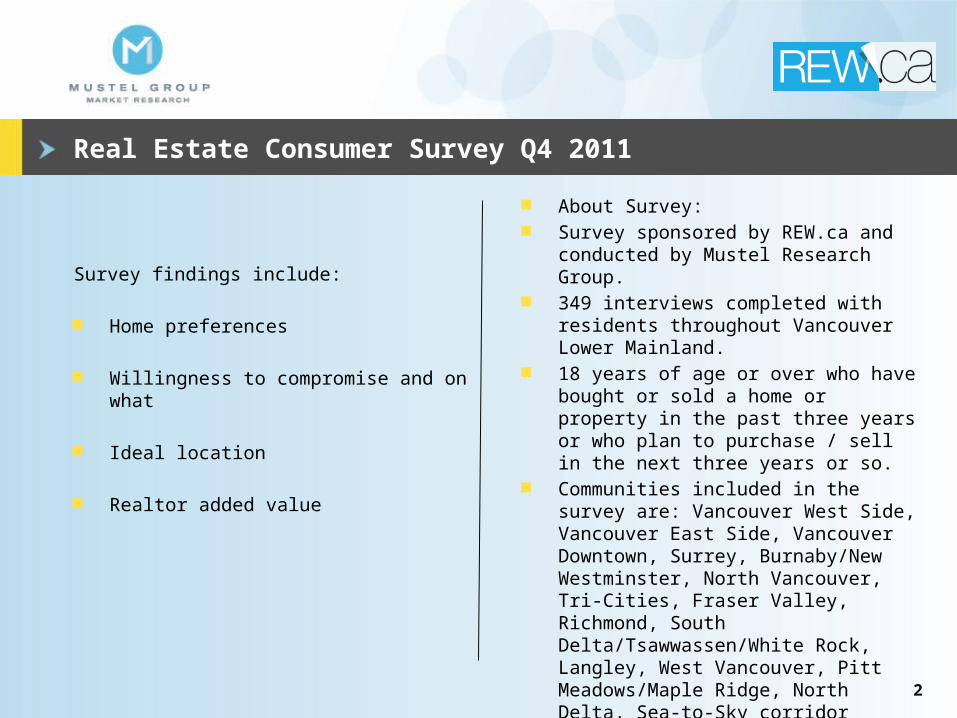
Survey findings include:
Home preferences
Willingness to compromise and on what
Ideal location
Realtor added value
2
About Survey: Survey sponsored by REW.ca and
conducted by Mustel Research Group. 349 interviews completed with
residents throughout Vancouver Lower Mainland.
18 years of age or over who have bought or sold a home or property in the past three years or who plan to purchase / sell in the next three years or so.
Communities included in the survey are: Vancouver West Side, Vancouver East Side, Vancouver Downtown, Surrey, Burnaby/New Westminster, North Vancouver, Tri-Cities, Fraser Valley, Richmond, South Delta/Tsawwassen/White Rock, Langley, West Vancouver, Pitt Meadows/Maple Ridge, North Delta, Sea-to-Sky corridor (including Squamish, Whistler, Pemberton), and Bowen Island.

3
Home Preferences&
Compromises

Ideal Location
4
Total(349)
%
Past Buyers/Sellers
(94)%
Future Buyers/Sellers
(299)%
Vancouver 33 42 32 West side 18 32 16 Downtown 7 6 7 East side 7 3 8Burnaby/New West 9 6 10South Delta/Tsawassen/White Rock
9 10 9
North Vancouver 9 7 9Fraser Valley 8 5 8Langley 7 3 8Tri-Cities 5 4 4West Vancouver 4 5 3Surrey 4 4 3Vancouver Island/Sunshine Coast
3 2 3
Interior 2 2 3Richmond 2 3 2Pitt Meadows/Maple Ridge 1 1 1Out of Province 1 - 1North Delta <1 1 -
Q.4) What would be your ideal location if you could afford it?

Ideal Location by Area of Residence
5
Area of Residence
Vancouver (n=109)
%
North Shore (n=42)
%
Burnaby/New
Westminster (n=36)
%
Tri-Cities/Maple
Ridge/ Pitt Meadows (n=35)
%
Richmond/ South Delta/
Tsawwassen/White
Rock (n=43)
%
Surrey/North Delta/
Langley (n=59)
%
Chilliwack/ Abbotsford
(n=25)%
Stay in current municipality/area
82 81 56 52 68 59 60
Move to City of Vancouver
n/a 7 11 11 21 7 8
Move to other area 18 12 33 37 11 34 32
Q.4) What would be your ideal location if you could afford it? Breakdown of answers by current area of residence.

Most Important Factors in Selecting Neighbourhood
6
Total(349)
%
Past Buyers/Selle
rs(79)%
Future Buyers/Seller
s(276)
%Close to amenities such as shops, grocery stores, medical facilities
41 41 44
Close to family/friends 33 32 32Close to work/lessened commute time 22 20 22Close to parks and green space 15 17 15Close to public transit 19 15 19Lessened or no need to use vehicle (can walk or cycle)
13 14 13
Safety/less crime 16 13 16Quality of schools 8 13 6Close to water (streams, rivers, lakes, ocean)
15 10 17
Close to schools 4 6 3Close to recreation facilities 3 3 3Close to airport 1 -- 1Other 6 11 5Q.7a) Apart from affordability, what were the 2 most important factors in selecting your neighbourhood
location? Q7b) Apart from affordability, what are the 2 most important factors in selecting your neighbourhood location?

7
Type of Home Preferred
Detached rancher, one level
Detached two level
Detached three level with basement
Duplex/multiplex
Townhouse
Condo
Base: Past buyers/sellers (n=79) Future buyers/sellers (n=276)
Q.3a) What type of home did you purchase?Q.3b) If buying in the future, what type of home are you looking for?
Past Buyers/SellersPurchased
Future Buyers/SellersWant to Purchase
10%
15%
18%
3%
23%
32%
20%
22%
11%
2%
19%
26%
53%
8
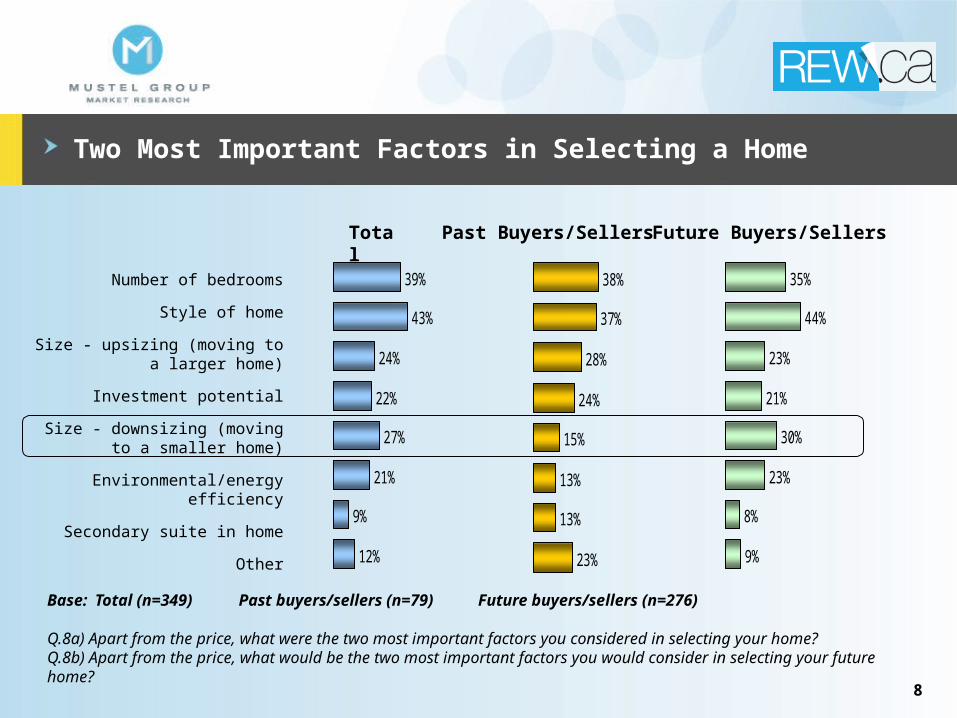
Two Most Important Factors in Selecting a Home
Number of bedrooms
Style of home
Size - upsizing (moving to a larger home)
Investment potential
Size - downsizing (moving to a smaller home)
Environmental/energy efficiency
Secondary suite in home
Other
Past Buyers/Sellers Future Buyers/SellersTotal
39%
43%
24%
22%
27%
21%
9%
12%
38%
37%
28%
24%
15%
13%
13%
23%
35%
44%
23%
21%
30%
23%
8%
9%
Base: Total (n=349) Past buyers/sellers (n=79) Future buyers/sellers (n=276)
Q.8a) Apart from the price, what were the two most important factors you considered in selecting your home?Q.8b) Apart from the price, what would be the two most important factors you would consider in selecting your future home?

9
Maximum Commuting Time Would Accept
Past Buyers/SellersFuture Buyers/SellersTotal
Under 10 minutes
10
15
20
21-29
30
35
40
45
50
60 plus
5%
7%
8%
18%
2%
25%
3%
4%
11%
2%
13%
6%
5%
6%
16%
3%
31%
1%
5%
15%
3%
7%
5%
7%
7%
18%
3%
27%
3%
4%
12%
2%
12%
Average = 30 min Average = 30 min Average = 30 min
Average by Age:
18-34 yrs = 39 min35-54 yrs = 31 min55 yrs + = 27 min
Base: Total (n=349) Past buyers/sellers (n=94) Future buyers/sellers (n=299)
Q.5) What is the maximum commuting time you would be prepared to accept to work, school
or another destination that you travel to regularly?

10
Compromises in Order to Afford Home
Past Buyers/Sellers Future Buyers/Sellers
Size of home
Distance from work
Condition of home
Lot size/size of yard
Distance from friends/family
Quality of schools
Distance from schools
Other
Did not/would not make any compromises
37%
32%
30%
22%
22%
1%
9%
15%
--
44%
24%
25%
43%
30%
23%
26%
2%
16%
Base: Past buyers/sellers (n=79) Future buyers/sellers (n=276)
Q.9a) What characteristics of your home or neighbourhood did you compromise in order to afford your home? Q.9b) What characteristics of your home or neighbourhood would you compromise in order to afford your future home?

11
Other Survey Highlights

12
Greatest Value Received From Realtor
Past Buyers/Sellers
Future Buyers/Sellers
Total
Help with paperwork/contracts
Placing/negotiating offers
Marketing/listing your current home
Help to identify homes best suited to your needs
Arrange open houses
Help to determine neighbourhood and communities
Other
34%
22%
18%
15%
3%
2%
4%
32%
22%
20%
10%
9%
2%
5%
34%
22%
19%
16%
2%
2%
4%
Base: Total (n=349) Past buyers/sellers (n=94) Future buyers/sellers (n=299)
Q.12) What do you think is the greatest value you receive from a Realtor?

13
Used/Currently Using Realtor
Base: Past buyers/sellers (n=79) Future buyers/sellers (n=276)
Q.11a) Did you use a Realtor to buy or sell your home?Q.11b) Are you currently using a Realtor?
Past Buyers/Sellers Future Buyers/Sellers
Yes94%
No6%
Yes35%
No65%
14
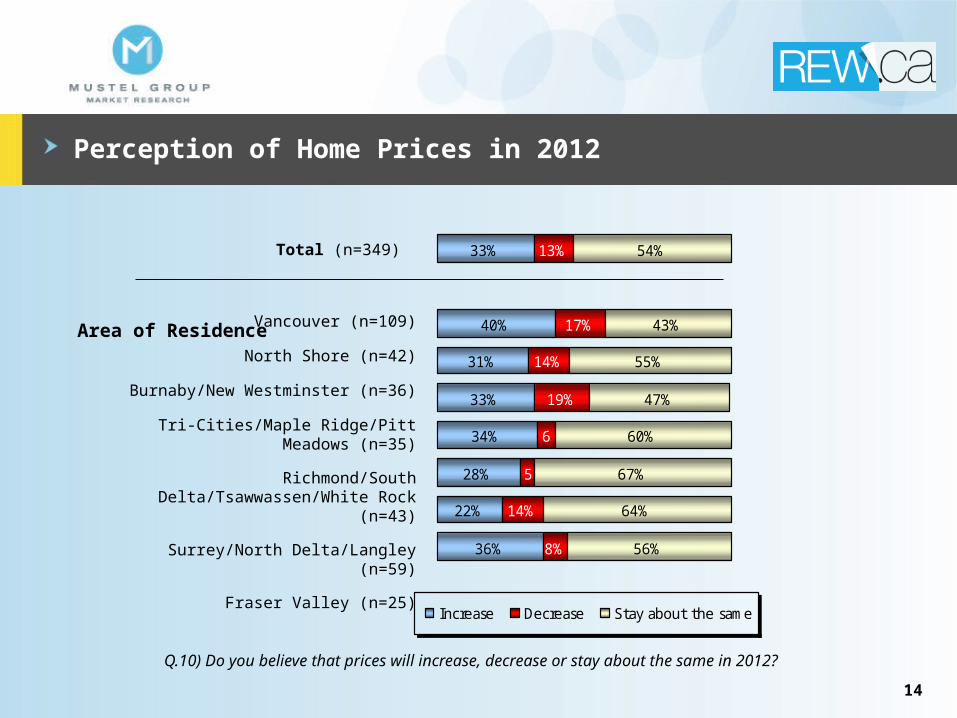
Perception of Home Prices in 2012
Total (n=349)
Q.10) Do you believe that prices will increase, decrease or stay about the same in 2012?
33%
40%
31%
33%
34%
28%
22%
36%
13%
17%
14%
19%
14%
8%
54%
43%
55%
47%
60%
67%
64%
56%
5
6
Increase Decrease Stay about the same
Vancouver (n=109)
North Shore (n=42)
Burnaby/New Westminster (n=36)
Tri-Cities/Maple Ridge/Pitt Meadows (n=35)
Richmond/South Delta/Tsawwassen/White Rock (n=43)
Surrey/North Delta/Langley (n=59)
Fraser Valley (n=25)
Area of Residence

15
Questions??

Demographic Characteristics
Total(349)
%
Past Buyers/Seller
s(94)%
Future Buyers/Sellers
(299)%
GenderMale 49 54 48Female 51 46 52Age Category18-34 16 16 1635-54 39 43 3755+ 46 42 47Home TenureOwn 79 96 77Rent 21 4 23Annual Household IncomeLess than $40,000 10 9 11$40,000 to $59,999 13 11 14$60,000 to $79,999 15 10 16$80,000 to $99,999 14 15 14$100,000 to $120,000 14 16 13$120,000 or over 17 26 15Prefer not to say 17 15 17
continued
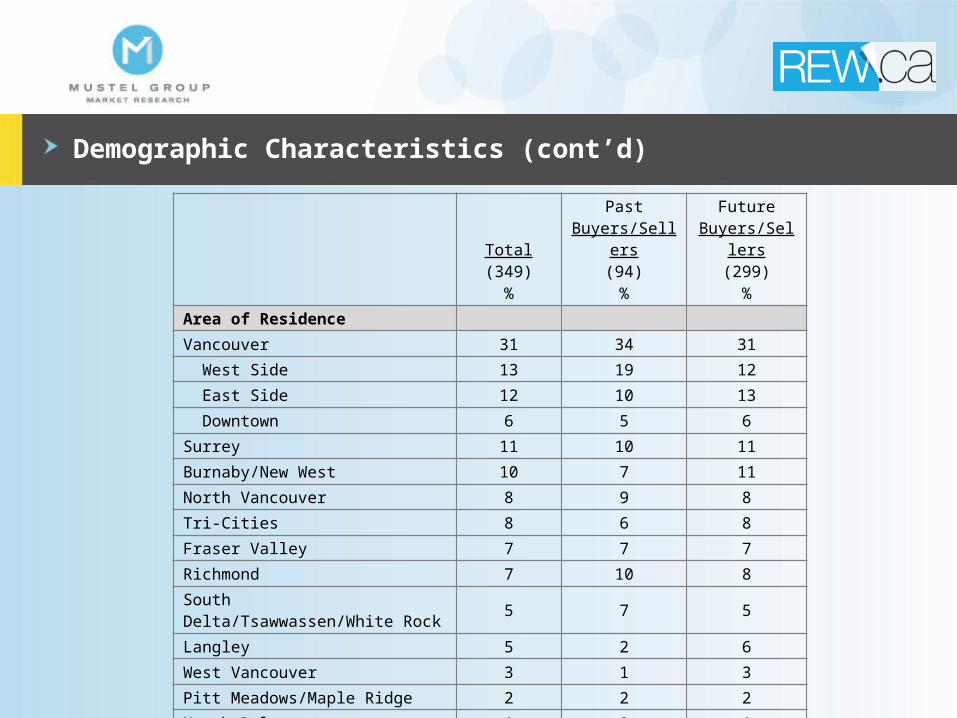
Demographic Characteristics (cont’d)
Total(349)
%
Past Buyers/Selle
rs(94)%
Future Buyers/Selle
rs(299)
%Area of ResidenceVancouver 31 34 31 West Side 13 19 12 East Side 12 10 13 Downtown 6 5 6Surrey 11 10 11Burnaby/New West 10 7 11North Vancouver 8 9 8Tri-Cities 8 6 8Fraser Valley 7 7 7Richmond 7 10 8South Delta/Tsawwassen/White Rock
5 7 5
Langley 5 2 6West Vancouver 3 1 3Pitt Meadows/Maple Ridge 2 2 2North Delta 1 2 1Sea-to-Sky corridor 1 1 <1Bowen Island 1 1 <1


![Insperity Business Confidence Survey: Q4 2014 [Infographic]](https://static.documents.pub/doc/80x56/55a700761a28abf75e8b4787/insperity-business-confidence-survey-q4-2014-infographic.jpg)


