Page 1
Copyright © 2006 Deputi KB dan KR, BKKBN, [email protected]
RH Commodity Needs and Indigenous Suppliers’ Practice in
IndonesiaDr. Siswanto Agus Wilopo, M.Sc., Sc.D.
Deputy for Family Planning and Reproductive HealthNational Family Planning Coordinating Board (BKKBN)
Indonesia
Page 2
Copyright © 2006 Deputi KB dan KR, BKKBN, [email protected]
Introduction
Page 3
Copyright © 2006 Deputi KB dan KR, BKKBN, [email protected]
Demographic Indicators (2006)
Population : 220 MillionRank 4 in the worldPop. Density: 112/km2
CBR :22CDR: 10Pop. Growth 1.48%Life Expectancy: 66 TFR: 2.4MMR 307 per 100.000 birthIMR 35Level of Urbanization: 46%
Page 4
Copyright © 2006 Deputi KB dan KR, BKKBN, [email protected]
Introduction
• a significant momentum of growth• entering a window opportunity • FP integral part of national policy• decentralization and reform• the economic crisis in the 1997
Page 5
Copyright © 2006 Deputi KB dan KR, BKKBN, [email protected]
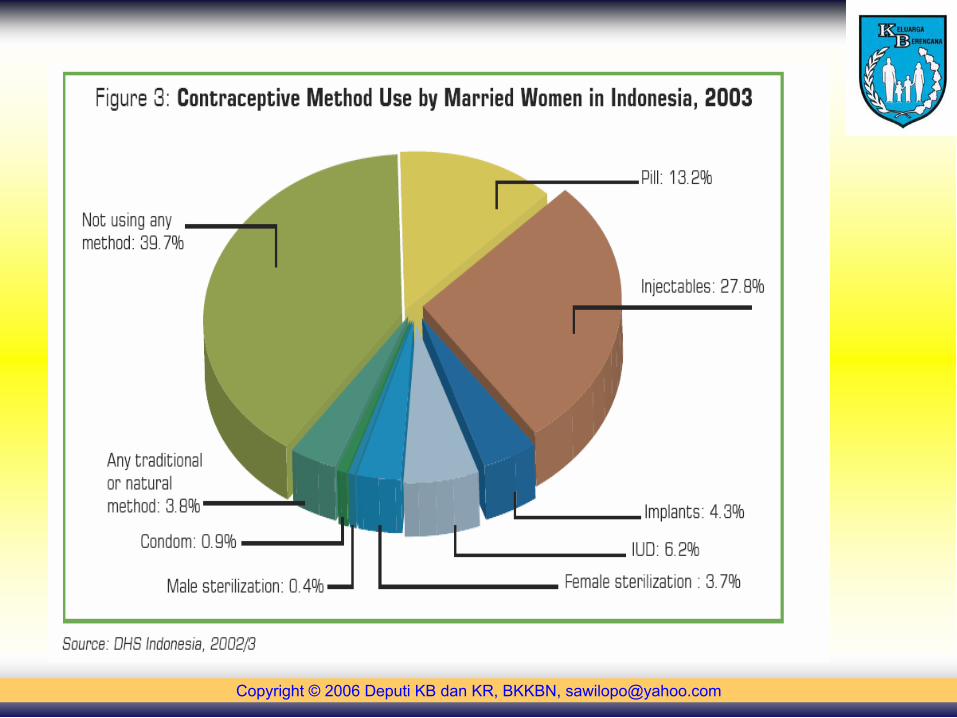
RH Commodity Need in Indonesia
Page 6
Copyright © 2006 Deputi KB dan KR, BKKBN, [email protected]
Trends in Contraceptive Prevalence Rates
Modern methods
All methods
Percent of Couples Using Any Contraception: Indonesia 1997-2006
40
45
50
55
60
65
70
1997 1998 1999 2000 2001 2002 2003 2004 2005 2006
Year
Perc
ent U
sing
C
ontra
cept
ion
IDHS
Susenas
Page 7
Copyright © 2006 Deputi KB dan KR, BKKBN, [email protected]
Page 8
Copyright © 2006 Deputi KB dan KR, BKKBN, [email protected]
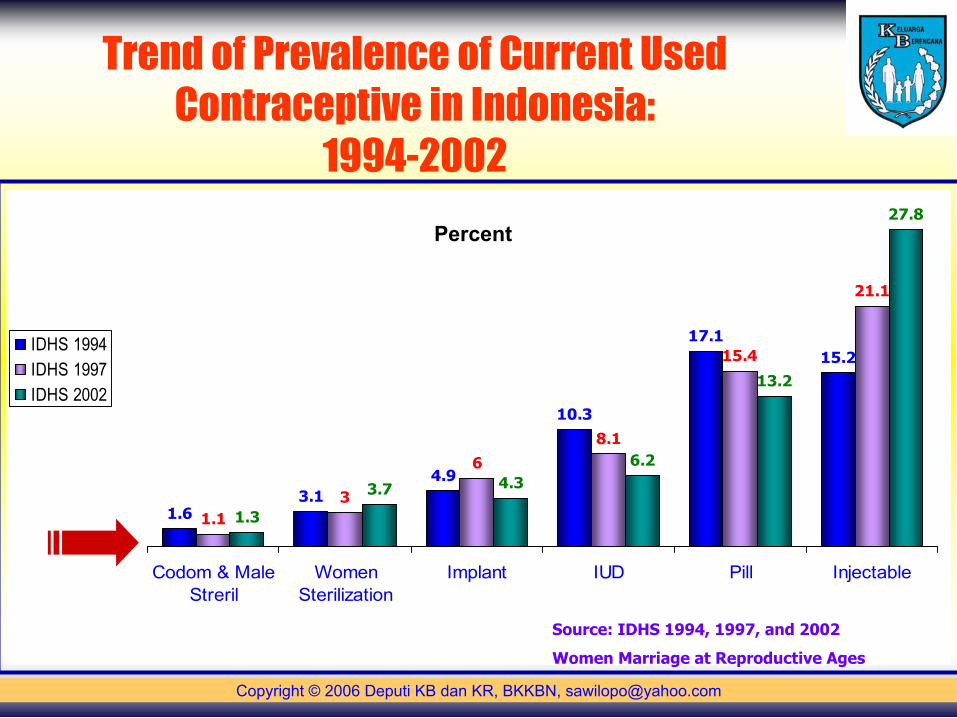
Trend of Prevalence of Current Used Contraceptive in Indonesia:
1994-2002
1.63.1
4.9
10.3
17.115.2
3
68.1
15.4
21.1
1.3
3.7 4.3
13.2
27.8
1.1
6.2
Codom & MaleStreril
WomenSterilization
Implant IUD Pill Injectable
IDHS 1994IDHS 1997IDHS 2002
Source: IDHS 1994, 1997, and 2002
Women Marriage at Reproductive Ages
Percent
Page 9
Copyright © 2006 Deputi KB dan KR, BKKBN, [email protected]
Male Contraceptive Used in Indonesia (%)
1.5
1.6
0.4
0.9
1.3
4.4
0.8
1.1
0.4
0.7
1.1
3
Coitus Interuptus
Calender
Vasectomi
Condom
Male User
Male Participation
IDHS 1997
IDHS 2002-
Percent
Sumber : SDKI 1997 dan 2002 Perempuan Berstatus Kawin
Page 10
Copyright © 2006 Deputi KB dan KR, BKKBN, [email protected]
“Unmet Need” for Contraceptive Services in Indonesia: 1997-2002
4.2 5
9.2
4 4.6
8.6
Spacing Limiting Total "Unmeet Need"
IDHS-1997
IDHS-2002Percent
Page 11
Copyright © 2006 Deputi KB dan KR, BKKBN, [email protected]
women who would prefer to avoid pregnancy do not use contraception
• Constraints in access to and quality• Shortages supply of contraception• Method failure• Health concerns about contraceptives and
side effects;• Lack of information;• Opposition from husband, family, and
community; and• Little perceived risk of pregnancy.
Page 12
Copyright © 2006 Deputi KB dan KR, BKKBN, [email protected]
FP Policy on RH Commodity Supply
Page 13
Copyright © 2006 Deputi KB dan KR, BKKBN, [email protected]
Challenges
• First, diversification in contraceptive methods used and method preference
• Second, capacity to provide appropriate and high quality services for family planning
• Third, decentralization and programming at different levels
Page 14
Copyright © 2006 Deputi KB dan KR, BKKBN, [email protected]
National Suppliers’ Practice
Page 15
Copyright © 2006 Deputi KB dan KR, BKKBN, [email protected]
• Previously, all family planning services were fully subsidized by the government for all Indonesians.
• In the late 1990s there was a gradual shift towards the private sector.
Page 16
Copyright © 2006 Deputi KB dan KR, BKKBN, [email protected]
• Use of government sources decreased from 43% in 1997 to 28% in 2002/3;
• Use of private medical sources increased from 42% in 1997 to 63% in 2002/3;
• Use of other sources(such as village birth delivery posts (polindes), integrated health
posts (posyandu), village contraceptive distribution centres(VCDCs), traditional birth attendants, or friends)
dropped from 15% in 1997 to 8% in 20002/3.
Page 17
Copyright © 2006 Deputi KB dan KR, BKKBN, [email protected]
Percent of Couples Using Any Contraception, National Surveys, 1980-2002
26.8
38.5
47.849.7
54.7
57.4
60.3
48.950.1
51.1 50.551.4 51.5 51.4
54.452.5
54.2
0
5
10
15
20
25
30
35
40
45
50
55
60
65
70
75
1982
1981
1983
1984
1985
1986
1987
1988
1989
1990
1991
1992
1993
1994
1995
1996
1997
1998
1999
2000
2001
2002
Perc
ent U
sing
Con
trac
eptio
n
DHS SERIES
SUSENAS SERIES
Source: Ross, 2005
Page 18
Copyright © 2006 Deputi KB dan KR, BKKBN, [email protected]
Use by Method: Percent of Couples Using Each Method: 15 Year Trend in National Surveys
0
5
10
15
20
25
30
Pill IUD Injections Condom Femalesterilization
Male sterilization Implants
Perc
ent o
f Cou
ples
1987
1991
1994
1997
2002-03
Source: Ross, 2005
Page 19
Copyright © 2006 Deputi KB dan KR, BKKBN, [email protected]
Injectable: Shifts in Source of Supply, 1997-2002
0
10
20
30
40
50
60
70
1994 1997 1998 1999 2000 2001 2002
Shar
e of
Inje
ctab
le U
se
BidanPrivate DoctorPolindes/BDD/PosyanduPuskesmas/PustuOther
Source: Ross, 2005
Page 20
Copyright © 2006 Deputi KB dan KR, BKKBN, [email protected]
Pill: Shifts in Sources of Supply, 1997-2002
0
5
10
15
20
25
30
35
1994 1997 1998 1999 2000 2001 2002
Shar
e of
Pill
Use
BidanPuskesmas/PustuPharmacyPolindes/BDD/Posyandu
Page 21
Copyright © 2006 Deputi KB dan KR, BKKBN, [email protected]
IUD: Shifts in Sources of Supply, 1997-2002
0
10
20
30
40
50
60
1994 1997 1998 1999 2000 2001 2002
Shar
e of
IUD
Use
BidanPrivate DoctorPuskesmas/PustuGovt. HospitalPolindes/BDD/PosyanduOther
Source: Ross, 2005
Page 22
Copyright © 2006 Deputi KB dan KR, BKKBN, [email protected]
Commom Logistic Problems
at District Level
Page 23
Copyright © 2006 Deputi KB dan KR, BKKBN, [email protected]
Problems
• Excess stock
• Poor reporting
• Poor storage
• Low morale
Page 24
Copyright © 2006 Deputi KB dan KR, BKKBN, [email protected]
Stock balances are not monitored.
Page 25
Copyright © 2006 Deputi KB dan KR, BKKBN, [email protected]
Warehouses are not well-maintained
Page 26
Copyright © 2006 Deputi KB dan KR, BKKBN, [email protected]
Page 27
Copyright © 2006 Deputi KB dan KR, BKKBN, [email protected]
Unwanted pregnancies
Page 28
Copyright © 2006 Deputi KB dan KR, BKKBN, [email protected]
Keys to Success
Page 29
Copyright © 2006 Deputi KB dan KR, BKKBN, [email protected]
Keys to Success:
• Logistics training
• Supervision
• Program plans include logistics
Page 30
Copyright © 2006 Deputi KB dan KR, BKKBN, [email protected]