Investigation of transmission line tower failures N. Prasad Rao a, * ,1 , G.M. Samuel Knight a,2 , N. Lakshmanan b,3 , Nagesh R. Iyer b,4 a College of Engineering Guindy, Anna University, Chennai, India b SERC, Chennai, India article info Article history: Received 16 December 2009 Accepted 27 January 2010 Available online 4 February 2010 Keywords: Transmission line towers Non-linear analysis Tower testing Redundant Cruciform angle section abstract This paper presents different types of premature failures observed during full-scale testing of Transmission line towers at Tower Testing and Research Station, Structural Engineering Research Centre, Chennai. Failures that have been observed during testing are studied and the reasons are discussed in detail. The effect of non-triangulated hip bracing pattern and isolated hip bracings connected to elevation redundants in ‘K’ and ‘X’ braced panels, on tower behaviour are studied. The tower members are modeled using beam-column and plate elements. Different types of failures are modeled using finite element software and the analytical results and the test results are compared with various codal provisions. The non-linear finite element analysis program NE-NASTRAN has been used to model the elasto-plastic behaviour of towers. Importance of secondary member design and con- nection detail in overall performance of the tower was studied. Non-linear finite element analysis is useful in understanding the system behaviour and for prediction of failure pat- tern and ultimate load. Based on the test results the importance of studying the failures is highlighted. The need for testing of transmission line towers is emphasized. Ó 2010 Elsevier Ltd. All rights reserved. 1. Introduction The design of transmission line (TL) towers, which are mass-produced, is generally based on minimum weight. The tow- ers, in general, are of lattice type consisting of legs, primary/secondary bracings and cross arm members. Structural design of the tower is mainly governed by wind loads acting on conductor/tower body, self weight of conductor/tower and other loads due to icing, line deviation, broken wire condition, cascading, erection, maintenance, etc. Generally the tower is modeled as a pin jointed space truss. Only legs and primary bracings are considered in the analysis. Transmission line towers are generally analyzed by linear static analysis methods and the maximum member forces are arrived assuming that all the members are subjected to only axial forces and the deformations are small after analyzing for significant load cases. The final member sizes are determined by assuming the effective lengths. The members are designed based on the prevailing codes of practice. Bearing type bolted connections are used to connect the tower members with nominal bolt hole clearance of 1.5 mm. Steel equal angle sections with different grades such as mild, high tensile and super high tensile steels are generally used in TL towers. The load carrying capacity of the tower, not only depends on the individual member capacity but, also on other as- pects like joint detailing, uncertainties in framing eccentricities of members, force fitting of members, unequal force distri- bution in bolts and gusset plate connections, etc. In a purely commercial exercise, the towers are to be erected on the test 1350-6307/$ - see front matter Ó 2010 Elsevier Ltd. All rights reserved. doi:10.1016/j.engfailanal.2010.01.008 * Corresponding author. Tel.: +91 044 22641206; fax: +91 044 22641734. E-mail address: [email protected](N. Prasad Rao). 1 Scientist (CSIR-SERC, Chennai, India) and (PhD Scholar, Anna University, Chennai, India). 2 Professor. 3 Project Advisor and Former Director. 4 Director. Engineering Failure Analysis 17 (2010) 1127–1141 Contents lists available at ScienceDirect Engineering Failure Analysis journal homepage: www.elsevier.com/locate/engfailanal
1 Scientist (CSIR-SERC, Chennai, India) and (PhD Sc2 Professor.3 Project Advisor and Former Director.4 Director.
This paper presents different types of premature failures observed during full-scale testingof Transmission line towers at Tower Testing and Research Station, Structural EngineeringResearch Centre, Chennai. Failures that have been observed during testing are studied andthe reasons are discussed in detail. The effect of non-triangulated hip bracing pattern andisolated hip bracings connected to elevation redundants in ‘K’ and ‘X’ braced panels, ontower behaviour are studied. The tower members are modeled using beam-column andplate elements. Different types of failures are modeled using finite element software andthe analytical results and the test results are compared with various codal provisions.The non-linear finite element analysis program NE-NASTRAN has been used to modelthe elasto-plastic behaviour of towers. Importance of secondary member design and con-nection detail in overall performance of the tower was studied. Non-linear finite elementanalysis is useful in understanding the system behaviour and for prediction of failure pat-tern and ultimate load. Based on the test results the importance of studying the failures ishighlighted. The need for testing of transmission line towers is emphasized.
� 2010 Elsevier Ltd. All rights reserved.
1. Introduction
The design of transmission line (TL) towers, which are mass-produced, is generally based on minimum weight. The tow-ers, in general, are of lattice type consisting of legs, primary/secondary bracings and cross arm members. Structural design ofthe tower is mainly governed by wind loads acting on conductor/tower body, self weight of conductor/tower and other loadsdue to icing, line deviation, broken wire condition, cascading, erection, maintenance, etc. Generally the tower is modeled as apin jointed space truss. Only legs and primary bracings are considered in the analysis. Transmission line towers are generallyanalyzed by linear static analysis methods and the maximum member forces are arrived assuming that all the members aresubjected to only axial forces and the deformations are small after analyzing for significant load cases. The final membersizes are determined by assuming the effective lengths. The members are designed based on the prevailing codes of practice.Bearing type bolted connections are used to connect the tower members with nominal bolt hole clearance of 1.5 mm. Steelequal angle sections with different grades such as mild, high tensile and super high tensile steels are generally used in TLtowers. The load carrying capacity of the tower, not only depends on the individual member capacity but, also on other as-pects like joint detailing, uncertainties in framing eccentricities of members, force fitting of members, unequal force distri-bution in bolts and gusset plate connections, etc. In a purely commercial exercise, the towers are to be erected on the test
. All rights reserved.
fax: +91 044 22641734.).holar, Anna University, Chennai, India).
1128 N. Prasad Rao et al. / Engineering Failure Analysis 17 (2010) 1127–1141
pad, and all the loads and load combinations are to be applied on the tower one at a time in a particular sequence. The towerneeds to sustain and withstand these loads for a certain period of time. Prototype testing of transmission line towers is rec-ommended and considered essential to verify the design and detailing. Most of the power transmission towers industries allover the world have made proto type testing of TL towers mandatory.
Kemp et al. [1] conducted series of tests with slenderness ratio ranging from 102 to 160 on cross bracing system widelyused in transmission line towers and concluded that due to dominant effect of end eccentricity, the secant formulation canbe used to provide a design formulation for cross bracing in the slenderness ratio range of 100–160. Cross bracing membersconnected to main legs by one flange of each bracing member significantly influences the displacement within the bracingsystem. As a result, the intersection joint of tension, compression bracings system deflects out of plane even at low loads andbending moments are generated.
Albermani et al. [2] presented a non-linear analytical technique accounting both material and geometric non-linearity topredict transmission tower failure. This method has been calibrated with the results from full-scale tower test conducted ontransmission line tower. The technique showed a good accuracy in terms of failure load and failure mode. The authors havequoted that technique developed can be used for failure analysis prediction, for design up gradation and modifications.
2. Design practice
The members in TL towers are generally subjected to tension or compression forces due to external loads. The design ofleg member is reliable, since the assumption of concentric load at both ends of the member is achieved in a real structure dueto geometric symmetry of the structure. However, eccentricities in bracing connections cannot be avoided. The eccentricitiesinvolved in the member connections are accounted in the form of end-restraint coefficients and hence, bracing member de-signs do have certain approximations built into them.
The tower members are generally made of steel equal angle sections. Generally, buckling strength of the member aboutVV-axis (minor axis) is considered in the design. If the main member is restrained by a redundant member connected to a rel-atively rigid member at its other end then it can prevent VV-axis buckling of full member and increase its buckling strength. Ifbuckling about VV-axis is prevented using a redundant member then the member has to buckle about XX-axis for thesame length. This principle is used in the general design practice of TL towers. The capacity of members given in Table 1are determined based on the buckling formulae given in IS: 802 (Part 1/Sec 2)-1992 [3] and ASCE 10-97 [4] which are formu-lated in accordance with ASCE manual 52.
3. Failure of transmission line towers
Even though transmission line towers are designed as per the codal provisions, may fail during testing due to so manyreasons such as incorrect design assumptions, improper detailing, material defects, fabrication errors, force fitting duringerection, variation in bolt grade, etc. The failures that occurred at Tower Testing and Research Station, Chennai are classifiedas structural failure of leg, bracing and redundant member failures, improper detailing, connection failures, material defects
Table 1Comaprison of member capacities, analytical and test failure loads.
Tower type Member details Failure load inpercentage
23 350 90 104.7 3466 4027 4659 4401 Leg in second panelfrom ground level
ISA 45 � 45 � 5 227 255 33 39 21 17 Inclined redundantin 2nd sub panel
275 kV D/C ISA 150 � 150 � 18 52 410 100 101 1464 1481 1795 1883 Leg in 1st panelISA 150 � 150 � 18 52 410 1399 1410 1795 1883 Leg in 2nd panelISA 150 � 150 � 18 62 410 1334 1361 1663 1786 Leg in 3rd panelISA 100 � 100 � 7 120 275 75 76 185 148 Brace in 1st panelISA 100 � 100 � 6 126 275 75 77 151 117 Brace in 2nd panel
N. Prasad Rao et al. / Engineering Failure Analysis 17 (2010) 1127–1141 1129
and fabrication errors. Generally leg members are designed with slenderness ratios of 40–60. In this range, the compressioncapacity is more or less equal to the net tension capacity of the member. The leg members may fail by inelastic buckling.Bracing members are designed with slenderness ratio <200 and generally it varies from 60 to 170. High strength steelsare mostly used for leg members. Many failures of towers are caused by buckling of compression leg or bracing members.Improper design of redundant member may cause the failure of leg or main bracing member.
4. Present study
Out of 138 full-scale tower tests conducted at Tower Testing and Research Station, Structural Engineering Research Cen-tre, Chennai, 32 towers experienced different types of premature failures. In the present study, five towers are investigatedfor its failure during testing. Different types of failures that occurred in these five towers are investigated. The membercapacities have been worked out for individual cases following ASCE 10-97/IS: 802 provisions and are given in the same ta-ble. The capacity of member calculated based on IS: 802 Standard is same as ASCE. In order to study the problem in detail,non-linear finite element analysis using NE-NASTRAN was carried out. Member capacities calculated based on BS-8100 [5]standard is compared with ASCE 10-97 and test results in Table 1. The member capacities and member forces at the time offailure obtained using beam-column elements in finite element models are given in the same table.
5. Numerical method
The non-linear finite element analysis methods are effective for evaluating the behaviour and strength of compressionmembers and space frames. The non-linear finite element analysis program NE-NASTRAN is used in this study to modelthe elasto-plastic behaviour of towers. A number of beam-column elements were used to model each angle member ofthe tower along the centroid of the section. A minimum of four beam-column elements are to be used to model a memberfor convergence. So each member is subdivided into four elements. Even though, the beam-column element is a line element,shape of the section can be defined. The stresses can be obtained from different points on the cross section called stressrecovery points. The limit load is reached in the finite element analysis when the stress at the maximum stressed pointsof the member reaches the yield stress. The non-linear analysis capability of the software accounting for geometric andmaterial non-linearity was used in the analysis of idealized configuration models to obtain their pre-ultimate behaviourand the limit loads. The elastic and plastic material property of steel was represented by an elasto-plastic bi-linear model,with a modulus of elasticity as 2E5 MPa up to yield and 2000 MPa above yield stress. The stress strain behaviour was given asinput for modeling the material properties for some towers for which the tensile test data was available The incrementalload and predictor–corrector iteration under each load increment were used in the non-linear range. The isotropic hardeningmodel was used in the post yield range. Load increments were carried out in 30–35 steps, until the limit point was reached inthe load deformation behaviour. The yielding is modeled by the von Mises criterion. Arc-length method in conjunction withmodified Newton Raphson method is used to further accelerate numerical solution convergence.
6. Towers studied
For the present study, five vertical configuration towers of different voltage clauses are considered. This includes two400 kV, one 275 kV and two 220 kV double circuit towers.
6.1. 400 kV double circuit tangent type tower
The 400 kV double circuit tower [6] was designed for 0–2� line deviation. The tower was designed for normal, earth wirebroken and one conductor broken conditions. Super high tensile steel of 450 MPa yield stress for leg members and mild steelfor all other members are used. The 59 m high square tower was 15 m wide at base, and 4.1 m wide at waist level. The con-figuration of tower, dimensions, member sizes, redundant pattern, loads applied during testing and the test tower at test bedare shown in Fig. 1.
During testing, the transverse horizontal load, longitudinal horizontal load and vertical loads are applied separately. Indi-vidual load sensors are connected at loading points to measure these loads. Angle sensors are used to control the direction ofapplication of transverse and longitudinal loads. The loads are applied through centralized servo controlled hydraulic actu-ators simultaneously at all loading points. To simulate the field condition of conductors suspended from ‘V’ insulator string,two steel wire ropes of equal lengths are attached in ‘V’ form during testing and the loads are applied through it.
The Testing was conducted as per IS:802 Part III [7] specifications and the loads are applied in increments of 25%, 50%,75%, 90%, 95% and 100% of the specified loads. At each load increment, the loads are maintained for a minimum of two min-utes and for the final 100% level, the loads are maintained for five minutes. The deflection measurements were taken at eachload level in the transverse and longitudinal directions at top of the tower. Strain gauge readings were measured in somemembers, which are likely to be critically stressed.
On applying loads corresponding to normal condition (reliability) load case, at 100% load, the tower collapsed as shownin Fig. 2. The failure has occurred in third and fourth panels from ground level and members in all other panels were
Fig. 1. Configuration of 400 kV D/C (0–2�) dev. Type tower and loads.
Fig. 2. Collapsed 400 kV D/C (0–2�) dev. Type tower.
1130 N. Prasad Rao et al. / Engineering Failure Analysis 17 (2010) 1127–1141
undamaged. Super high tensile steel angles of (Indian Standard Angle) ISA130 � 130 � 12 mm for first and second panels andISA130x130x10 mm for third and fourth panels were used for leg members. For leg member in fifth panelISA110 � 110 � 10 mm angle was used. The capacity of leg members based on ASCE and IS standards in first, second and fifthpanels were 10%, 7% and 17% more than the linear static analysis forces. The capacity of the leg members in third and fourthpanels were just 4% more than the analytical force. Forces obtained from non-linear static analysis and capacities of legmembers are given in Table 1.
To study the failure in detail entire tower was modeled using beam-column elements in NE-NASTRAN. The ‘V’ string insu-lator was modeled using cable element and the loads are applied through it. The non-linear finite element analysis clearlyshows that the leg members in third and fourth panels have failed. The non-linear analysis forces in leg members are 2–3%more as compared to linear static analysis forces. The finite element model shows that stresses in the flanges of leg crosssection in third and fourth panel have crossed yield level and predicts the failure load as 105%. The deformed finite elementmodel and the stress pattern are shown in Fig. 3. The analysis failure pattern is similar to test and it clearly shows the failureof leg member in third and fourth panels. The experimental deformation was 1.35 more than the analytical deformation intransverse and longitudinal directions. This additional deformation might have increased the member forces further.
6.2. 400 kV double circuit medium angle tower
The 400 kV double circuit tower [8] was designed for 0–15� line deviation. The tower was designed for normal, earth wireplus one conductor broken and simultaneous two conductor broken conditions. High tensile steel of 350 MPa yield stress forleg members and mild steel for all other members were used. The 50 m high square tower was 18.5 m wide at base, andreduces to 5.5 m at 28 m level. The configuration of tower, dimensions, member sizes, redundant pattern, and loads applied
Fig. 3. Deformed FE model and stress pattern of 400 kV D/C (0–2�) tower.
N. Prasad Rao et al. / Engineering Failure Analysis 17 (2010) 1127–1141 1131
during testing and erected test tower at test bed are shown in Fig. 4. The tower was tested with +6 m body extension. For legmember ISA150 � 150 � 20 mm and for bracing ISA100 � 100 � 7 mm was used in the bottom panel.
Fig. 4. Configuration of 400 kV D/C (0–15�) dev. Type tower and loads.
Fig. 5. Bracing failure in 400 kV D/C (0–15�) tower.
1132 N. Prasad Rao et al. / Engineering Failure Analysis 17 (2010) 1127–1141
In testing, the transverse horizontal, longitudinal horizontal and vertical loads are applied separately. Wind loads ontower body in between cross arms are combined with the conductor loads. The wind on tower body below waist levelwas combined and applied at 6 m and 12 m levels. The loads are applied through centralized servo controlled hydraulic actu-ators simultaneously at all loading points. The Testing was conducted as per IS: 802 Part III specifications. The deflectionmeasurements were taken at each load level in the transverse and longitudinal directions at top of the tower.
The tower was designed for 11 different loading cases corresponding to reliability, security and safety conditions. Onapplying the loads corresponding to 0� deviation middle and bottom conductor broken in security condition, at 95% load,the longitudinal face ‘K’ bracing in second panel at 12 m level and transverse face inverted ‘K’ bracing in third panel abovehorizontal belt failed as shown in Fig. 5.
ISA100 � 100 � 8 mm angle for ‘K’ bracing and ISA130 � 130 � 8 mm for inverted ‘K’ bracing was provided. The ‘K’ brac-ing was divided into four segments in elevation. The length of top segment nearer to 12 m level horizontal belt was twotimes compared to other segments. The provided hip bracing pattern divides the K bracing into four parts with the lengthof bottom part nearer to horizontal belt at 6 m level, as twice compared to others. The top segment (0.4 L) was designedfor major axis buckling with the restraint provided by the hip bracing. The bottom segment (0.4 L) was also designed formajor axis buckling with restraint from elevation redundant. The middle segment was designed for minor axis buckling.The failure occurred in top segment about major axis.
To study the failure in detail, the entire tower was modeled using beam-column elements in NE-NASTRAN. The failureload obtained through non-linear analysis is 102% of middle and bottom conductor broken condition load and the failurepattern is shown in Fig. 6.
The capacity of longitudinal face ‘K’ bracing at 12 m level as per ASCE and IS standard was 20% more as compared to theforce obtained from non-linear analysis. The capacity based on British standard was 5% less compared to analysis force. Thecapacity of inverted ‘K’ bracing predicted based on ASCE and British standards are 56% and 30% more than the analysis force.
Fig. 6. FE model bracing failure.
N. Prasad Rao et al. / Engineering Failure Analysis 17 (2010) 1127–1141 1133
This clearly shows that failure has occurred in the longitudinal face ‘K’ bracing in second panel and this has caused thefailure of transverse face inverted ‘K’ bracing in third panel. As a remedial measure, both ‘K’ and inverted ‘K’ bracings arechanged to higher section and redundant pattern was also changed.
6.3. 220 kV double circuit dead end tower
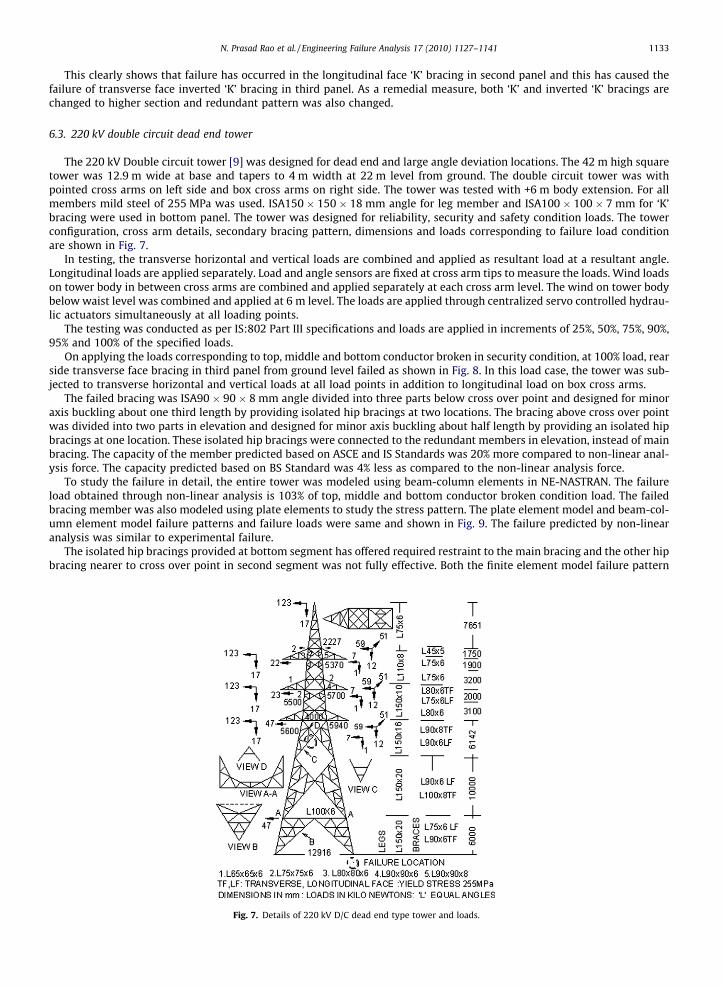
The 220 kV Double circuit tower [9] was designed for dead end and large angle deviation locations. The 42 m high squaretower was 12.9 m wide at base and tapers to 4 m width at 22 m level from ground. The double circuit tower was withpointed cross arms on left side and box cross arms on right side. The tower was tested with +6 m body extension. For allmembers mild steel of 255 MPa was used. ISA150 � 150 � 18 mm angle for leg member and ISA100 � 100 � 7 mm for ‘K’bracing were used in bottom panel. The tower was designed for reliability, security and safety condition loads. The towerconfiguration, cross arm details, secondary bracing pattern, dimensions and loads corresponding to failure load conditionare shown in Fig. 7.
In testing, the transverse horizontal and vertical loads are combined and applied as resultant load at a resultant angle.Longitudinal loads are applied separately. Load and angle sensors are fixed at cross arm tips to measure the loads. Wind loadson tower body in between cross arms are combined and applied separately at each cross arm level. The wind on tower bodybelow waist level was combined and applied at 6 m level. The loads are applied through centralized servo controlled hydrau-lic actuators simultaneously at all loading points.
The testing was conducted as per IS:802 Part III specifications and loads are applied in increments of 25%, 50%, 75%, 90%,95% and 100% of the specified loads.
On applying the loads corresponding to top, middle and bottom conductor broken in security condition, at 100% load, rearside transverse face bracing in third panel from ground level failed as shown in Fig. 8. In this load case, the tower was sub-jected to transverse horizontal and vertical loads at all load points in addition to longitudinal load on box cross arms.
The failed bracing was ISA90 � 90 � 8 mm angle divided into three parts below cross over point and designed for minoraxis buckling about one third length by providing isolated hip bracings at two locations. The bracing above cross over pointwas divided into two parts in elevation and designed for minor axis buckling about half length by providing an isolated hipbracings at one location. These isolated hip bracings were connected to the redundant members in elevation, instead of mainbracing. The capacity of the member predicted based on ASCE and IS Standards was 20% more compared to non-linear anal-ysis force. The capacity predicted based on BS Standard was 4% less as compared to the non-linear analysis force.
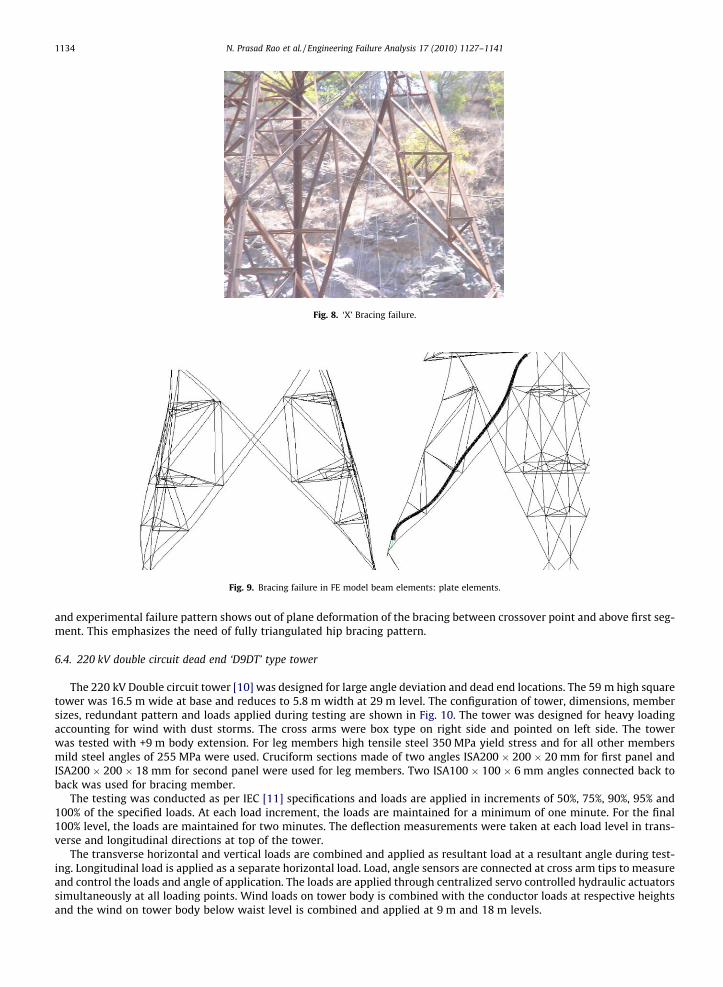
To study the failure in detail, the entire tower was modeled using beam-column elements in NE-NASTRAN. The failureload obtained through non-linear analysis is 103% of top, middle and bottom conductor broken condition load. The failedbracing member was also modeled using plate elements to study the stress pattern. The plate element model and beam-col-umn element model failure patterns and failure loads were same and shown in Fig. 9. The failure predicted by non-linearanalysis was similar to experimental failure.
The isolated hip bracings provided at bottom segment has offered required restraint to the main bracing and the other hipbracing nearer to cross over point in second segment was not fully effective. Both the finite element model failure pattern
Fig. 7. Details of 220 kV D/C dead end type tower and loads.
Fig. 8. ‘X’ Bracing failure.
Fig. 9. Bracing failure in FE model beam elements: plate elements.
1134 N. Prasad Rao et al. / Engineering Failure Analysis 17 (2010) 1127–1141
and experimental failure pattern shows out of plane deformation of the bracing between crossover point and above first seg-ment. This emphasizes the need of fully triangulated hip bracing pattern.
6.4. 220 kV double circuit dead end ‘D9DT’ type tower
The 220 kV Double circuit tower [10] was designed for large angle deviation and dead end locations. The 59 m high squaretower was 16.5 m wide at base and reduces to 5.8 m width at 29 m level. The configuration of tower, dimensions, membersizes, redundant pattern and loads applied during testing are shown in Fig. 10. The tower was designed for heavy loadingaccounting for wind with dust storms. The cross arms were box type on right side and pointed on left side. The towerwas tested with +9 m body extension. For leg members high tensile steel 350 MPa yield stress and for all other membersmild steel angles of 255 MPa were used. Cruciform sections made of two angles ISA200 � 200 � 20 mm for first panel andISA200 � 200 � 18 mm for second panel were used for leg members. Two ISA100 � 100 � 6 mm angles connected back toback was used for bracing member.
The testing was conducted as per IEC [11] specifications and loads are applied in increments of 50%, 75%, 90%, 95% and100% of the specified loads. At each load increment, the loads are maintained for a minimum of one minute. For the final100% level, the loads are maintained for two minutes. The deflection measurements were taken at each load level in trans-verse and longitudinal directions at top of the tower.
The transverse horizontal and vertical loads are combined and applied as resultant load at a resultant angle during test-ing. Longitudinal load is applied as a separate horizontal load. Load, angle sensors are connected at cross arm tips to measureand control the loads and angle of application. The loads are applied through centralized servo controlled hydraulic actuatorssimultaneously at all loading points. Wind loads on tower body is combined with the conductor loads at respective heightsand the wind on tower body below waist level is combined and applied at 9 m and 18 m levels.
Fig. 10. Configuration of 220 kV D/C DE-D9DT type tower and loads.
N. Prasad Rao et al. / Engineering Failure Analysis 17 (2010) 1127–1141 1135
The tower was designed for 10 different loading cases. In testing, the tower withstood the loads corresponding to all con-ductors and ground wire broken condition in both pointed and box cross arms. The tower was subjected to transverse, ver-tical and longitudinal loads at all conductor and ground wire points.
On applying the loads corresponding to ‘Dead End Normal Condition’ case, after reaching 90% load, the leg member insecond 9 m ‘K braced’ panel from ground level failed as shown in Fig. 11. The leg member in second ‘K braced’ 9 m panel
Fig. 11. Failed leg member of 220 kV D/C DE-D9DT type tower in test.
Fig. 12. Failure in FE model beam elements.
1136 N. Prasad Rao et al. / Engineering Failure Analysis 17 (2010) 1127–1141
was divided into 5 equal parts. Fully triangulated hip bracing pattern was used. The capacity of the failed leg member, basedon ASCE and IS Standards is 22% more as compared to the analytical force, but still failure occurred.
To find out cause of the failure, entire tower was modeled using beam-column elements in NE-NASTRAN. As per non-lin-ear analysis the failure load is 104.7% of Dead End Normal Condition load. The finite element non-linear analysis failure pat-tern is shown in Fig. 12. The finite element failure pattern clearly shows that the leg member in second ‘9 m K panel’ hasfailed. Finite element model failure pattern is similar to test failure.
To check the member plastification, all flanges of the leg member in cruciform shape made of two angle sections at thefailed location was modeled using plate elements. All other members are modeled as beam-column elements. Batten plates
Fig. 13. Stress pattern in plate elements.
N. Prasad Rao et al. / Engineering Failure Analysis 17 (2010) 1127–1141 1137
are also modeled as plate elements at a spacing of one meter as given in the tower drawing. At the transition between beamand plate elements, a rigid element was used to connect the beam element node with the nodes of the angle section modeledas plate elements. This method is useful in modeling the progressive yielding at the point of plastic hinge formation and sub-sequent failure by local buckling of the elements. The non-linear finite element failure and stress pattern of leg membermodeled as plate elements is shown in Fig. 13. The failure pattern is same as that of model with beam-column elements.The finite element model shows that stresses in the flanges of the leg cross section have crossed yield level. The analyticalfailure load obtained by this method is 4% less when compared to the failure load obtained from the model with all beam-column elements.
The slenderness ratio of secondary members in the failed panel varies from 130 to 227. The redundant pattern is such,that the leg member is restrained by a secondary member which is connected to another redundant member at its mid spanas shown in Fig. 10. The finite element failure analysis shows that the force in the redundant member at analytical failureload is more than its capacity. The analysis force in the first inclined redundant member marked as ‘R’ in detail ‘P’ of Fig. 10 at11 m height in second 9 m ‘K braced panel’ is 1.57 times more than its predicted capacity.
In order to check the forces in the redundant members, BS Standard procedure is adopted. As per this procedure, a hypo-thetical force shall be applied transverse to the leg member being stabilized at the node point of the attachment of the sec-ondary member. This force varies with the slenderness ratio of the leg member being stabilized and is expressed as apercentage of the leg load. This force shall be applied at one node at a time and the effect shall be calculated. For the presentcase, the nodal force is worked out based on the leg member slenderness ratio and force in it. The effect of this force on theredundant members is calculated by performing linear elastic analysis as mentioned in BS Standard. Since there is more thanone intermediate node in the second 9 m ‘K’ braced panel, the secondary bracing system is checked separately for 2.5% of theleg load applied equally between all the intermediate node points, as per BS procedure. These loads are applied together atright angles to the leg member and in the plane of bracing system. Secondary member shall be designed for the maximumforce obtained from the above two procedures. The force obtained in the redundant members in the second ‘K braced’ panelby this procedure exceeds the respective member capacities and it is lesser than the 2.5% force in the leg member.
The entire secondary members in the failed panel were replaced with higher sections and the tower was tested to its fullcapacity.
6.5. 275 kV double circuit medium line deviation tower
The 275 kV Double circuit tower [12] was designed for use in medium angle deviation locations. The 63 m high squaretower was 12.6 m wide at base and tapers to 3.8 m width at 30 m from ground level. The double circuit tower was withpointed cross arms on both left and right side. The tower was tested with +9 m body extension. First and second panels fromground level were 9 m and 6 m high with ‘K’ bracing system. For leg members high tensile steel 410 MPa yield stress and forall other members mild steel of 255 MPa was used. For leg members in first 9 m and second 6 m ‘K braced panels’
Fig. 14. Configuration of 275 kV D/C ‘M’ type tower and loads.
1138 N. Prasad Rao et al. / Engineering Failure Analysis 17 (2010) 1127–1141
ISA150 � 150 � 18 mm angle was used. For ‘K’ bracings in first and second panels ISA100 � 100 � 7 mm andISA100 � 100 � 6 mm were used. The tower was designed for normal, earth wire broken and simultaneous two conductorbroken conditions. Tower configuration, cross arm details, secondary bracing pattern, dimensions, loads corresponding tofailure loading condition and the test tower in test bed is shown in Fig. 14.
In testing, the transverse, longitudinal and vertical loads are applied separately. The loads are applied through centralizedservo controlled hydraulic actuators simultaneously at all loading points. The Testing was conducted as per IEC specificationsand loads are applied in increments of 50%, 75%, 90%, 95% and 100% of the specified loads. At each load increment, the loadsare maintained for a minimum of one minute and for the final 100% level, the loads are maintained for two minutes. Thedeflection measurements were taken at each load level in the transverse and longitudinal directions at top of the tower.
In testing, the tower withstood the loads corresponding to conductor broken and ground wire broken conditions. Onapplying loads corresponding to normal condition in which the tower is subjected to transverse horizontal and vertical loads,the entire tower collapsed at 100% load as shown in Fig. 15. The failure occurred in second 6 m ‘K’ braced panel.
The leg and bracing members in second ‘K braced’ 6 m panel was divided into 4 equal parts. The bracing member wasdesigned for 0.5 L about major axis (0.5 L/rxx). The failure pattern shows that the compression bracing member has failed firstand subsequently the leg members failed. Triangulated hip bracing pattern was not provided in this panel. Isolated hip brac-ing members connected to elevation redundant away from the main bracing and hip bracing intersecting point was providedin first and second sub-panels. Leg members in first and second panels were having a safety factor of 1.22 and 1.28 and brac-ing members were having 2.0 and 1.70 on the assumption that the isolated hip bracing provides the required restraint. Butthe tower collapsed at 100% load.
Fig. 15. Collapsed 275 kV D/C ‘M’ type tower.
Fig. 16. Failure in FE model.
N. Prasad Rao et al. / Engineering Failure Analysis 17 (2010) 1127–1141 1139
In the first ‘K braced’ 9 m panel the leg and bracing members are equally divided into six parts and fully triangulated hipbracing pattern was provided as shown in Fig. 14. The bracing was designed for 0.33 L about major axis and this has behavedas per design assumptions and hence there was no failure in the bottom panel.
The entire tower was modeled using beam-column elements in NE-NASTRAN. The isolated hip bracings connected to ele-vation redundant member in the ‘K braced 6 m’ panel were also modeled. The non-linear analysis failure pattern is shown inFig. 16 and the failure load is 101% of normal condition. The non-linear analysis failure pattern shows out of plane deforma-tion of main ‘K’ bracing in second panel over three-fourth lengths instead of assumed half length (0.5 L). This clearly showsthat the isolated hip bracing provided in the second sub panel of ‘K braced 6 m’ panel has not offered required restraint to themain bracing. The main bracing buckled about its major axis on three-fourth length (0.75 L), there by increased the effectivelength of the leg member and caused its failure. Finite element analysis shows that the behaviour of 9 m ‘K’ panel was as perdesign assumptions and there was no failure of bracing and leg members. Finite element stress pattern shows that the max-imum stress in the second panel leg member is 370Mpa which is below its yield stress. This shows that the failure is due toinstability in the second ‘K’ braced panel. Triangulated hip bracing pattern shall be used if ‘K’ or ‘X’ braced panels are dividedinto two or more sub-panels.
6.6. Comparison of member capacities
The member capacities are calculated based on BS Standard apart from ASCE and IS Standard and given in Table 1. IS codeis almost same as ASCE. British code takes full width of angle section for calculation of width to thickness (b/t) ratio. Thelimiting ‘b/t’ ratio is 1.22 times higher in BS standard compared to ASCE standard.
For cruciform angle sections connected intermittently the possible additional deformations due to shear is taken into ac-count in British standard by modifying the slenderness ratio. In Table 1, the capacity of the bracing member calculated basedon ASCE and IS standard is more compared to BS standard.
Figs. 17 and 18 shows the comparison of failure loads for leg and bracing members calculated based on different stan-dards, finite element analysis and also based on experiments. FEM results are higher by 3–14% for all towers. The capacityof bracing member predicted from ASCE standard is always higher than the test values for all slenderness ratios.
The British Standard predicts the capacity of single angle bracing members closer to 2–5% of the experimental values forall ranges of slenderness ratio.
The predicted capacity of single angle leg member based on British Standard is 10% more than the experimental values formembers with slenderness ratio <60.
The American Standard overestimates the capacity of single angle bracing members by 10–20% for all slenderness ratios.The capacity of cruciform sections made of two angles calculated based on American Standard is 16–20% more than the
experimental values. The capacity calculated based on British Standard is only 10% more than the test values. This may bedue to consideration of additional deformations due to shear in intermittently connected sections.
LEG MEMBERS
0
250
500
750
1000
1250
1500
1750
2000
2250
2500
2750
3000
3250
3500
3750
4000
4250
4500
4750
5000
CA
PAC
ITY
IN k
N
FEM
TEST
BS
ASCE and IS
5 REWOT1 REWOT TOWER 4
Fig. 17. Comparison of leg member capacity.
BRACING MEMBERS
0
25
50
75
100
125
150
175
200
225
250
275
CA
PAC
ITY
IN k
N
FEM
TESTASCE and IS
BS
TOWER 1 TOWER 2 TOWER 3 TOWER 4
Fig. 18. Comparison of bracing member capacity.
1140 N. Prasad Rao et al. / Engineering Failure Analysis 17 (2010) 1127–1141
The capacity calculated based on British Standard for a compound member consisting of pair of angles connected back toback at intervals in the form of ‘T’ section and designed for major axis buckling is closer to test results as compared to thecapacity calculated based on American Standard.
7. Conclusions
Based on the experimental, analytical and theoretical investigation carried on five different towers of various voltagesranging from 220 kV to 400 kV vertical configuration the following conclusions are drawn.
� The results shows that the member forces obtained from non-linear analysis are more as compared to the conventionallinear static analysis force with truss elements.
� The leg and bracing members failed in the panels below waist level for all towers.� The forces in the leg members calculated based on non-linear analysis are 2–4% more than the forces calculated based on
conventional linear static analysis.� In the 400 kV tangent type tower, leg member in third and fourth panels and bracing member in second and fourth panels
failed due to less safety margins provided.� Non-linear analysis shall be carried out for tangent towers, slender and tall towers with height to bottom width ratio
above 3.7.� ASCE and IS standards overestimates the bracing member capacity compared to experimental values for all ranges of slen-
derness ratios.� Predictions by the British standard overestimate the capacity of single angle leg members with slenderness ratio below 60
as compared to the experimental value.� In 220 kV DE type tower, the bracing member in the third panel failed due to non-triangulated hip bracing pattern
provided.� The isolated hip bracings shall be connected to main bracings by bent up gussets to obtain full restraint.� In the 220 kV DE-D9DT type tower, the leg member in second 9 m ‘K’ braced panel failed due to insufficient capacity of
redundant member.� Whenever, compound members are used such as a built up section with two angles as cruciform section, or back to back
as ‘T’ section, the redundant members shall be designed for the forces obtained from the procedure given by the BritishStandard or it should be designed for 2.5% of the force carried by the main member to avoid failure.
� The 275 kV medium angle tower failed in second ‘K’ braced panel because of instability due to non-triangulated hip brac-ing pattern.
� In ‘X’ and ‘K’ braced panels divided into more than two sub-panels, triangulated hip bracing pattern shall be provided forgeometric stability and for the required restraint to the main member.
� It is possible to predict through Finite element non-linear analysis the probable load carrying capacity of the tower, defi-ciencies in the design and the instability in the structure.
� Bracing members with slenderness ratios above 170 becomes ineffective even though it has to carry small forces.
N. Prasad Rao et al. / Engineering Failure Analysis 17 (2010) 1127–1141 1141
� Fully triangulated hip bracing pattern as given BS code is effective in ‘K’ braced panels especially at the bottom of towerswhere width and height of the panels are more and subdivided into more than two sub-panels, instead of isolated hipbracings.
� Redundant members shall be checked based on British Standard provisions or it should be designed for 2.5% of axial forcein the main member.
� Redundant members shall be included in the analysis of towers.
References
[1] Kemp Alan R, Behncke Roberto H. Behaviour of cross bracing in latticed towers. J Struct Eng 1998;124(4):360–7.[2] Albermani F, Kitipornchai S. Failure analysis of transmission towers. J Eng Failure Anal 2009;16(6):1922–8.[3] IS: 802 (part 1/sec 1:1995 and sec 2: 1992) use of structural steel in over head transmission line towers – code of practice (materials, loads and
permissible stresses).[4] Design of latticed steel transmission structures. ASCE Standard, ASCE 10-97, 2000.[5] Lattice towers and masts: part 3 code of practice for strength assessment of members of lattice towers and masts. British Standard BS: 8100 – 3:1999.[6] Test report on 400 kV D/C type ‘DA + 9 m’ tower, TSP 1091 41, October, 2002, SERC, Chennai.[7] IS: 802 (part III)-1978. Use of structural steel in over head transmission line towers-code of practice, part III testing.[8] Test report on 400 kV D/C type-DB (0–15�) + 6 m body extension tower, TSP 1142 41, October, 2009, SERC, Chennai.[9] Test report on 220 kV D/C ‘D-90�/DE-0� tower TSP 1119 41, SERC, Chennai, June, 2007.
[10] Test report on 220 kV D/C type ‘D6/D9/DT + 9 m’ tower TSP 1104 41, SERC, Chennai, December, 2005.[11] Loading tests on overhead lines structures, IEC 60 652; 2002.[12] Test report on 275 kV D/C type 275M + 9 m extension tower TSP 1093 41, SERC, Chennai, December, 2003.