Page 1
1
Seven Home-Health Touch Points to Prevent Avoidable
Re-hospitalizations
Jennifer Wieckowski, MSGProgram Director, Care Transitions
Health Services Advisory Group of California, Inc.(HSAG of California)
Page 2
2
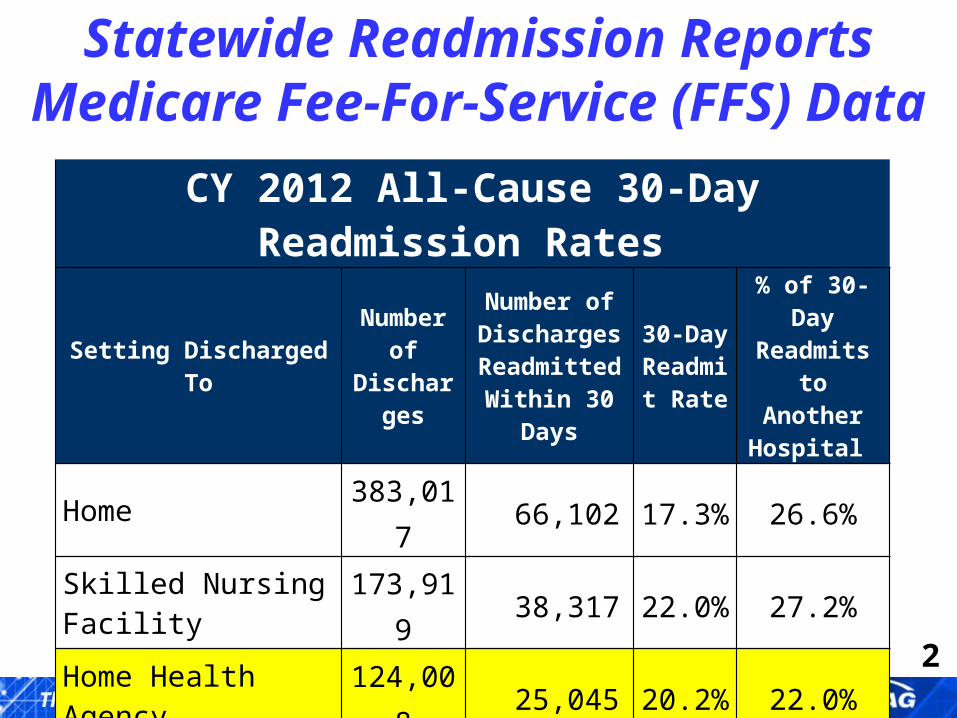
Statewide Readmission ReportsMedicare Fee-For-Service (FFS) Data
CY 2012 All-Cause 30-Day Readmission Rates
Setting Discharged To Number of Discharges
Number of Discharges Readmitted
Within 30 Days
30-Day Readmit
Rate
% of 30-Day Readmits to
Another Hospital
Home 383,017 66,102 17.3% 26.6%Skilled Nursing Facility 173,919 38,317 22.0% 27.2%
Home Health Agency 124,008 25,045 20.2% 22.0%Hospice 15,968 553 3.5% 36.9%Other 53,449 10,822 20.2% 41.6%All 750,361 140,839 18.8% 27.1%
Page 3
3
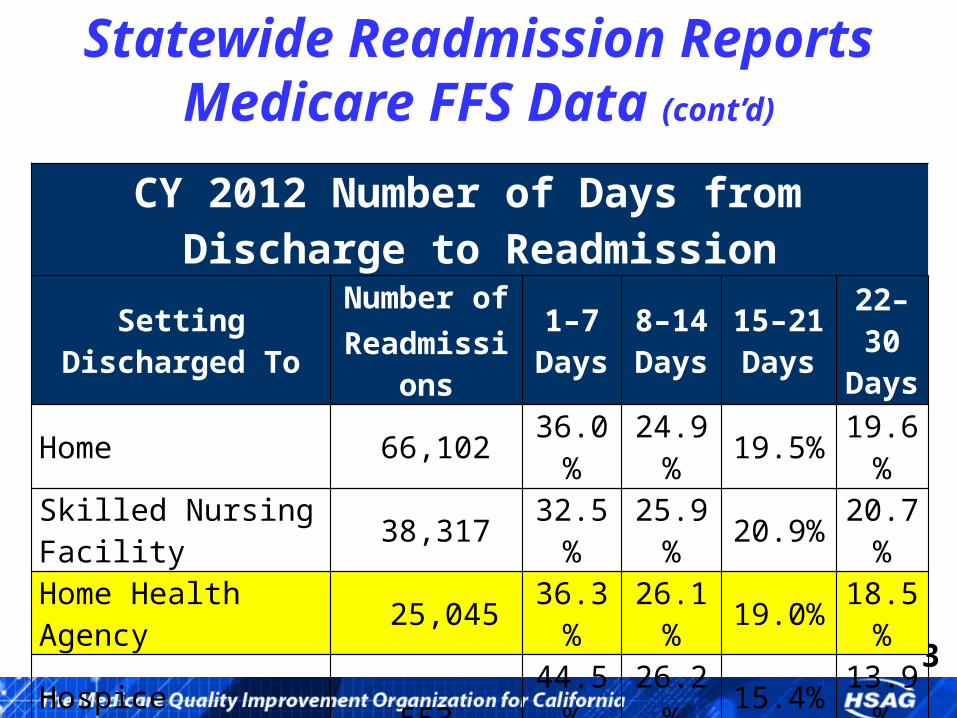
Statewide Readmission ReportsMedicare FFS Data (cont’d)
CY 2012 Number of Days from Discharge to Readmission
Setting Discharged To Number ofReadmissions
1–7 Days
8–14 Days
15–21 Days
22–30 Days
Home 66,102 36.0% 24.9% 19.5% 19.6%Skilled Nursing Facility 38,317 32.5% 25.9% 20.9% 20.7%Home Health Agency 25,045 36.3% 26.1% 19.0% 18.5%Hospice 553 44.5% 26.2% 15.4% 13.9%Other 10,822 38.2% 22.0% 18.5% 21.4%All 140,839 35.3% 25.2% 19.7% 19.8%
Page 4
4
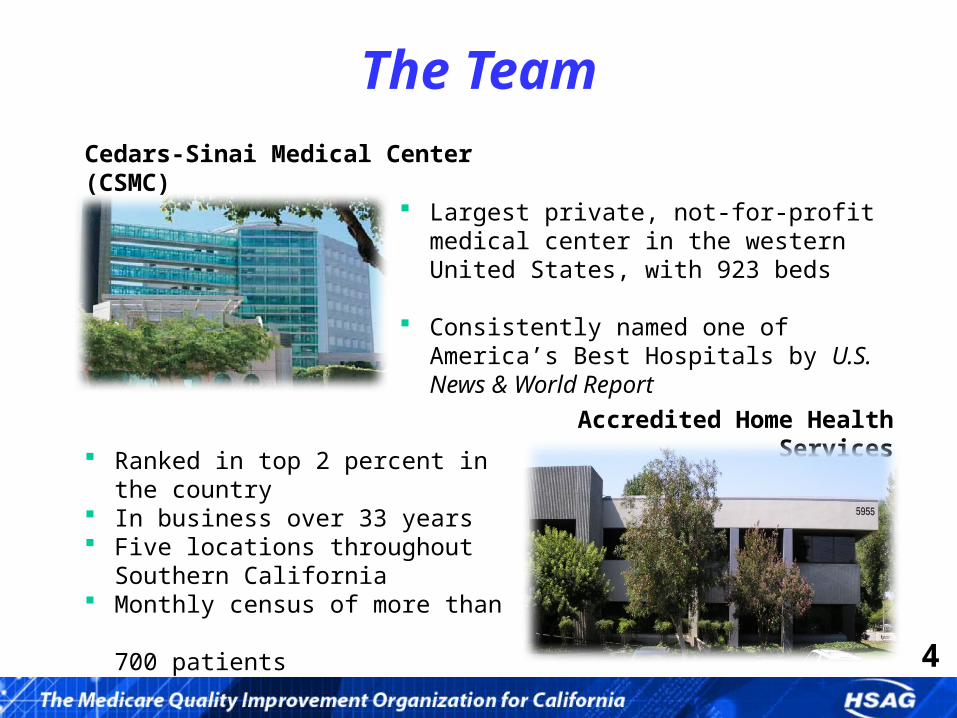
The Team
Largest private, not-for-profit medical center in the western United States, with 923 beds
Consistently named one of America’s Best Hospitals by U.S. News & World Report
Ranked in top 2 percent in the country In business over 33 years Five locations throughout
Southern California Monthly census of more than
700 patients
Cedars-Sinai Medical Center (CSMC)
Accredited Home Health Services
Page 5
5
The Challenge
Reduce readmissions from home health by 50 percent.
Page 6
6
Are you NUTS?!?!
Page 7
7
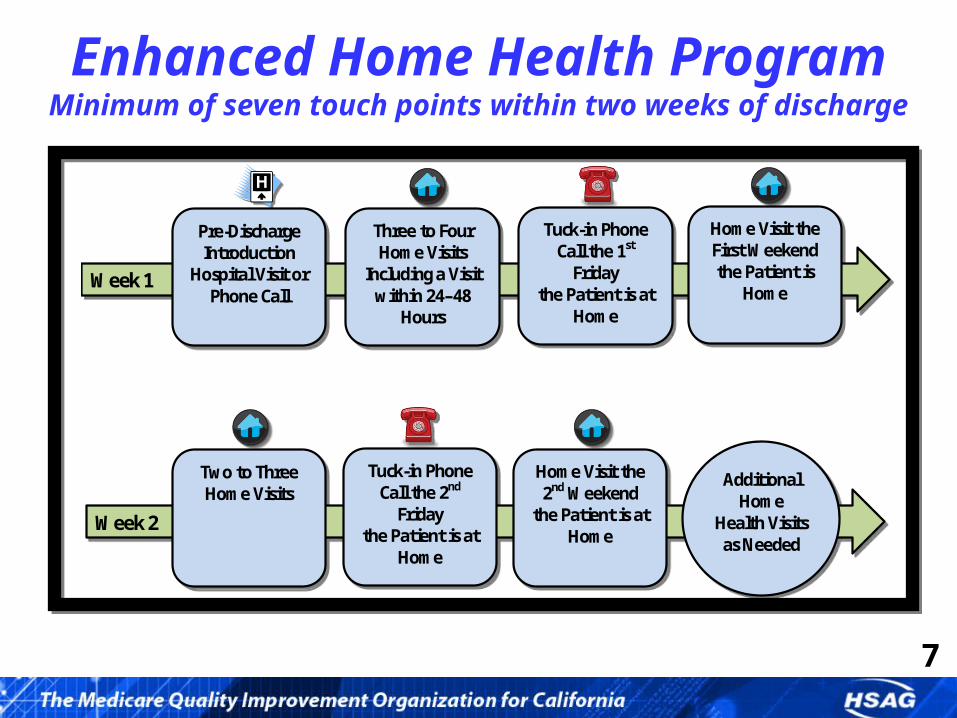
Enhanced Home Health ProgramMinimum of seven touch points within two weeks of dischargeEnhanced Home Health Program
A minimum of 7 touch points to occur within the first two weeks of discharge.
Week 1
Week 2
Home Visit the First Weekend the Patient is
Home
Additional Home
Health Visits as Needed
Tuck-in Phone Call the 1st
Friday the Patient is at
Home
Three to Four Home Visits
Including a Visit within 24–48
Hours
Pre-Discharge Introduction
Hospital Visit or Phone Call
Home Visit the 2nd Weekend
the Patient is at Home
Tuck-in Phone Call the 2nd
Friday the Patient is at
Home
Two to Three Home Visits
Enhanced Home Health Program A minimum of 7 touch points to occur within the first two weeks of discharge.
Week 1
Week 2
Home Visit the First Weekend the Patient is
Home
Additional Home
Health Visits as Needed
Tuck-in Phone Call the 1st
Friday the Patient is at
Home
Three to Four Home Visits
Including a Visit within 24–48
Hours
Pre-Discharge Introduction
Hospital Visit or Phone Call
Home Visit the 2nd Weekend
the Patient is at Home
Tuck-in Phone Call the 2nd
Friday the Patient is at
Home
Two to Three Home Visits
Page 8
8
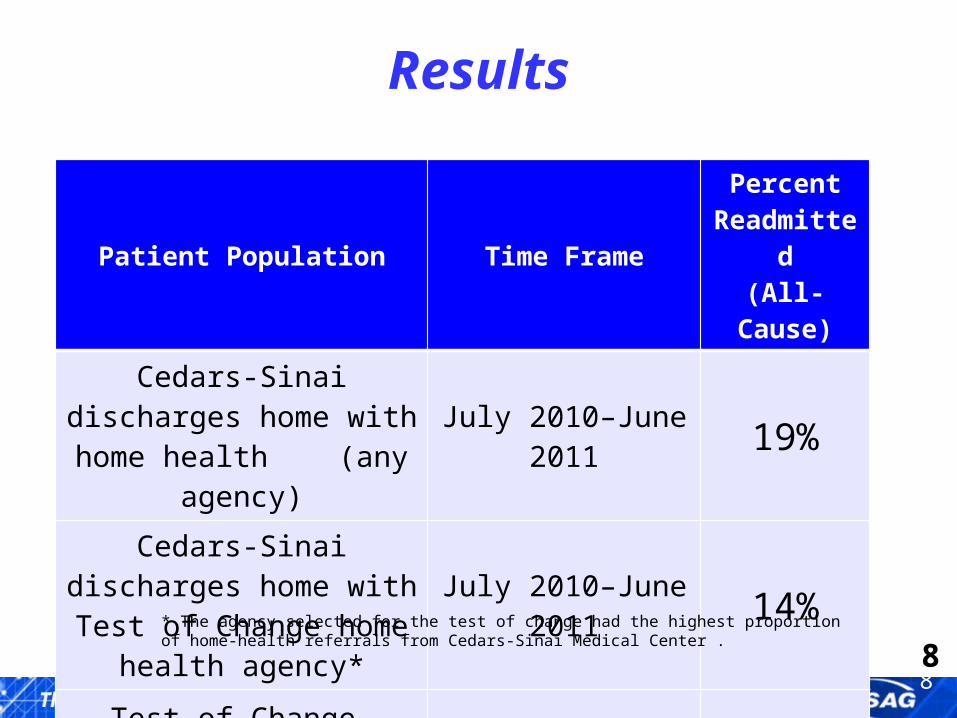
Results
8
Patient Population Time FramePercent
Readmitted(All-Cause)
Cedars-Sinai discharges home with home health
(any agency)July 2010–June 2011 19%
Cedars-Sinai discharges home with Test of Change
home health agency*July 2010–June 2011 14%
Test of Change (n=59 patients)
November 2011 6.8%
* The agency selected for the test of change had the highest proportion of home-health referrals from Cedars-Sinai Medical Center .
Page 9
9
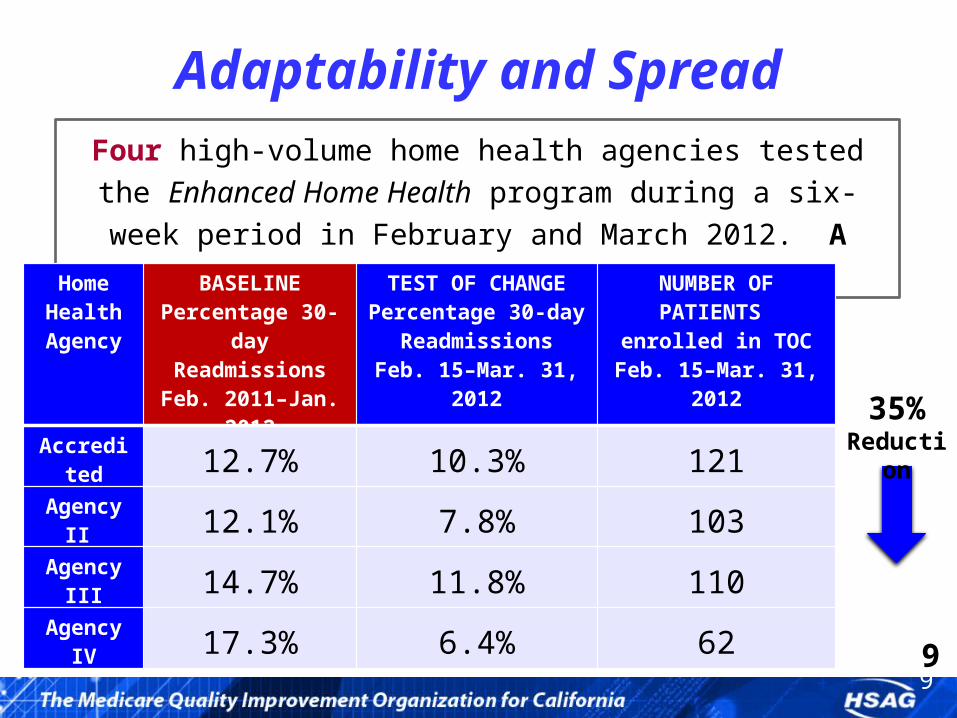
Adaptability and Spread
9
Four high-volume home health agencies tested the Enhanced Home
Health program during a six-week period in February and March
2012. A total of 396 patients were enrolled.
Home Health Agency
BASELINEPercentage 30-day
ReadmissionsFeb. 2011–Jan. 2012
TEST OF CHANGEPercentage 30-day
ReadmissionsFeb. 15–Mar. 31, 2012
NUMBER OF PATIENTS
enrolled in TOCFeb. 15–Mar. 31, 2012
Accredited 12.7% 10.3% 121
Agency II 12.1% 7.8% 103
Agency III 14.7% 11.8% 110
Agency IV 17.3% 6.4% 62
35%Reduction
Page 10
10
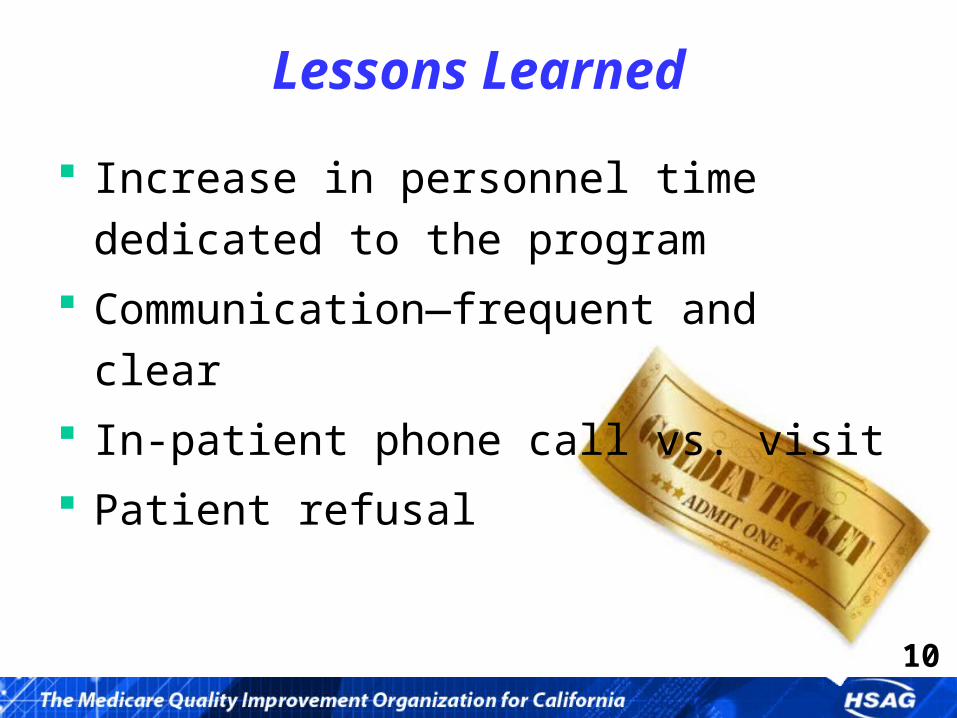
Lessons Learned
Increase in personnel time dedicated to the
program
Communication—frequent and clear
In-patient phone call vs. visit
Patient refusal
Page 11
11
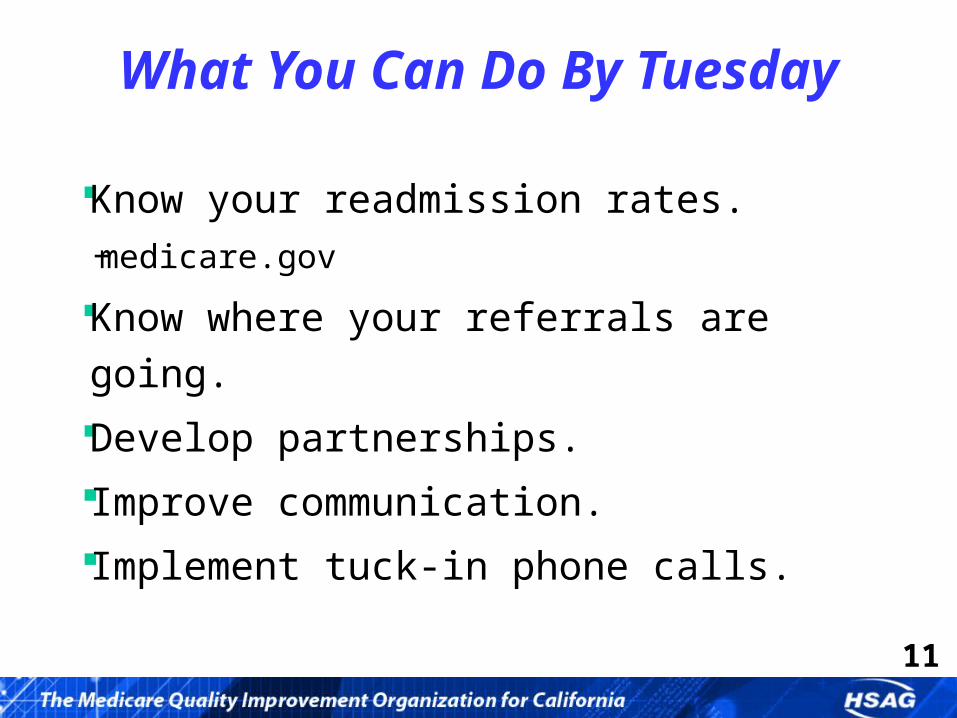
What You Can Do By Tuesday
Know your readmission rates.− medicare.gov
Know where your referrals are going.
Develop partnerships.
Improve communication.
Implement tuck-in phone calls.
Page 12
12
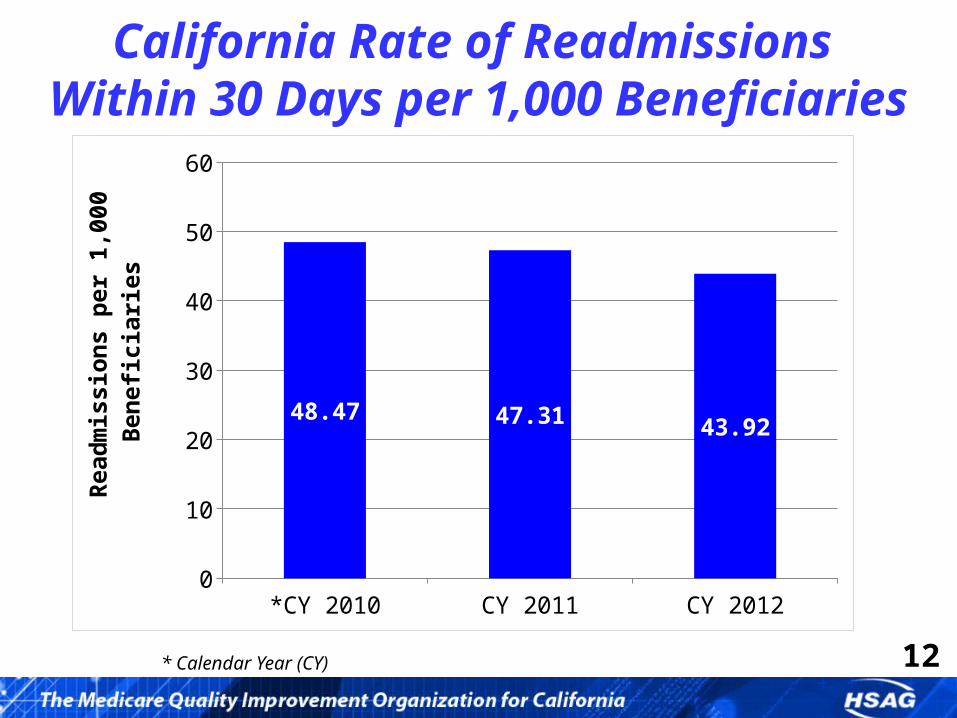
California Rate of Readmissions Within 30 Days per 1,000 Beneficiaries
*CY 2010 CY 2011 CY 20120
10
20
30
40
50
60
48.47 47.31 43.92
Rea
dmis
sion
s pe
r 1,
000
Ben
efic
iari
es
* Calendar Year (CY)
Page 13
13
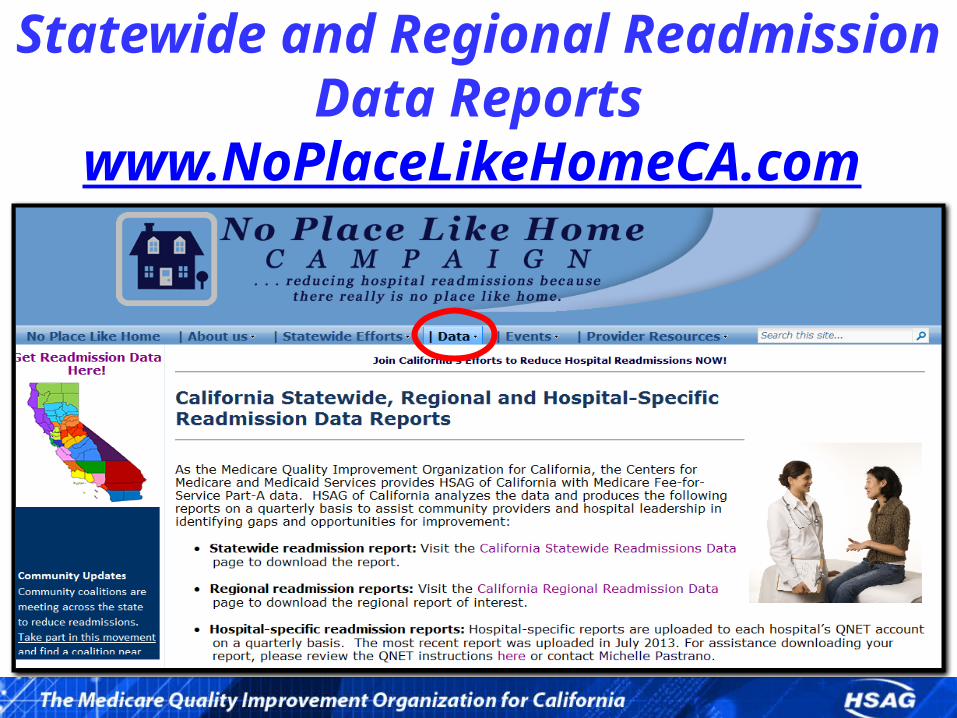
Statewide and Regional Readmission Data Reports
www.NoPlaceLikeHomeCA.com
Page 14
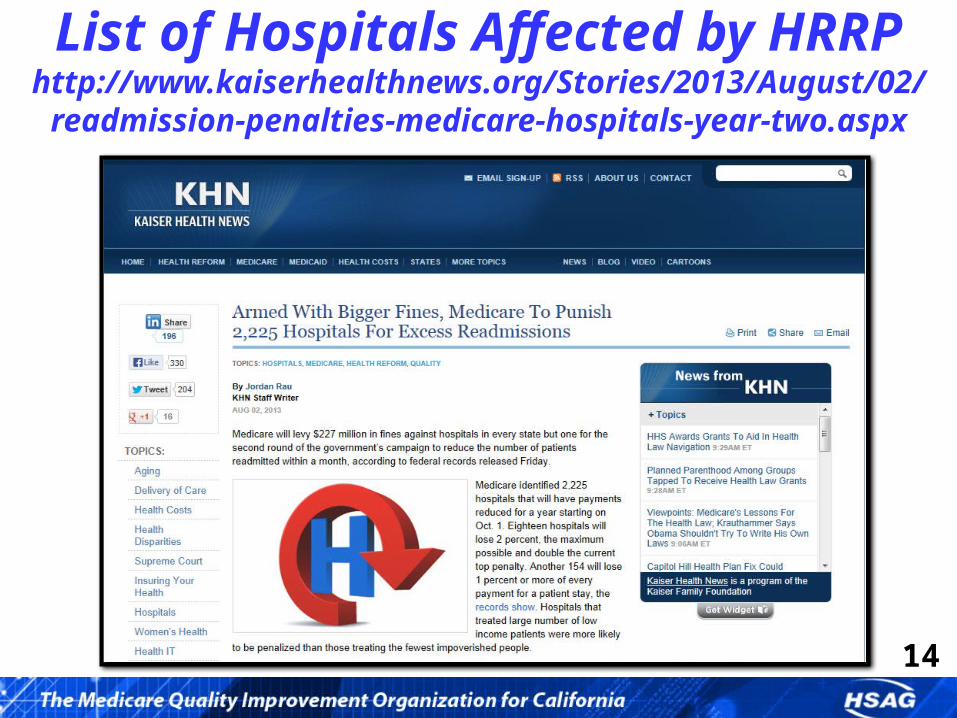
14
List of Hospitals Affected by HRRPhttp://www.kaiserhealthnews.org/Stories/2013/August/02/ readmission-penalties-medicare-hospitals-year-two.aspx
Page 15
15
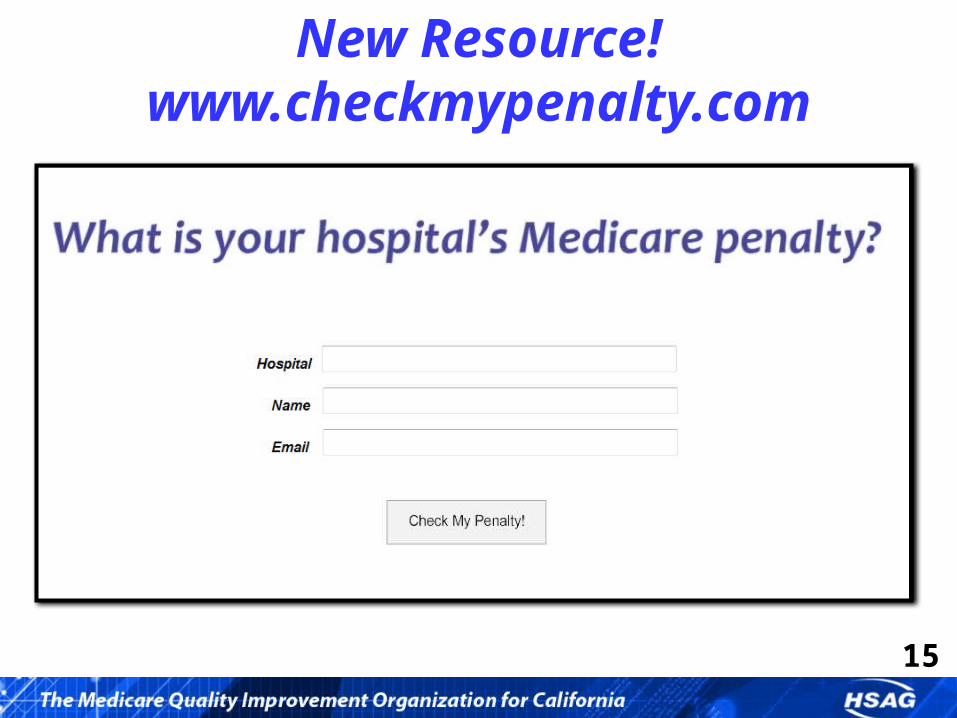
New Resource!www.checkmypenalty.com
Page 16
16
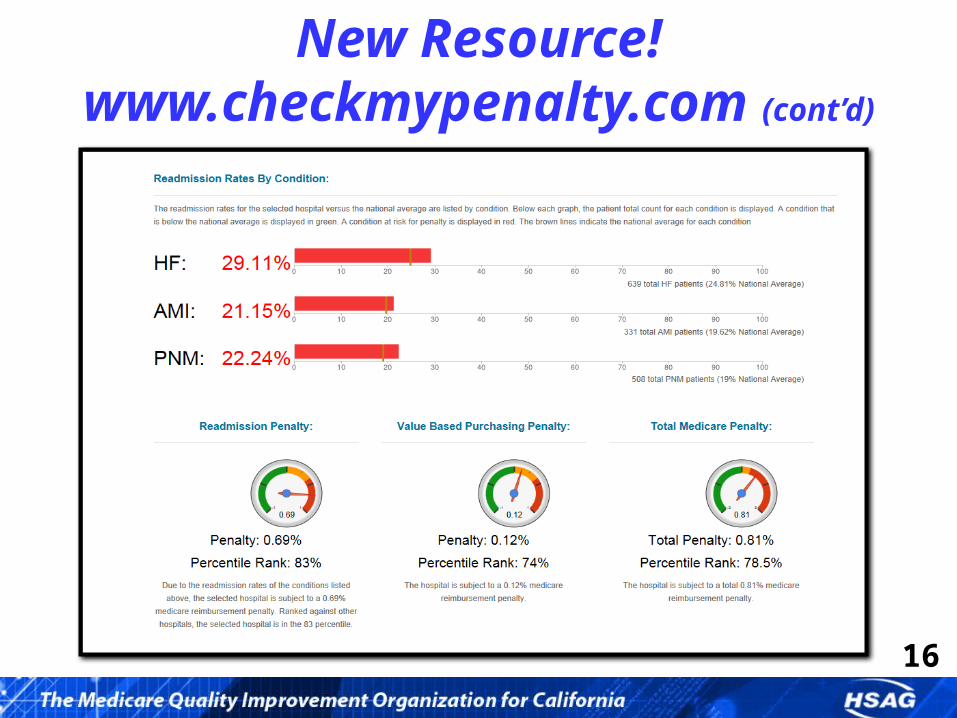
New Resource! www.checkmypenalty.com (cont’d)
Page 17
17
Home Health Quality Improvement Campaign
http://www.homehealthquality.org/Home.aspx
Page 18
18
Thank You!
Jennifer Wieckowski, MSGProgram Director, Care Transitions
[email protected] of California
700 North Brand Blvd., Suite 370Glendale, CA 91203
818.409.9229
Page 19
19
Closing Slide
www.hsag.comThis material was prepared by Health Services Advisory Group of California, Inc., the Medicare Quality
Improvement Organization for California, under contract with the Centers for Medicare & Medicaid Services (CMS), an agency of the U.S. Department of Health and Human Services. The contents presented do not
necessarily reflect CMS policy. Publication No. CA-10SOW-8.0-091813-01
We convene providers, practitioners, and patients to build and share knowledge, spread best practices, and
achieve rapid, wide-scale improvements in patient care; increases in population health;
and decreases in healthcare costs for all Americans.