J. Sep. Sci. 2005, 28, 373 – 379 www.jss-journal.de i 2005 WILEY-VCH Verlag GmbH & Co. KGaA, Weinheim Original Paper Moon, Kim, Jung, Lee, Chang 373 Myeong Hee Moon 1 Hyun-Joo Kim 1 Young-Ok Jung 2 Se-Jin Lee 3 , Yoon-Seok Chang 3 1 Department of Chemistry, Yonsei University, Seoul, 120-749, Korea 2 Department of Chemistry, Pusan National University, Pusan, 609-735, Korea 3 School of Environmental Science & Engineering, Pohang University of Science & Technology, Pohang, 790-784, Korea Size fractionation of marine sediments by pinched inlet gravitational split-flow thin fractionation and the study of size dependent PCDD/Fs concentrations from different bay areas Pinched inlet gravitational split-flow thin fractionation (PI-GSF) has been applied to the continuous size fractionation of marine sediments in order to study the difference in sediment size distribution and the concentration of PCDD/Fs contained in different particle sizes. A PI-GSF channel, known to improve the separation efficiency by reducing the sample inlet thickness, was utilized to fractionate sediments collected from three different bay areas (Geoje, Ulsan, and Pohang) in Korea into 5 different sub-populations (a 2.0, 2.0 – 5.0, 5.0 – 10, 10 – 20, 20 – 63 lm in diameter). The sorted sediment fractions from PI-GSF were examined using electron microscopy to obtain size distribution and the results showed a variation in particle size distribution between bay areas. When the collected particle fractions were examined for size dependent levels of PCDD/Fs, the concentrations of total PCDD/Fs were shown to be much greater for samples collected close to heavy industry complexes than sedi- ments from bay areas without major industry. Key Words: SPLITT; Gravitational SPLITT fractionation; Marine sediment; Size characterization; Dioxin; PCDD/Fs; Size dependent distribution of PCDD/Fs; Received: October 10, 2004; revised: December 12, 2004; accepted: December 28, 2004 DOI 10.1002/jssc.200401945 1 Introduction Contamination of the aquatic environment with highly toxic materials such as polychlorinated dibenzo-p-dioxins and dibenzofurans (PCDD/Fs) as well as air pollution has been of increasing concern to the government, public, and scientists [1 – 4]. Due to the strong hydrophobicity, low solubility in water, and stability towards natural decompo- sition, these chemical substances which are generated mostly from combustion processes are reported to accu- mulate in the surface of aquatic sediments [3, 4]. More- over, this can lead to the bioaccumulation of toxic materi- als in fish through the food chain and eventually in humans [5, 6]. Since these substances are adsorbed at the sediment surface, the size-related pattern and con- centration of non-polar organic contaminants such as PCDD/Fs contained in sediments are essential to assess the origin and the pathways of pollutants in the aquatic environment. Gravitational split-flow thin fractionation (gravitational SPLITT fractionation or GSF), a group of continuous and rapid fractionation techniques for sorting particles, cells, and macromolecules, in which separation is carried out in a thin rectangular channel with splitters located at both the channel inlet and the outlet [7 – 9]. A side view of SPLITT channel resembles Figure 1 except for the inlet splitter (the figure is slightly modified for the pinched inlet channel that will be explained at below). In a typical SPLITT chan- nel, suspended particles are continuously fed in to the upper inlet while a relatively high speed carrier stream is introduced through the lower inlet of the channel. When particles encounter the carrier stream after leaving the inlet splitter, they are expected to be immediately pushed toward the upper wall of the channel and begin migrating toward the channel outlets. GSF utilizes the force of grav- ity to differentiate particles in a direction perpendicular to the longitudinal channel axis according to particle settling velocity [10 – 12]. When using gravity, particles start set- tling across the channel simultaneously while they are migrating along the channel. This results in an elution of particles larger than a certain mass or diameter at the lower outlet of the channel and a residue of smaller mass or diameter at the upper outlet. The cut-off diameter, d c , in GSF is related to channel dimensions and flow rates employed by [9, 10] d c ¼ ffiffiffiffiffiffiffiffiffiffiffiffiffiffiffiffiffiffiffiffiffiffiffiffiffiffiffiffiffiffiffiffiffiffiffiffiffiffiffiffiffiffiffiffiffiffiffiffiffi 18 gð _ V ðaÞ 0:5 _ V ða9ÞÞ bLGðq p qÞ s ð1Þ where g is the viscosity of carrier fluid, b the channel breadth, L the channel length, G the gravitation, q p the par- Correspondence: Meong Hee Moon, Department of Chemistry, Yonsei University, Seoul, 120 – 749, Korea. Phone: +82 2 2123 5634. Fax: +82 2 364 7050. E-mail: [email protected].
Transcript
J. Sep. Sci. 2005, 28, 373–379 www.jss-journal.de i 2005WILEY-VCH Verlag GmbH&Co. KGaA,Weinheim
Original
Pap
er
Moon, Kim, Jung, Lee, Chang 373
MyeongHeeMoon1
Hyun-Joo Kim1
Young-Ok Jung2
Se-Jin Lee3,Yoon-Seok Chang3
1Department of Chemistry, YonseiUniversity, Seoul, 120-749,Korea
2Department of Chemistry, PusanNational University, Pusan,609-735, Korea
3School of Environmental Science& Engineering, PohangUniversity of Science &Technology, Pohang, 790-784,Korea
Size fractionation ofmarine sediments by pinchedinlet gravitational split-flow thin fractionation andthe study of size dependent PCDD/Fsconcentrations from different bay areas
Pinched inlet gravitational split-flow thin fractionation (PI-GSF) has been applied tothe continuous size fractionation of marine sediments in order to study the differencein sediment size distribution and the concentration of PCDD/Fs contained in differentparticle sizes. A PI-GSF channel, known to improve the separation efficiency byreducing the sample inlet thickness, was utilized to fractionate sediments collectedfrom three different bay areas (Geoje, Ulsan, and Pohang) in Korea into 5 differentsub-populations (a2.0, 2.0–5.0, 5.0–10, 10–20, 20–63 lm in diameter). The sortedsediment fractions from PI-GSF were examined using electron microscopy to obtainsize distribution and the results showed a variation in particle size distributionbetween bay areas. When the collected particle fractions were examined for sizedependent levels of PCDD/Fs, the concentrations of total PCDD/Fs were shown to bemuch greater for samples collected close to heavy industry complexes than sedi-ments from bay areas without major industry.
Key Words: SPLITT; Gravitational SPLITT fractionation; Marine sediment; Size characterization;Dioxin; PCDD/Fs; Size dependent distribution of PCDD/Fs;
Received: October 10, 2004; revised: December 12, 2004; accepted: December 28, 2004
DOI 10.1002/jssc.200401945
1 Introduction
Contamination of the aquatic environment with highlytoxic materials such as polychlorinated dibenzo-p-dioxinsand dibenzofurans (PCDD/Fs) as well as air pollution hasbeen of increasing concern to the government, public, andscientists [1–4]. Due to the strong hydrophobicity, lowsolubility in water, and stability towards natural decompo-sition, these chemical substances which are generatedmostly from combustion processes are reported to accu-mulate in the surface of aquatic sediments [3, 4]. More-over, this can lead to the bioaccumulation of toxic materi-als in fish through the food chain and eventually inhumans [5, 6]. Since these substances are adsorbed atthe sediment surface, the size-related pattern and con-centration of non-polar organic contaminants such asPCDD/Fs contained in sediments are essential to assessthe origin and the pathways of pollutants in the aquaticenvironment.
Gravitational split-flow thin fractionation (gravitationalSPLITT fractionation or GSF), a group of continuous andrapid fractionation techniques for sorting particles, cells,and macromolecules, in which separation is carried out in
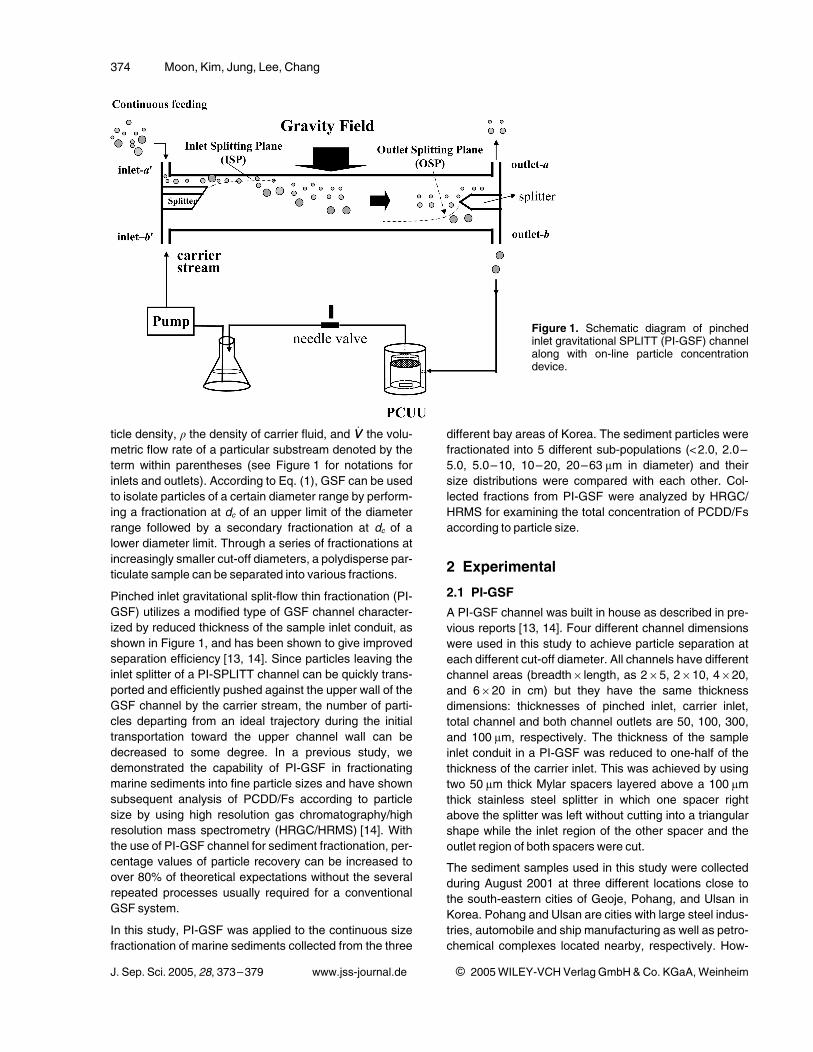
a thin rectangular channel with splitters located at both thechannel inlet and the outlet [7–9]. A side view of SPLITTchannel resembles Figure 1 except for the inlet splitter(the figure is slightly modified for the pinched inlet channelthat will be explained at below). In a typical SPLITT chan-nel, suspended particles are continuously fed in to theupper inlet while a relatively high speed carrier stream isintroduced through the lower inlet of the channel. Whenparticles encounter the carrier stream after leaving theinlet splitter, they are expected to be immediately pushedtoward the upper wall of the channel and begin migratingtoward the channel outlets. GSF utilizes the force of grav-ity to differentiate particles in a direction perpendicular tothe longitudinal channel axis according to particle settlingvelocity [10–12]. When using gravity, particles start set-tling across the channel simultaneously while they aremigrating along the channel. This results in an elution ofparticles larger than a certain mass or diameter at thelower outlet of the channel and a residue of smaller massor diameter at the upper outlet. The cut-off diameter, dc, inGSF is related to channel dimensions and flow ratesemployed by [9, 10]
ticle density, q the density of carrier fluid, and _VV the volu-metric flow rate of a particular substream denoted by theterm within parentheses (see Figure 1 for notations forinlets and outlets). According to Eq. (1), GSF can be usedto isolate particles of a certain diameter range by perform-ing a fractionation at dc of an upper limit of the diameterrange followed by a secondary fractionation at dc of alower diameter limit. Through a series of fractionations atincreasingly smaller cut-off diameters, a polydisperse par-ticulate sample can be separated into various fractions.
Pinched inlet gravitational split-flow thin fractionation (PI-GSF) utilizes a modified type of GSF channel character-ized by reduced thickness of the sample inlet conduit, asshown in Figure 1, and has been shown to give improvedseparation efficiency [13, 14]. Since particles leaving theinlet splitter of a PI-SPLITT channel can be quickly trans-ported and efficiently pushed against the upper wall of theGSF channel by the carrier stream, the number of parti-cles departing from an ideal trajectory during the initialtransportation toward the upper channel wall can bedecreased to some degree. In a previous study, wedemonstrated the capability of PI-GSF in fractionatingmarine sediments into fine particle sizes and have shownsubsequent analysis of PCDD/Fs according to particlesize by using high resolution gas chromatography/highresolution mass spectrometry (HRGC/HRMS) [14]. Withthe use of PI-GSF channel for sediment fractionation, per-centage values of particle recovery can be increased toover 80% of theoretical expectations without the severalrepeated processes usually required for a conventionalGSF system.
In this study, PI-GSF was applied to the continuous sizefractionation of marine sediments collected from the three
different bay areas of Korea. The sediment particles werefractionated into 5 different sub-populations (a2.0, 2.0–5.0, 5.0–10, 10–20, 20–63 lm in diameter) and theirsize distributions were compared with each other. Col-lected fractions from PI-GSF were analyzed by HRGC/HRMS for examining the total concentration of PCDD/Fsaccording to particle size.
2 Experimental
2.1 PI-GSF
A PI-GSF channel was built in house as described in pre-vious reports [13, 14]. Four different channel dimensionswere used in this study to achieve particle separation ateach different cut-off diameter. All channels have differentchannel areas (breadth6length, as 265, 2610, 4620,and 6620 in cm) but they have the same thicknessdimensions: thicknesses of pinched inlet, carrier inlet,total channel and both channel outlets are 50, 100, 300,and 100 lm, respectively. The thickness of the sampleinlet conduit in a PI-GSF was reduced to one-half of thethickness of the carrier inlet. This was achieved by usingtwo 50 lm thick Mylar spacers layered above a 100 lmthick stainless steel splitter in which one spacer rightabove the splitter was left without cutting into a triangularshape while the inlet region of the other spacer and theoutlet region of both spacers were cut.
The sediment samples used in this study were collectedduring August 2001 at three different locations close tothe south-eastern cities of Geoje, Pohang, and Ulsan inKorea. Pohang and Ulsan are cities with large steel indus-tries, automobile and ship manufacturing as well as petro-chemical complexes located nearby, respectively. How-
J. Sep. Sci. 2005, 28, 373–379 www.jss-journal.de i 2005WILEY-VCH Verlag GmbH&Co. KGaA,Weinheim
Figure 1. Schematic diagram of pinchedinlet gravitational SPLITT (PI-GSF) channelalong with on-line particle concentrationdevice.
Size fractionation of marine sediments 375
ever, Geoje city does not have such heavy industries. Forsediment collection, a core sampler was employed to col-lect surface sediments (ca. 10 cm in depth). Sedimentcores collected were stored in a refrigerator until fractiona-tion. For SPLITT fractionation, the crude sediments weredefrosted, dried at 1058C, and the density value of eachbay sample was measured as 2.3, 2.3, and 2.2 g/cm3, forGeoje, Pohang, and Ulsan, respectively. Density meas-urement was performed with a pycnometer. About 20–30 g of dried sediment sample was suspended in carrierliquid containing 0.1% FL-70, a mixture of non-ionic andanionic surfactants from Fisher Scientific (Fairlawn, NJ,USA), and 0.02% NaN3 as a bactericide. Sediment slurrywas initially separated with a 270-mesh sieve (ca. 63 lmin pore size). After sieve fractionation, collected particlessmaller than 63 lm were adjusted in about 1.0% (w/v)solution, and were then subjected to PI-GSF. The solutionused for sieving was filtered through a membrane filterhaving a pore diameter of 0.2 lm, and was re-used for thecarrier solution of PI-GSF runs.
The flow rate conditions selected for each cut-off diameterare listed in Table 1 along with the channel dimensionsused for each fractionation. The theoretical relationshipbetween cut-off diameter and flow rate conditions can befound in the literature [9, 13, 14]. In every fractionationstep (corresponding to each different cut-off diameter), atwo stage fractionation procedure was used: a rough cutat a relatively high feed rate followed by a precision cut ata low feed rate by re-injecting the collected particle sus-pension. The flow rate values in parenthesis listed inTable 1 were those used for precision fractionation.
Particle suspension was delivered to the pinched inlet,sample inlet-a 9 of PI-GSF channel (shown in Figure 1),with the aid of a Minipulse3 peristaltic pump from Gilson(Villers-le-Vel, France).
The carrier liquid was pumped through the inlet-b 9 byusing an FMI lab pump from Fluid Metering, Inc. (Oyster-bay, NY, USA). Feed concentrations were maintained at1.0% (w/v) for the initial rough cut and 0.5% (w/v) for theprecision cut. Particles eluted from the GSF outlet-b werecollected with an on-line connected PCUU (particle con-
centrator with upstream ultrafiltration), and the filtratesolution was directed to a carrier reservoir for circulation,as shown in Figure 1. For particle concentration, a mem-brane having a pore diameter of 1.0 lmwas placed insidethe PCUU and the solution inside the PCUU was stirredusing a magnetic bar to maintain a tangential flow duringfiltration. Constructional details of a PCUU can be found inthe literature [9]. To control flow rates at both outlets, afine metering valve (a needle valve) from Crawford FittingCo. (Solon, OH) was placed at the upper outlet of thePCUU. Particles collected during the GSF run were exam-ined using a S-4200 scanning electron microscope fromHitachi Ltd. (Tokyo, Japan). Particle size measurementand counting were ensured for at least 300 particles fromeach fraction.
2.2 PCDD/Fs analysis
The U.S.EPA method 1613 was used to prepare samplesfor the PCDD/Fs analysis. Each marine sediment fractioncollected from PI-GSF was dried and spiked with 1 ng ofinternal standards, a mixture of 13C12-labeled PCDD/F,from Wellington Laboratory (Ontario, Canada) and wasthen extracted for 16 h using toluene under glass Soxhletthimbles. Each extract was washed with sulfuric acid untilcolorless and then with distilled water saturated with hex-ane for neutralization. Sample purification using a multi-layer silica column as described in earlier work [14] wascarried out. Finally, all the samples were concentratedwith N2 gas and 1 ng of 13C12-labeled PCDD/F recoverystandard mixture was added. The PCDD/Fs measure-ment was performed with a model 6890 HRGC from Hew-lett-Packard (Palo Alto, CA, USA), interfaced with a model700T HRMS from Jeol (Tokyo, Japan). A DB-5MS column(60 m60.25 mm-ID60.25 lm in film thickness) wasemployed with a temperature program; an initial tempera-ture of 1408C for 4 min, a linear ramp of 15 K/min to an iso-thermal hold of 2208C for 3 min, another ramp of 1.5 K/min to an isothermal hold of 2408C for 3 min, and a finalramp of 4 K/min to an isothermal hold of 3108C for 6 min.For HRMS anaylsis, a SIM (single ion monitoring) methodwas employed under positive EI conditions set at 38 eV
J. Sep. Sci. 2005, 28, 373–379 www.jss-journal.de i 2005WILEY-VCH Verlag GmbH&Co. KGaA,Weinheim
Table 1. Experimental flow rate conditions of PI-GSF for three different bay sediment samples. For all cases, _VV ðaÞ ¼ _VV ðb 9Þ and_VV ða9Þ ¼ _VV ðbÞ.
with a resolution over 10 000. Selection of PCDD/Fspeaks was made for those having isotope ratios within15% of theoretical values and having a signal-to-noiseratio larger than 2.5 simultaneously. The recovery rangeof 13C12-labeled PCDD/F internal standards was 50–120%, meeting protocols of EPAmethod 1613.
3 Results and discussionSize fractionation of sediment particles using PI-GSF wascarried out at four different steps which utilized differentPI-GSF channels and flow rates needed for each desiredcut-off diameter. Sediment samples were initiallyscreened by mechanical sieve (pore size of 63 lm) andparticles smaller than 63 lm in diameter were subjectedto SPLITT fractionation. Figure 2 shows the electronmicrographs of sediment fractions (collected from Geojebay) separated by PI-GSF. At the beginning, sievescreened sediments were fractionated using a PI-GSFchannel of the smallest dimension (265 cm) listed inTable 1 at a feed rate, _VV ða9Þ, of 2.0 mL/min along with acarrier flow rate of 18.0 mL/min. These flow rate condi-tions are designed to fractionate sediment particles intotwo fractions at a cut-off diameter of 20 lm. During thefirst rough fractionation at a relatively high feed rate, col-lected sediments at the outlet b (presumed to be largerthan 20 lm) were concentrated by using a PCUU on-lineand the suspension concentration was adjusted to about
0.5% (w/v). This was re-injected to PI-GSF at a reducedfeed rate (= 1.0 mL/min) for precision fractionation but thecut-off diameter was set the same by adjusting the carrierflow rate to 17.5 mL/min. The micrograph of the fraction1b in Figure 2 was obtained for the sediment particlesafter the precision fractionation step. Particles collected atoutlet-a in the same fractionation stage (smaller than20 lm for the first PI-GSF step) were mixed together, andwere concentrated to about 1.0% (w/v) for the next frac-tionation step at a cut-off diameter of 10 lm. The sameprocedure was applied for the fractionation at cut-offdiameters of 5 and 2 lm, consecutively, and the collectedparticle fractions (1b, 2b, 3b, 4b, and 4a) were stored forPCDD/Fs analysis. Figure 2 shows that micrographs offractions 1b–4b appear to be larger than their corre-sponding cut-off diameters except for a few large particlesthat are mostly flat. Appearance of such large particles(larger than the upper diameter limit in each fraction) isthought to originate from the contamination from the pre-vious fractionation stage since flat particles tend to belifted away from the channel wall during migration due tothe role of hydrodynamic lift forces. However, except forthe small number of exceptionally large flat particles, mostparticles that appeared in the micrographs indicated thatsize fractionations were achieved well. Since densitymeasurement was performed with each sediment samplebefore PI-GSF fractionation, a possible deviation in parti-cle elution from ideality can be incurred if there is a varia-
J. Sep. Sci. 2005, 28, 373–379 www.jss-journal.de i 2005WILEY-VCH Verlag GmbH&Co. KGaA,Weinheim
Figure 2. Electron micrographs of particle fractions for Geoje sediment sampleobtained by four sequential PI-GSF runs. Flow rate conditions for each fractionationare listed in Table 1. Fractions of 1b, 2b, 3b, 4b, and 4a were examined for PCDD/Fsconcentration.
Size fractionation of marine sediments 377
tion in density of sediment particles according to sizes.This could be one of the limitations in GSF experimentssince the entire separation process is performed in liquidsolution. By measuring apparent sizes of more than 300particles for each fraction, particle size distribution wasplotted for each fraction as shown in Figure 3. In the caseof sediments collected fromGeoje bay, plots for each frac-tion in Figure 3 show about 80–85% of particles in num-ber are found to be sorted out at each fractionation stageusing PI-GSF. This means the number percentage recov-ery for each fraction is at least above 80%, which is similarto the reports in earlier studies [12, 14].
The same fractionation process was performed with twoother sediment samples: Ulsan and Pohang bay samples(electron micrographs of fractions are shown here). Thenumber percentage results measured for all of the frac-tions are listed in Table 2.a. The percentage values largerthan each corresponding cut-off diameter were found tobe greater than 80%, and those of the fractions 4a (smal-ler than 2 lm) from the three different locations weregreater than about 94%. In Figure 4.b, average diameter
values with standard deviation measured for each fractionare listed. Larger diameter fractions appear to have alarge standard deviation as the diameter range of fractionis larger. According to the measured data, the averagediameter fitted well with the size interval expected fromtheoretical calculations. All fractions were dried to mea-sure the weight of particles collected. The measuredweight of each fraction was compared in each particlesize range for the three different bay locations inTable 2.b. These values are plotted as a relative weightpercentage against the particle diameters in Figure 4.a.This shows that more than 40% of the Geoje bay sedimentsample by weight is smaller than 2.0 lm and the weight ofthe fraction increases as particle size decreases. Thismeans that the population of smaller particles (smallerthan 2 lm) is dominant among the sizes. While the Ulsanbay sediment sample shows the largest fractional weightfor the fraction 4b (2–5 lm), the Pohang sample appearsto have a similar weight distribution throughout the frac-tions. In Figure 4.a, about 69% of Geoje and 55% of Ulsansediment sample were found to be smaller than 5 lm;however, only 32% of the particles appear to fall in this
J. Sep. Sci. 2005, 28, 373–379 www.jss-journal.de i 2005WILEY-VCH Verlag GmbH&Co. KGaA,Weinheim
Figure 3. Size distribution of each collected fraction measured by microscopic examination. At leastabout 300 particles were counted for each fraction.
378 Moon, Kim, Jung, Lee, Chang
range for the Pohang sample. The difference in the rela-tive weight distribution is expected to be due to the geo-graphical differences along with the different ocean cur-rents.
The concentration of total PCDD/Fs for the collected frac-tions were analyzed by HRGC/HRMS and the measuredconcentrations (on the pg/g scale) of PCDD/Fs are listedin Table 3. As expected from a previous study [14], thegeneral tendency of the concentration to increases withdecreasing particle size was found in all samples due tothe increase of surface area for smaller particles. It is evi-dent that the PCDD/Fs concentration of the Pohang sam-ple was higher throughout the particle sizes than thosefrom the other two sites. Moreover, the total PCDD/Fs
concentrations of Pohang sediments smaller than 10 lmappeared to be much greater than those of the same sizerange of other samples. Since the two sediment samples(Pohang and Ulsan) were obtained from the bay area sur-rounded by a number of industrial complexes such assteel industry (Pohang), and the automobile and shipmanufacturing and petrochemical complexes (Ulsan) inKorea, the possible sources of these pollutants will bedifferent from each other and they are complex. However,the sediment sample from Geoje, an island located to thesouth-east of the Korean peninsular, is away from heavyindustry. Moreover, it is found that a maximum concentra-tion lies in the diameter range of 2–5 lm while the othertwo samples show their maximum concentrations in parti-cles smaller than 2 lm. While the concentrations from
J. Sep. Sci. 2005, 28, 373–379 www.jss-journal.de i 2005WILEY-VCH Verlag GmbH&Co. KGaA,Weinheim
Table 2. a) The number percentage values of collected particles for each fraction among three different bay and b) measuredaverage diameter value with standard deviation, and c) weight of sediment particles in each fraction obtained by PI-GSF.a)
FractionNo.
dc
[lm]Expectedsize range
[lm]
Number percentage [%]
Geoje bay Ulsan bay Pohang bay
Adc adc Adc adc Adc adc
1b 20 20 to 63 84.3 15.7 87.0 13.0 82.0 18.0
2b 10 10 to 20 83.1 16.9 85.7 14.3 83.5 16.5
3b 5.0 5.0 to 10 84.1 15.9 84.8 15.2 80.7 19.3
4b 2.0 2.0 to 5.0 80.3 19.7 86.7 13.3 81.0 19.0
4a 2.0 a 2.0 6.1 93.9 5.3 94.7 0.1 99.9
b)FractionNo.
dc
[lm]Expectedsize range
[lm]
Average diameter [lm]
Geoje bay Ulsan bay Pohang bay
1b 20 20 to 63 24.7 l 8.2 26.7 l 8.7 25.0 l 10.9
2b 10 10 to 20 13.8 l 4.9 14.7 l 5.5 16.6 l 5.5
3b 5.0 5.0 to 10 8.0 l 3.3 7.5 l 3.4 6.7 l 2.2
4b 2.0 2.0 to 5.0 2.9 l 1.3 2.5 l 0.8 2.3 l 0.8
4a 2.0 a 2.0 1.4 l 0.6 1.0 l 0.5 0.8 l 0.4
c)FractionNo.
dc
[lm]Expectedsize range
[lm]
Weight [g]
Geoje bay Ulsan bay Pohang bay
total 30.0 20.0 20.0
sieve >63 0.5 0.8 1.8
sieve a63 29.5 19.2 18.2
1b 20 20 to 63 2.4 1.2 4.5
2b 10 10 to 20 2.1 2.8 3.5
3b 5.0 5.0 to 10 4.0 4.2 3.9
4b 2.0 2.0 to 5.0 7.6 8.5 3.0
4a 2.0 a 2.0 13.4 2.5 3.3
Size fractionation of marine sediments 379
different bay areas are significantly different from eachother, the relative concentrations in particles show a simi-larity among the samples. Plotting of the relative amountof total PCDD/Fs as in Figure 4.b shows that particlessmaller than 5 lm contain about 65, 47, and 58% of thetotal PCDD/Fs contained in Geoje, Ulsan, and Pohangbay samples, respectively. This suggests that more than50% of total PCDD/Fs are contained in the fine particlesizes smaller than 5 lm.
This study demonstrates the possible use of PI-GSF forthe continuous separation of marine sediments into fineparticle sizes and the subsequent analysis of PCDD/Fsconcentrations. Examinations of homologue patterns andthe distribution of PCDD/Fs as well as analysis of organiccarbons are not reported in detail here but will be coveredin a future article about environmental assessments. Thiscurrent experiment was not intended to examine a series
of sediment samples collected from various locations ineach bay area, and the results shown in this study repre-sent only the contamination level of each specific locationwhere a sediment core was sampled. However, the datashow that there are considerable differences in particlesizes and degree of contamination among the bay areaslocated in the south-east of the Korean Peninsular. Whenindustrial complexes are located in large urban areas, thecontamination of sediments with PCDD/Fs was found toshow significant differences depending on sampling loca-tions.
Acknowledgments
This study was supported by the KOSEF (Korea Science& Engineering Foundation) Fund 1999-2-124-001-5.
References[1] G. Witt, K.W. Schramm, B. Henkelmann, Organohalogen
Comp. 1996, 29, 132–135.[2] W.Z. Wu, Q.H. Zhang, K.-W. Schramm, Y. Xu, A. Kettrup,
J. Sep. Sci. 2005, 28, 373–379 www.jss-journal.de i 2005WILEY-VCH Verlag GmbH&Co. KGaA,Weinheim
Figure 4. Relative weight percentage (a) and the fraction oftotal PCDD/Fs (b) for the three bay sediments plottedagainst the size range of each collected fraction.
Table 3. Comparison of total PCDD/Fs measured from eachsize fraction of sediment samples.