Importance of a stochastic distribution of floods and erosion thresholds in the bedrock river incision problem Noah P. Snyder 1 and Kelin X. Whipple Department of Earth, Atmospheric and Planetary Sciences, Massachusetts Institute of Technology, Cambridge, Massachusetts, USA Gregory E. Tucker School of Geography and the Environment, University of Oxford, Oxford, UK Dorothy J. Merritts Geosciences Department, Franklin and Marshall College, Lancaster, Pennsylvania, USA Received 19 November 2001; revised 16 July 2002; accepted 27 September 2002; published 22 February 2003. [1] Fluvial erosion of bedrock occurs during occasional flood events when boundary shear stress exceeds a critical threshold to initiate incision. Therefore efforts to model the evolution of topography over long timescales should include an erosion threshold and should be driven by a stochastic distribution of erosive events. However, most bedrock incision models ignore the threshold as a second-order detail. In addition, climate is poorly represented in most landscape evolution models, so the quantitative relationship between erosion rate and measurable climatic variables has been elusive. Here we show that the presence of an erosion threshold, when combined with a well-constrained, probabilistic model of storm and flood occurrence, has first-order implications for the dynamics of river incision in tectonically active areas. First, we make a direct calculation of the critical shear stress required to pluck bedrock blocks for a field site in New York. Second, we apply a recently proposed stochastic, threshold, bedrock incision model to a series of streams in California, with known tectonic and climatic forcing. Previous work in the area has identified a weak relationship between channel gradient or relief and rock uplift rate that is not easily explained by simpler detachment-limited models. The results with the stochastic threshold model show that even low erosion thresholds, which are exceeded in steep channels during high-frequency flood events, fundamentally affect the predicted relationship between gradient and uplift rate in steady state rivers, in a manner consistent with the observed topography. This correspondence between theory and data is, however, nonunique; models in which a thin alluvial cover may act to inhibit channel incision in the low uplift rate zone also provide plausible explanations for the observed topography. Third, we explore the broader implications of the stochastic threshold model to the development of fluvial topography in active tectonic settings. We suggest that continued field applications of geomorphic models, including physically meaningful thresholds and stochastic climate distributions, are required to advance our knowledge of interactions among surficial, climatic, and crustal processes. INDEX TERMS: 1815 Hydrology: Erosion and sedimentation; 1824 Hydrology: Geomorphology (1625); 1869 Hydrology: Stochastic processes; 8107 Tectonophysics: Continental neotectonics; KEYWORDS: tectonic geomorphology, erosion, bedrock channels, relief, thresholds, stochastic processes Citation: Snyder, N. P., K. X Whipple, G. E. Tucker, and D. J. Merritts, Importance of a stochastic distribution of floods and erosion thresholds in the bedrock river incision problem, J. Geophys. Res., 108(B2), 2117, doi:10.1029/2001JB001655, 2003. 1. Introduction [2] Numerous recent field, laboratory, and modeling efforts have been devoted to understanding rates and processes of bedrock-river incision [Howard and Kerby , 1983; Willgoose et al., 1991; Sklar and Dietrich, 1998; Tinkler and Wohl, 1998; Stock and Montgomery , 1999; Snyder et al., 2000; Whipple et al., 2000a], with the goal of understanding the evolution of topography in response to tectonic and climatic forcings. At a fundamental level, all research efforts indicate that bedrock incision rate is set by channel gradient, among other factors. Much debate centers on the exact nature of the quantitative relationship JOURNAL OF GEOPHYSICAL RESEARCH, VOL. 108, NO. B2, 2117, doi:10.1029/2001JB001655, 2003 1 Now at U.S. Geological Survey Pacific Science Center, Santa Cruz, California, USA. Copyright 2003 by the American Geophysical Union. 0148-0227/03/2001JB001655$09.00 ETG 17 - 1
Transcript
Importance of a stochastic distribution of floods and erosion
thresholds in the bedrock river incision problem
Noah P. Snyder1 and Kelin X. WhippleDepartment of Earth, Atmospheric and Planetary Sciences, Massachusetts Institute of Technology, Cambridge,Massachusetts, USA
Gregory E. TuckerSchool of Geography and the Environment, University of Oxford, Oxford, UK
Dorothy J. MerrittsGeosciences Department, Franklin and Marshall College, Lancaster, Pennsylvania, USA
Received 19 November 2001; revised 16 July 2002; accepted 27 September 2002; published 22 February 2003.
[1] Fluvial erosion of bedrock occurs during occasional flood events when boundary shearstress exceeds a critical threshold to initiate incision. Therefore efforts tomodel the evolutionof topography over long timescales should include an erosion threshold and should bedriven by a stochastic distribution of erosive events. However, most bedrock incisionmodelsignore the threshold as a second-order detail. In addition, climate is poorly represented inmost landscape evolution models, so the quantitative relationship between erosion rateand measurable climatic variables has been elusive. Here we show that the presence of anerosion threshold, when combined with a well-constrained, probabilistic model of storm andflood occurrence, has first-order implications for the dynamics of river incision intectonically active areas. First, we make a direct calculation of the critical shear stressrequired to pluck bedrock blocks for a field site in New York. Second, we apply a recentlyproposed stochastic, threshold, bedrock incision model to a series of streams in California,with known tectonic and climatic forcing. Previous work in the area has identified aweak relationship between channel gradient or relief and rock uplift rate that is not easilyexplained by simpler detachment-limited models. The results with the stochastic thresholdmodel show that even low erosion thresholds, which are exceeded in steep channels duringhigh-frequency flood events, fundamentally affect the predicted relationship betweengradient and uplift rate in steady state rivers, in a manner consistent with the observedtopography. This correspondence between theory and data is, however, nonunique; modelsin which a thin alluvial cover may act to inhibit channel incision in the low uplift rate zonealso provide plausible explanations for the observed topography. Third, we explore thebroader implications of the stochastic threshold model to the development of fluvialtopography in active tectonic settings. We suggest that continued field applications ofgeomorphic models, including physically meaningful thresholds and stochastic climatedistributions, are required to advance our knowledge of interactions among surficial,climatic, and crustal processes. INDEX TERMS: 1815 Hydrology: Erosion and sedimentation; 1824
Citation: Snyder, N. P., K. X Whipple, G. E. Tucker, and D. J. Merritts, Importance of a stochastic distribution of floods and erosion
thresholds in the bedrock river incision problem, J. Geophys. Res., 108(B2), 2117, doi:10.1029/2001JB001655, 2003.
1. Introduction
[2] Numerous recent field, laboratory, and modelingefforts have been devoted to understanding rates and
processes of bedrock-river incision [Howard and Kerby,1983; Willgoose et al., 1991; Sklar and Dietrich, 1998;Tinkler and Wohl, 1998; Stock and Montgomery, 1999;Snyder et al., 2000; Whipple et al., 2000a], with the goalof understanding the evolution of topography in responseto tectonic and climatic forcings. At a fundamental level,all research efforts indicate that bedrock incision rate isset by channel gradient, among other factors. Much debatecenters on the exact nature of the quantitative relationship
1Now at U.S. Geological Survey Pacific Science Center, Santa Cruz,California, USA.
Copyright 2003 by the American Geophysical Union.0148-0227/03/2001JB001655$09.00
ETG 17 - 1
between gradient and incision rate, and the relative im-portance of channel width, substrate lithology and sedi-ment flux. At steady state (rock uplift rate balanced byincision rate), in general, steeper channels correlate withhigher uplift rates. Moreover, because channel gradientsets drainage basin topographic relief, steady state fluvialrelief correlates positively with uplift rate [e.g., Whippleand Tucker, 1999]. Therefore well-constrained bedrockincision models will allow us to make predictions andtest hypotheses about the development of relief in tectoni-cally active areas.[3] Models based on bed shear stress [Howard and
Kerby, 1983; Willgoose et al., 1991; Stock and Mont-gomery, 1999; Snyder et al., 2000] typically have madethe simplifying assumption (either explicitly or implicitly)that bedrock erosion occurs during major flood events[Baker and Kale, 1998] when boundary shear stress is fargreater than the threshold value necessary to initiateincision, and that therefore the threshold term can beneglected. However, a recent analysis using stochastic,threshold erosion theory [Tucker and Bras, 2000] revealsthat this assumption leads to physically unrealistic behav-ior, with the least variable climate producing the highesterosion rates. This runs counter to the assumption used tojustify ignoring the threshold term, and counter to thehypothesis that erosion is more efficient in stormierclimates [Molnar and England, 1990; Bull, 1991; Peizhenet al., 2001]. Motivated by this observation, here we (1)make a direct estimate of the critical shear stress requiredto initiate incision by joint block plucking on the bed ofa river in New York and (2) investigate the implicationsof the Tucker and Bras model [Tucker and Bras, 2000;G.E. Tucker, Drainage basin sensitivity to tectonic andclimatic forcing: Implications of a stochastic model forthe role of entrainment and erosion thresholds, EarthSurface Processes and Landforms, submitted, 2002, here-inafter referred to as Tucker, submitted manuscript, 2002]for the development of topography in orogenic settings,including an application of the model to a well-con-strained field location in northern California [Merrittsand Bull, 1989; Merritts and Vincent, 1989; Snyder etal., 2000, 2003]. Inclusion of these two approacheshighlights the importance of thresholds in fluvial erosion,at the level of individual floods and as part of adistribution of events. Here we extend the analysis ofTucker and Bras [2000] to elucidate broader tectonicimplications of the stochastic threshold model, withemphasis on the relationship between steady state fluvialrelief and rock uplift rate. These model predictions aresupported by data from the California study. This corre-spondence is nonunique, however, and other explanationsof the observed relief contrast are discussed. We alsoinvestigate the theoretical implications of the stochasticthreshold model to settings with spatially variable rockuplift rate [Kirby and Whipple, 2001]. Through applica-tion of surface process models to well-constrained fieldsettings, we can begin to bridge the gap between ourunderstanding of erosion driven by individual floods(e.g., our analysis in New York) that are part of astochastic distribution of events [Benda and Dunne,1997], and our understanding of erosion rates over geo-logic timescales (e.g., our analysis in California) that are
central to efforts to model crustal and atmosphericinteractions [Willet, 1999].
2. Threshold Shear Stress For Plucking
[4] Many workers [e.g., Howard and Kerby, 1983;Howard et al., 1994; Whipple and Tucker, 1999] havepostulated that bedrock-river incision rate (E) is a powerlaw function of boundary shear stress (tb) above a threshold(or critical) shear stress (tc):
E ¼ ke tb � tcð Þa ð1aÞ
or
E ¼ ke tab � tac� �a ð1bÞ
where ke is a coefficient of erosion dependent on lithologicresistance and erosion process and a is an exponentdependent on erosion process. Equation (1a) is thecommonly used ‘‘excess shear stress’’ form. Equation (1b)is similar, equally defensible, and more tractable in someapplications (Tucker, submitted manuscript, 2002).[5] In the case where incision rates are set by plucking
of intact blocks along joint or fracture planes, Whipple etal. [2000a] argued that the value of a in equation (1)should be unity, or slightly higher. In their treatment, otherhypothesized incision processes (abrasion, cavitation)likely have higher values of a. Here, we consider valuesof a from 1 to 10/7, consistent with field observations thatplucking (in the sense defined by Whipple et al. [2000a])is the dominant process in the rivers studied. This situationapplies to areas with rocks that are sufficiently fractured toallow fluvial transport of exposed blocks, particularlyappropriate when bedrock either (1) is highly fractured( joint spacing 0.1 to 1 m), or (2) breaks into blocks with asmall height-to-length ratio [Whipple et al., 2000a]. Impor-tantly, most previous analyses of incision by pluckingprocesses have acknowledged or even emphasized theimportance of tc [e.g., Baker and Kale, 1998; Hancocket al., 1998; Howard, 1998; Whipple et al., 2000a]. Onelimitation of the approach in equation (1) is that it doesnot take into account the role that sediment flux andsediment supply (with associated stochastic distributionsand transport threshold) might play in driving incision ofbedrock [Howard, 1980; Beaumont et al., 1992; Sklar andDietrich, 1998; Whipple and Tucker, 2002].[6] The threshold term (tc) must, at a minimum, equal the
shear stress necessary to transport coarse bedload in a givenriver system. Bedload transport is known to be a threshold-dependent process [e.g., Gomez and Church, 1989; Buffing-ton and Montgomery, 1997], and if it is not in motion, thebed material will protect the channel floor from erosion[Sklar and Dietrich, 1998; Whipple and Tucker, 2002]. Insettings with resistant bedrock, tc may be set by theproperties of substrate lithology, in this case the thresholdfor incision likely exceeds the tc appropriate for sedimenttransport.[7] Boundary shear stress (tb) can be estimated from field
data. Assuming steady, uniform flow, tb is approximated bythe product of depth (d ) and slope (S ):
tb ¼ rgdS; ð2Þ
ETG 17 - 2 SNYDER ET AL.: FLOODS AND THRESHOLDS IN RIVER INCISION
where r is the density of water and g is gravitationalacceleration. Combining equation (2) with the Manningfriction relationship gives
tb ¼ rgN 3=5 Q
w
� �3=5
S7=10; ð3Þ
where Q is discharge, w is channel width, and N is theManning roughness coefficient. The value of tb given byequations (2) and (3) is the total boundary shear stress,including both skin friction and momentum losses due toform drag on bed or bank roughness elements. For themotion of large blocks, this inclusion of form dragcomponents is appropriate as the blocks themselves largelydetermine boundary roughness. The parameters in equations(2) and (3) needed to estimate tb can be measured from fieldand hydrologic data.[8] In contrast to tb, threshold shear stress (tc) is difficult
to evaluate from field or experimental data. We are aware ofno previous studies that actually calculate tc for bedrockincision, although measurements of tb clearly in excess oftc have been made for large paleofloods [Baker and Kale,1998]. Numerous workers (see review by Buffington andMontgomery [1997]) have studied the threshold for particlemotion in alluvial bed rivers, but these calculations are onlyrelevant to this of study bedrock channels in that theyprovide minimum estimates of tc. The case of sedimentmobilization on a noncohesive bed of similar sized particlesis quite different from the plucking of large joint blocks.Here we present two calculations of tc for incision ofbedrock. First, we apply field data from a 1981 flood eventin New York to equations (2) and (3) to get an estimate oftotal boundary shear stress during an observed pluckingevent. Second, we use data from a well-constrained fieldsite in northern California to back calculate the critical shearstress that best models an observed relationship betweenchannel gradient (and therefore topographic relief) and rockuplift rate [Snyder et al., 2000, 2003]. Because the method-
ologies, timescales, and geologic settings of these twoexamples are entirely different, these calculations are notcomparable to one another, but both demonstrate theimportance of erosion thresholds.
3. Estimation of Critical Shear Stress at FallCreek, Ithaca, New York
3.1. Setting[9] Fall Creek is major west flowing tributary of Cayuga
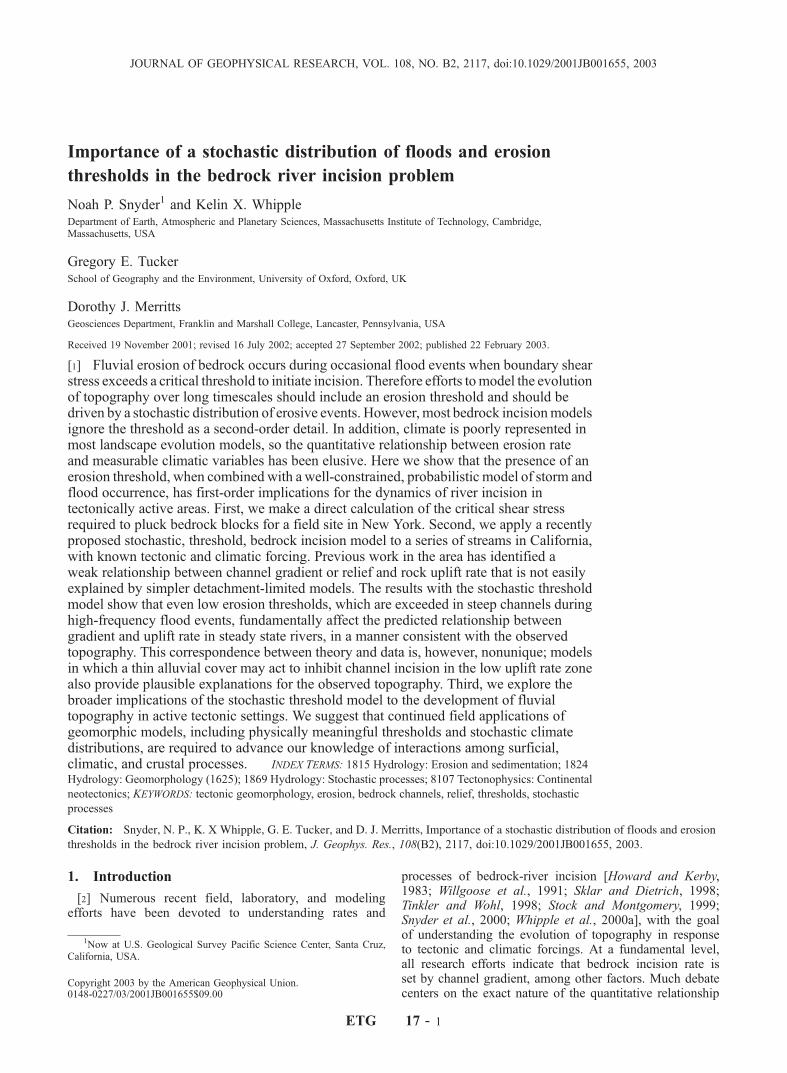
Lake at Ithaca, in the Finger Lakes region of central NewYork in the United States. The southern lobes of LakeOntario ice caps covered the region, and scoured out andoversteepened the lake basins [Mullins et al., 1996]. UpperFall Creek flows through a valley formerly occupied by aWisconsinan ice tongue. The retreating glacier left the valleyfilled with at least 35 m of poorly sorted sand and graveloverlain by till. The creek is actively incising through thisfill. Near the Cornell University campus, Fall Creek enters asteep bedrock gorge and drops about 200 m over severalwaterfalls before entering the southern end of Cayuga Lake.[10] The study site (Figure 1), locally known as ‘‘Flat
Rock,’’ is the farthest upstream section of bedrock-flooredchannel in Fall Creek, where the river is superposed on abedrock rib. This rock is much less erodible than the glacialdeposits upstream, and the site therefore dictates the baselevel for the rest of the creek (a drainage area of 326 km2).During the time since deglaciation (no more than 14 kyr[Mullins et al., 1996]), �2 vertical meters of bedrock havebeen eroded at Flat Rock, judging from strath terraceexposures. The 500-m study reach is located immediatelydownstream from a 1.5-m-high weir that is the water supplyintake point for Cornell University. The weir marks theuppermost exposed bedrock in Fall Creek.
3.2. Lithology
[11] The study reach is underlain by the Upper Devon-ian Ithaca Formation of shale, siltstone and thin-bedded
Figure 1. Location map for Flat Rock, Fall Creek study area. Base is the U.S. Geological Survey 7.5’Ithaca East, New York quadrangle, contour interval 10 feet (1 foot = 0.3 m). USGS stream-gaging stationused in this study is indicated by the black box on the west side of the map, �1 km downstream of thestudy reach. Inset map indicates position within New York state; bar represents 200 m of distance on thestudy area map.
SNYDER ET AL.: FLOODS AND THRESHOLDS IN RIVER INCISION ETG 17 - 3
(1–30 cm) sandstone. The rock is cut by multiple sets ofvertical joints spaced 1–4 m apart. Schmidt hammermeasurements on exposed joint planes yield a mean rockmass strength of 51.7 ± 6.8 R units (1s, n = 25); andmeasurements on subhorizontal bedding planes give 46.4± 8.5 R (n = 70). For information on the Schmidt hammermethodology used here, see Snyder et al. [2003].
3.3. The 28 October 1981 Flood Event
[12] Plucking of large bedrock slabs (up to 4 m long �2 m wide � 30 cm thick) from in-place positions on theriver bed occurred at Flat Rock during a major flood eventon 28 October 1981 (Figure 2). The flood was the resultof 2.6 cm of rain on 27 October and 12.9 cm on 28October, a 2-day storm total well above the Octobermonthly mean precipitation of 8.3 cm (Cornell University,Ithaca, New York, station data from the NortheastRegional Climate Center). The peak discharge (Qpk) meas-ured at the Fall Creek (Ithaca) gauging station �1 kmdownstream of the study reach (Figure 1) was 335 m3 s�1.This event was the second largest in the 75-year record at
this station (Qpk = 439 m3 s�1 on 8 July 1935). The 1981event was the only flood that caused significant pluckingof large blocks at Flat Rock in at least the past �40 years,as deduced from visual observations during annual visitsto the site with an undergraduate geomorphology classthroughout this period (A. L. Bloom, personal communi-cation, 2000). It significantly modified the morphology ofFlat Rock, a popular swimming spot, and washed outseveral bridges upstream.
3.4. Dominant Erosion Process
[13] We infer that plucking of bedding plane blocks is theimportant incision process in this location. Less dramaticerosion of bedrock, such as abrasive rounding of blockcorners, likely occurs frequently during smaller floodevents. However, this is the result of a fundamentallydifferent process than plucking of the large blocks thatcharacterize the bed. Interflood processes are undoubtedlyimportant in preparing large blocks for plucking. Theexistence of a critical threshold for plucking of bedrockblocks has been argued by numerous workers [e.g., Bakerand Kale, 1998; Hancock et al., 1998; Howard, 1998;Whipple et al., 2000a]. The low erosion rate in the fieldsetting (only �2 m in �14 kyr) further argues that eventscapable of removing blocks 30-cm-thick from any givenpoint on the bed are rare, although several such eventswould be required to lower the entire bed 30 cm. We cannotrule out highly nonlinear erosion processes (a � 1), but themajor modification of the field site that occurred during the1981 flood, combined with intrinsic properties of the jointedbedrock and theoretical physical considerations, argues thatthreshold plucking is the rate-limiting process in this fieldsite.
3.5. Methods
[14] We measured channel gradient (S ) for the studyreach, and estimated the flow depth (d ), and channelwidth (w) that occurred during the 1981 flood (Table 1).The latter two were obtained using field measurements atfour representative locations along the 0.5-km study reach.We used reference marks on photographs of the event(Figure 2a) to estimate flow conditions during the flood.Depth (d ) and width (w) were measured using a stadia rodand hand level (±20 cm), and laser range finder (±1 m),respectively. Because the channel bank on the north sidehas a series of terraces cut in glacial sediments, we madetwo estimates of w: high flow (to edge of the first northbank terrace) and valley width (the maximum widthpossible during the flood, based on photographs). BecauseS was the parameter most difficult to measure withprecision, we used three approximations of local watersurface slope during the event, all based on the bed slope.The first two (mean slope over the 0.5-km study reachand over the 100-m reach surrounding each width meas-urement station) were from a hand level and stadia rodfield survey of the channel bed, with 10-m horizontalspacing. The third slope measurement was from the USGS7.5’ Ithaca East quadrangle map. This estimate includesthe �1.5 m drop of the weir and is therefore a maximumestimate of the relevant slope over the reach. Finally,Manning’s roughness coefficient (N ) was estimated by
Figure 2. Photographs of the Fall Creek study area. (a) Aview east from the downstream end of the field area of alarge plucked block (�4 m in length) actively tumblingdownstream at Flat Rock, during the 28 October 1981 flood.Channel width here is 25–52 m (Table 1a). Photograph byR. Palmer. (b) Imbricated blocks at Flat Rock duringpostflood, low-flow conditions.
ETG 17 - 4 SNYDER ET AL.: FLOODS AND THRESHOLDS IN RIVER INCISION
comparison to similar streams [Barnes, 1967; Coon,1998].
3.6. Results and Interpretation
[15] The calculations of boundary shear stress (tb) duringthe 1981 flood event are presented in Table 1. Meanestimates of tb for the four stations range from 92 to 188Pa based on equation (2) and from 123 to 202 Pa based onequation (3) (Table 1b). These ranges reflect the differingslope and width estimates for each station. Because floodsof only slightly lower magnitude than the 1981 eventapparently failed to initiate plucking, we infer that thecritical shear stress (tc) for this site is only slightly lessthan our estimates of tb. The range of estimated tc values isconsistent with Magilligan’s [1992] review of thresholds forextreme reworking of channel morphology. In summary, weemphasize that the 1981 flood was a rare, extreme event,consistent with the low postglacial incision rate of the site.
4. A Stochastic Distribution of Floods andErosion Thresholds in a Bedrock Channel IncisionModel
[16] The 1981 Fall Creek flood highlights the importanceof large, infrequent events in river incision [Baker and Kale,1998]. Such events can be incorporated into geomorphicmodels using a realistic frequency distribution of floods,along with a threshold for initiating erosion. We know thatbedrock erosion must occur during flood events that are atleast capable of transporting coarse bedload, which onlyoccurs in floods that exceed a threshold boundary shearstress [e.g., Gomez and Church, 1989; Buffington andMontgomery, 1997]. It follows then that bedrock erosionmodels should include a threshold term at a minimumappropriate to transport coarse bedload. Naturally, thethreshold for incision into competent rock will often exceedthis initiation of motion threshold. However, modelingapproaches based on a single ‘‘characteristic’’ erosive flood(i.e., bankfull), such as those used in our previous works[Snyder et al., 2000, 2003] are fundamentally incompatible
Table 1a. Total Boundary Shear Stress (tb) Estimates for Each Measurement Stationa
Table 1b. Total Boundary Shear Stress (tb) Estimates for
Different Slope Measurement Mean Values From Each Stationa
Slope Measurement
tb, Pa
Equation (2) Equation (3)
Map, S = 0.0079 188 202Survey mean, S = 0.0045 107 137100-m survey mean (see above) 92 123
aQ = 335 m3 s�1; g = 9.8 m s�2; r = 1000 kg m�3; N = 0.05 m�1/3s.
Figure 3. Stochastic threshold model concepts. (a) Sche-matic plot of flood discharge frequency. A flood of a givenmagnitude is erosive only if it generates basal shear stresses(tb) in excess of the threshold shear stress (tc). Only a partof the distribution of flood events at a given location willexceed the erosion threshold, introducing an importantnonlinearity into the model. For a given location, thethreshold discharge of erosion changes inversely withchannel gradient, shifting the frequency of erosive events.Modified from Baldwin et al. [2003]. (b) General relation-ship between Ktc at steady state and rock uplift rate (U ), forvarious values of threshold shear stress (tc). Note that thetop line (Ktc = 1) represents the tc = 0 case.
SNYDER ET AL.: FLOODS AND THRESHOLDS IN RIVER INCISION ETG 17 - 5
with placing a realistic, physically meaningful value on thethreshold term. We know of no means to arrive at a mean-ingful estimate of a characteristic discharge event for abedrock river. Such an event, if it exists, would undoubtedlybe a function of lithology and climate. The incompatibilityoccurs because the magnitude of the characteristic dischargeevent depends on the value of the threshold term, and viceversa. Although the tc term may be determined from fielddata in some settings (e.g., Fall Creek), such measurementsdo not provide any means to understand the characteristicdischarge event for an area. Put another way, the thresholdterm dictates the minimum flow required to initiate incisionat a given river location, so it is only meaningful if a part ofthe flood frequency distribution is unable to exceed it(Figure 3a). Therefore modeling efforts must include botha stochastic representation of flood events and a thresholdshear stress. Bedrock channel incision models that include athreshold shear stress, but not a stochastic distribution ofstorm events (as noted by Snyder et al. [2003]) are funda-mentally oversimplified and unsatisfying because they can-not be constrained from field data.[17] Tucker and Bras [2000] developed a means to
incorporate a stochastic distribution of rainfall events intoa bedrock channel evolution model based on shear stress orunit stream power. As mentioned above, they demonstratedthat the inclusion of the threshold term (or a stronglynonlinear relationship between erosion rate and discharge)is necessary to produce model results consistent with theexpected correlation between stormier climates and higherosion rates. Importantly, their model allows for a direct,realistic representation of climate and climate change, whichis necessary to begin to test hypothesized relationshipsbetween climate and erosion. By applying their model toa real, well-studied landscape, we demonstrate the relevanceand predictions of the model to the study of tectonicallyactive regions, and explore, for the first time, the broader
implications of the model to the relationship betweentectonics and landscape form.[18] Here we present a synopsis of the stochastic thresh-
old model (Table 2), starting with a brief review of thesimple shear stress bedrock incision model. In a previousstudy [Snyder et al., 2000] we modeled bedrock incisionrate (E) using the basic power law form [Howard andKerby, 1983; Whipple and Tucker, 1999]:
E ¼ KAmSn; ð4Þ
where S is channel gradient, A is drainage area (a proxy fordischarge, Q), K is the coefficient of erosion (dependent ona variety of factors including lithology, process, climate andchannel width), and the exponents m and n are dependent onhydrology, channel hydraulic geometry, and erosion pro-cess. As discussed previously by Snyder et al. [2003], themain limitations of this approach are that it (1) assumes thatall incision occurs during a single ‘‘characteristic’’ dis-charge event, included in the parameter K; (2) assumes thattc is negligible (tb � tc) during this event; and (3) allowsfor only a crude inclusion of climatic conditions. None-theless, this simple form of the shear stress model doesprovide a useful framework from which to investigate thebedrock river incision process.[19] In the case of steady state incision, rock uplift rate
(U ) can be substituted for incision rate (E ), and equation (4)can be solved for steady state slope (Se):
Se ¼U
K
� �1=n
A�m=n: ð5Þ
This is similar in form to the commonly observed empiricalrelationship between slope and area [e.g., Hack, 1957]:
S ¼ ksA�q; ð6Þ
where ks is the channel steepness index and q is the channelconcavity index. Equations (5) and (6) are equivalent under
aSee Appendix A for equations. Parameter values are r = 1000 kg m�3; g = 9.8 m s�2; N = 0.07 m�1/3s; Aref = 106 m2; m/n = 0.514. Other values are b =0.4 (downstream width discharge exponent [from Snyder et al., 2003]); s = 0.25 (at a station width discharge exponent [from Leopold and Maddock,1953]); at LUZ, U1 = 0.0005 m yr�1 (0.0003–0.0005 m yr�1 [Merritts and Bull, 1989; Merritts, 1996]); ks1 = 170 m1.03; at HUZ, U2 = 0.004 m yr�1
(0.0025–0.004 m yr�1); ks2 = 295 m1.03 (237–388 m1.03 [Snyder et al., 2000]); Eureka/LUZ parameters (for 17 February 1975 representative bankfullflood event [from Snyder et al., 2003]) are kq1 = 1.47 � 10�6 m s�1 (linear discharge area coefficient, Q = kqA) and kw1 = 4.63 m�0.2s0.4 (downstream widthdischarge coefficient, w = kwQ
b); Honeydew/HUZ parameters (for 17 February 1975 representative bankfull flood event [from Snyder et al., 2003]) are kq2= 2.73 � 10�6 m s�1; kw2 = 3.61 m�0.2 s0.4.
bCritical shear stresses (tc) of 95–152 Pa correspond to critical discharges (Qc) of 0.2–0.6 m3 s�1 in the LUZ at Aref and 0.07–0.3 m3 s�1 in the HUZ.Using daily discharge data from the South Fork of the Eel River at Leggett as a proxy for the LUZ and Honeydew for the HUZ [Snyder et al., 2003], scaledto station drainage area, Qc is exceeded on 0.3–2% of all days in the LUZ and 7–19% of all days in the HUZ.
ETG 17 - 6 SNYDER ET AL.: FLOODS AND THRESHOLDS IN RIVER INCISION
a restricted range of conditions [Snyder et al., 2000].Equation (6) provides a useful means of characterizingfluvial longitudinal profiles using power law regressions ofempirical or model S and A data [Snyder et al., 2000].[20] The stochastic threshold approach [Tucker and Bras,
2000; Tucker, submitted manuscript, 2002] has incision (E )driven by runoff-generating events, using the Poisson rec-tangular pulse rainfall model of Eagleson [1978]. Thismodel parameterizes the climate state using exponentialdistributions of rainfall intensity (P ), storm duration (Tr)and interstorm period (Tb). These variables can be derivedfrom time series of precipitation data. Tucker (submittedmanuscript, 2002) added an analytical solution for the modelwith a threshold shear stress, based on equation (1b), and acharacteristic ‘‘bankfull’’ runoff (Rb) event. This formulationrepresents hydrology in a simple way: it assumes uniformprecipitation basinwide, direct Horton overland flow, and nodownstream attenuation of flood waves.[21] The Tucker and Bras [2000] formulation gives long-
term average incision rate (E) as a power law function ofslope (S) and drainage area (A, a proxy for discharge), as inthe simple form of the shear stress model (equation (4)). Asimplified presentation of the stochastic threshold model(Table 2) (Tucker, submitted manuscript, 2002) expressesthe coefficient of erosion in the slope-area function as theproduct of three factors:
E ¼ KRKCKtcAmSn; ð7Þ
KR, which encompasses the physical parameters (ke, a, r, g,N, and channel width); KC, which depends on the stochasticclimate parameters (P, Tr, Tb and Rb); and Ktc, which is set bythe critical shear stress (tc) in the form of a critical runoff(Rc). The exponent on drainage area, m equals 3/5a(1 � b)(where b is the exponent relating width to discharge), and theslope exponent, n equals 7/10a, in the formulation used here(equation (3)). As highlighted in Appendix A, the differencesbetween equations (7) and (4) are that (1) KC representsdischarge and runoff processes, instead of kq fromQ = kqA
c inequations (4) and (2) inclusion of tc in the Ktc term. Thethreshold term simply modifies the incision rate (E ) based onthe magnitude of the threshold (0Ktc 1), and equals 1 fortc equal to 0 (Figure 3b). At steady state (U = E ), withspatially uniform U, KR, and KC, Ktc is constant along achannel. Therefore the expected concavity index is un-changed from the prediction of equations (5) and (6) (m/n =q). Because this model uses rainfall data to parameterizeclimatic forcing directly, the only parameters that cannoteasily be constrained from field data are those in equation (1):tc, ke, and a. In section 5, we apply the stochastic thresholdmodel [Tucker and Bras, 2000; Tucker, submitted manu-script, 2002] to a set of bedrock streams in northernCalifornia [Snyder et al., 2000, 2003], to constrain valuesof tc and ke for various values of a, by comparing relief indrainage basins with differing rock uplift and incision rates.
5. Model Application to Coastal Streams of theMendocino Triple Junction Region
5.1. Setting
[22] In several previous studies, we have analyzed exten-sively a series of 21 small, coastal streams on the northern
California coast near the Mendocino triple junction [Mer-ritts and Vincent, 1989; Snyder et al., 2000, 2003]. Thesedrainage basins have received much attention because theyare all small (3–20 km2), share similar lithology, and mostimportantly, have differing uplift histories, allowing for acomparative analysis of channel response to tectonic forc-ing. Late Quaternary rock uplift rates (U ) exhibit a wellconstrained 8� variation along a 120 km coastal transect,with values from �2.5–4 mm yr�1 in the King Range, justsouth of the Mendocino triple junction, to �0.3–0.5 mmyr�1 in the southern part of the study area [Merritts andBull, 1989; Merritts, 1996]. In addition, orographicenhancement of precipitation in the King Range causes amaximum �2� variation in stream discharge in relation tothe low uplift zone [Snyder et al., 2003]. Lithology of thestudy area is heavily fractured (joint spacing <1 m)Cenozoic mudstone and sandstone. Field Schmidt hammermeasurements and joint surveys indicate that the rockresistance does not vary significantly within the study area.Channel width does not appear to respond to the uplift ratechange in this field area [Snyder et al., 2003]. Finally,Snyder et al. [2000] showed evidence that the streams areclose to steady state (U = E ), which means that channelslopes are adjusted to rock uplift rates, allowing for thesubstitution of U for E in equation (7). Our recent work inthe region focused on comparison of digital elevation, field,and hydrological data sets for streams in the King Rangehigh uplift zone (HUZ) to streams in the southern lowuplift zone (LUZ [Snyder et al., 2000, 2003]). We foundthat a simple form of the shear stress model for bedrockchannel incision (equation (4)) cannot explain the observedrelationship between channel gradient (S, at a given drain-age area) and rock uplift rate (U), unless either (1) thevalue of a in equation (1) is >2.5, which is significantlyhigher than we would expect for plucking-dominated bed-rock incision [Whipple et al., 2000a]; (2) there are signifi-cant, unexplained differences in ke between the HUZ andLUZ (i.e., over and above enhanced orographic precipita-tion), perhaps related to differences in erosion process orsediment flux [Snyder et al., 2003] (Figure 4); or (3) tcimportantly influences the S-U relationship. All threeremain plausible explanations. However, we demonstratehere that a model incorporating the minimum possiblecritical threshold (tc for initiation of motion for coarsebedload) provides a plausible explanation without appeal-ing to special circumstances.
5.2. Parameters and Methods
[23] To apply the Tucker and Bras [2000] model to theCalifornia field area, we (1) derived climate parametersfrom rainfall data, (2) compiled physical parameters fromour previous studies, and (3) compared mean channelsteepness of HUZ and LUZ streams. As discussed previ-ously by Snyder et al. [2000, 2003], average annual pre-cipitation (Pma) and runoff varies significantly between theuplift rate zones. To account for these interbasin orographicrainfall differences, we used hourly precipitation data fromtwo different stations. For both data sets, we followed themethodology of Eagleson and Hawk [Eagleson, 1978;Hawk and Eagleson, 1992] to calculate representativePoisson pulse model parameters (P, Tr and Tb) from theprecipitation time series, using the criteria of Restrepo-
SNYDER ET AL.: FLOODS AND THRESHOLDS IN RIVER INCISION ETG 17 - 7
Posada and Eagleson [1982] to define independent rain-storms. To represent the low uplift zone, we used a 40-year(1954–1993) record from Eureka, California, just north ofthe study area. This record had no gaps in data. Unfortu-nately, no similar record exists for the HUZ. Therefore weused the only two consecutive years (1985–1986) of nearlycomplete data available for Honeydew, California, to rep-resent the climate state of the HUZ. Honeydew is one of thewettest places in California and is on the east (lee) side of
the King Range (unlike the studied streams, which are thewest side), but for reasons explained by Snyder et al.[2003], we consider it to be a reasonable proxy for theHUZ climate. The years 1985 and 1986 were somewhatdrier than normal, with a mean annual precipitation (Pma) of1.81 m yr�1, as opposed to 2.66 m yrd�1 for 1959 to 1972(from monthly precipitation data). Furthermore, the data forthe Eureka station is measured to 0.01 inch (1 inch = 2.54cm), while the Honeydew station is precise only to 0.1 inch.
Figure 4. Northern California model setup and results. (a) Model mean steady state high uplift zone(HUZ) and low uplift zone (LUZ) longitudinal profiles (elevation, z versus distance, x; black lines, leftaxis), used for calculations. Gray line is the drainage area profile (A, right axis). (b) Channel steepnessindex (ks, from regressions of S and A; equation (6)) versus uplift rate (U) curves for different shear stress-based incision models, all with slope exponent, n = 1, except as noted. Thin, solid lines are the simpleform of the shear stress model (equation (4)) with different values of K for the HUZ and LUZ cases[Snyder et al., 2000]. Thin, dashed line is the simple model with constant K, but high slope exponent (n =3.8) to match both cases [Snyder et al., 2000]. If orographic enhancement of HUZ precipitation isincluded in this model, then n � 2 matches both cases [Snyder et al., 2000]. Thick line is the stochasticthreshold incision model [Tucker and Bras, 2000; Tucker, submitted manuscript, 2002]; see Table 3 forparameters used (the data plotted are for the Eureka climate, with tc = 150 Pa). Since channel steepnessindex (or gradient) is directly related to drainage basin relief, this plot highlights the predictions differentincision models make for the relationship between relief and uplift rate. Note particularly that the additionof a threshold term in the model yields a limit on the rate of relief increase with rock uplift rate becauseerosion becomes more efficient at higher channel gradient as more frequent events exceed the initiationthreshold.
ETG 17 - 8 SNYDER ET AL.: FLOODS AND THRESHOLDS IN RIVER INCISION
This difference manifests itself predictably in all three of theparameters, increasing mean storm precipitation intensity(P) and duration (Tb), and decreasing mean interstormperiod (Tr) for Honeydew (Table 3a). Because the criteriafor independent storm events are defined for each individualmonth, the difference in precision is unimportant in ourmodeling efforts.[24] The mean annual precipitation (Pma) predicted by the
model (hPi) can be estimated by multiplying the averagestorm precipitation intensity (P) by the fraction of timetaken up by storm events (Tr/(Tr + Tb)). The frequencydistributions for rainfall vary seasonally. In the study region,80–90% of the Pma falls during the half-year period fromOctober to March. To capture this seasonality while retain-ing a single frequency distribution, we simply average thestatistics for the six rainy months and multiply the timefraction by 0.5. This methodology reproduces the true Pma
within 6% (Table 3a). The values of hPi reflect a roughly2� increase in precipitation between the LUZ and HUZ,similar to the observed increase in discharge (for a givendrainage area) by Snyder et al. [2003], suggesting that thisparameterization should yield a reasonable approximationof the interbasin orographic effect.[25] Most of the other necessary model parameters for the
HUZ and LUZ were presented in our previous studies[Snyder et al., 2000, 2003] and are reviewed in Table 2.We use data from a representative flood event (17 March1975 [Snyder et al., 2003]) to parameterize conditions of‘‘bankfull’’ discharge and width. This event was chosenbecause it has an �2 year recurrence interval and exhibits atypical 2� variation in discharge between the HUZ andLUZ. Because the downstream relationship between chan-nel width and drainage area (w = k0wA
b0) did not vary
demonstrably between the HUZ and LUZ, we use a singleparameterization, using high-flow width data (defined bychannel morphology, similar to bankfull) in this study[Tucker and Bras, 2000; Snyder et al., 2003]. We convertthis relationship to width-discharge (w = kwQ
b) usingdischarge-area data (Q = kqA
c) from the 1975 flood. At-station width measurements for this study area are unavail-able, so we use an empirical value from the literature[Leopold and Maddock, 1953] for the exponent relatingwidth to discharge at a given channel location (s = 0.25).Our calculations assume that infiltration (I ) is negligibleduring storm events, which is consistent with the observedlinear relationship between discharge and drainage areaduring storm events in the region [Snyder et al., 2003].The calculations presented below are not particularly sensi-tive to this assumption.[26] We calculated a range of best fit values of threshold
shear stress (tc) and shear stress-erosion rate coefficient(ke) by comparing mean steady state longitudinal profilesfrom the high uplift zone and low uplift zone (Figure 4a).This gives us two equations (equation (7) for the LUZ andHUZ cases) with which to solve for three unknowns (tc,ke, and a or n). This underdetermination restricts ouranalysis to finding values of tc and ke for two referencecases, E linear in shear stress (a = 1, n = 0.7), and E linearin slope (a = 1.43; n = 1). To demonstrate the influence oforographic precipitation, we did each calculation for twosituations: (1) the Eureka/LUZ parameters for both theHUZ and LUZ, and (2) the Eureka parameters for the
LUZ, and the Honeydew/HUZ parameters for the HUZ(Table 3). The implicit assumption that the present-dayclimate is representative of the past �100 kyr does notsignificantly affect our conclusions, just the absolute valueof tc and ke, as discussed below. As shown on Table 2, tofully capture the range of acceptable values of tc and ke,we used (1) a maximum range of HUZ channel steepnessindex (ks), because this parameter varies significantlyamongst the nine streams [Snyder et al., 2000]; and (2)a range of uplift rate estimates, based on approximateuncertainties from the original analyses [Merritts and Bull,1989; Merritts, 1996].
5.3. Results and Interpretations
[27] Figure 4b shows that the addition of a critical shearstress and stochastic storms to the bedrock incision modelcan explain the relationship between channel steepnessindex (ks) and uplift rate observed in the Mendocino triplejunction region well, without the need to appeal to unex-plained changes in ke or highly nonlinear erosion laws (a >2.5). As shown in Table 2b, the value of tc that bestexplains the data falls in a narrow range from 95 to 152Pa (with a maximum range of 45 to 218 Pa) for the variousscenarios. The inclusion of orographic enhancement ofprecipitation has a secondary effect, reducing the necessaryvalue of tc by 30–40%. Given the uncertainties (related totemporal and/or spatial changes in climate, tectonics, streamgeometry and bed friction), the estimated values of tc areimprecise. The important point is heuristic: reasonablevalues of tc can easily account for the otherwise surpris-ingly low relief contrast between the low uplift and highuplift zones. Thus erosion thresholds cannot be ignored inbedrock channel modeling efforts designed to capture thetemporal evolution of landscapes. Moreover, we reiteratethat no meaningful value can be assigned to tc unless thefull stochastic distribution of flood discharges is represented(Figure 3a).
6. Broader Tectonic Implications of the StochasticThreshold Model
6.1. Relief-Uplift Rate Relationship
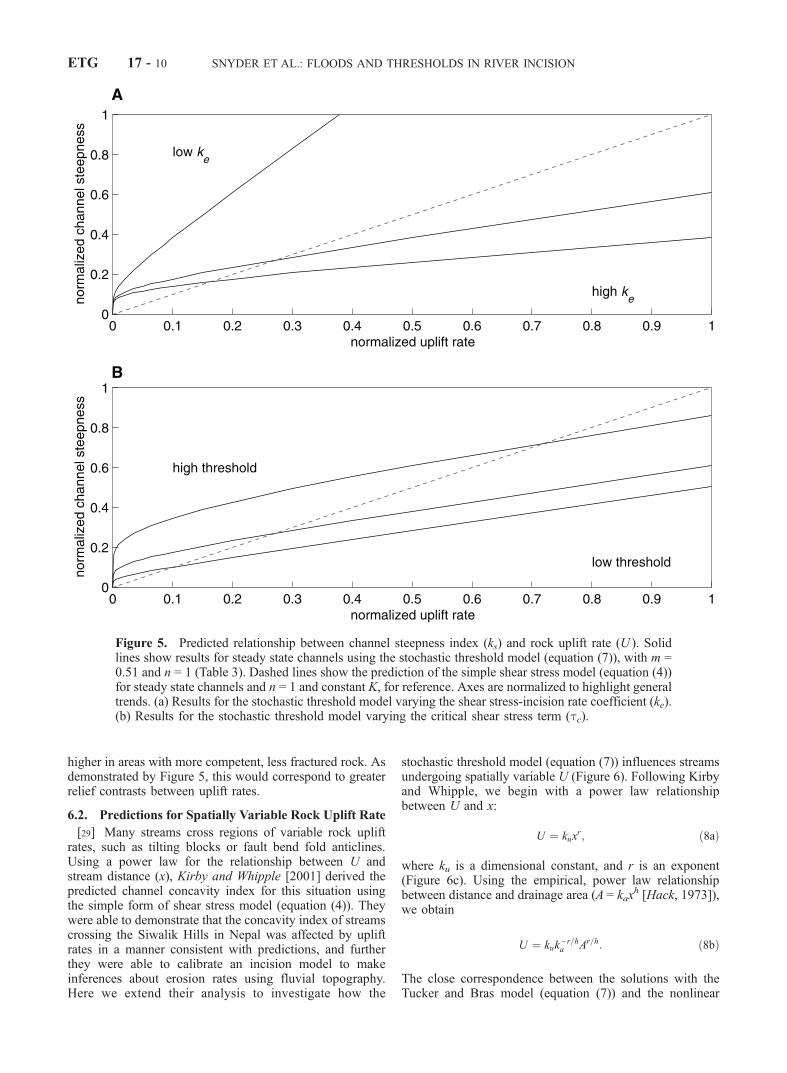
[28] As discussed briefly by Snyder et al. [2003], thepresence of a threshold term fundamentally changes thepredicted relationship between steady state channel gradient(and therefore relief ) and rock uplift rate. As shown onFigures 4 and 5, when compared to a linear model (equation(4), with n = 1), the inclusion of the threshold term reducesthe dependence of channel gradient on rock uplift rate,particularly at higher uplift rates: the threshold imparts anonlinearity that causes minor changes in slope to producesignificant changes in erosion rate. This occurs becauseeach incremental change in gradient causes a greater frac-tion of the stochastic distribution of storm events to initiateincision (Ktc approaches 1, Figure 3). For lower values of ke(more resistant rock), the dependence on gradient inresponse to uplift rates is stronger (Figure 5a). In thenorthern California study area, the rocks are soft and highlyfractured, and therefore the appropriate value of ke is highand tc is low (Table 3 and Figure 4). This likely explains thelow relief contrast between the uplift rate zones in the studyarea. Values of ke are probably much lower and tc much
SNYDER ET AL.: FLOODS AND THRESHOLDS IN RIVER INCISION ETG 17 - 9
higher in areas with more competent, less fractured rock. Asdemonstrated by Figure 5, this would correspond to greaterrelief contrasts between uplift rates.
6.2. Predictions for Spatially Variable Rock Uplift Rate
[29] Many streams cross regions of variable rock upliftrates, such as tilting blocks or fault bend fold anticlines.Using a power law for the relationship between U andstream distance (x), Kirby and Whipple [2001] derived thepredicted channel concavity index for this situation usingthe simple form of shear stress model (equation (4)). Theywere able to demonstrate that the concavity index of streamscrossing the Siwalik Hills in Nepal was affected by upliftrates in a manner consistent with predictions, and furtherthey were able to calibrate an incision model to makeinferences about erosion rates using fluvial topography.Here we extend their analysis to investigate how the
stochastic threshold model (equation (7)) influences streamsundergoing spatially variable U (Figure 6). Following Kirbyand Whipple, we begin with a power law relationshipbetween U and x:
U ¼ kuxr; ð8aÞ
where ku is a dimensional constant, and r is an exponent(Figure 6c). Using the empirical, power law relationshipbetween distance and drainage area (A = kax
h [Hack, 1973]),we obtain
U ¼ kuk�r=ha Ar=h: ð8bÞ
The close correspondence between the solutions with theTucker and Bras model (equation (7)) and the nonlinear
Figure 5. Predicted relationship between channel steepness index (ks) and rock uplift rate (U ). Solidlines show results for steady state channels using the stochastic threshold model (equation (7)), with m =0.51 and n = 1 (Table 3). Dashed lines show the prediction of the simple shear stress model (equation (4))for steady state channels and n = 1 and constant K, for reference. Axes are normalized to highlight generaltrends. (a) Results for the stochastic threshold model varying the shear stress-incision rate coefficient (ke).(b) Results for the stochastic threshold model varying the critical shear stress term (tc).
ETG 17 - 10 SNYDER ET AL.: FLOODS AND THRESHOLDS IN RIVER INCISION
form (n = 3.8) of the simple model (equation (4)) onFigure 4b suggests that the relationship between Ktc androck uplift rate (U) can be reasonably approximated as apower law:
Ktc � kpUp; ð9aÞ
where kp is a dimensional constant and p is a positiveexponent. Recall that Ktc is expected to vary with Ubecause in steeper channels a greater fraction of stormswill generate shear stresses in excess of the threshold. Theexponent ( p) depends on a variety of factors including n,
ke, tc, and P. As seen in Figure 6d, in practice, thisrelation is only approximate because of the complicatedform of the expression for Ktc (Table 2). Thus p is also afunction of the range of uplift rates affecting the channel.As seen in Appendix A, Ktc depends primarily on the ratioRc/P, where the critical runoff (Rc) is set by tc [Tucker andBras, 2000; Tucker, submitted manuscript, 2002]. Devel-oping the exact theoretical relationship approximated byequation (9a) is unnecessary for this analysis; it issufficient to note that p varies in concert with ke and tc(specifically tc/P, Appendix A (Tucker, submitted manu-script, 2002)).
Figure 6. Effect on channel concavity of spatially varying uplift rate (U ) using the stochastic thresholdmodel. In all frames, the dashed lines show a case with constant U (U = 0.0005 m yr�1), solid lines showa case where U = U(x). For the black line, U = 5 � 10�7x, for the gray line, U = 0.08x�0.5. Parametervalues for these model runs are the same as those shown on Table 2b for Eureka climate parameters andn = 1. (a) Steady state channel longitudinal profiles, elevation (z) against distance (x). Note that the U(x)cases have different concavity. (b) Channel gradient (S )–drainage area (A) power law regressions(equation (6)). The constant U case (dashed line) has q = 0.51 = m/n and ks = 170. (c) Uplift rate functionsused. (d) Ktc–U power law regressions, using equation (9a). Box indicates the Ktc–U relationship for theconstant U case. Note that in the regressions (Figures 6b and 6d) the line (solid) does not perfectly matchthe data points in the U(x) case due to deviation of the equation (9a) relation from power law form. Thedifference in the best fit values of p in Figure 6d is solely the result of regression over differing ranges ofU. The predicted channel concavity index (�, equation (11)) for this these cases is 0.388 and 0.601,respectively, which matches the observed concavity index (q) closely.
SNYDER ET AL.: FLOODS AND THRESHOLDS IN RIVER INCISION ETG 17 - 11
[30] Next, Substituting equation (8b) into (9a), we obtain
Ktc � kpkpu k
�pr=ha Apr=h: ð9bÞ
Equations (8b) and (9b) can then be substituted intoequation (7) and solved for channel gradient (Se) at steadystate (U = E ):
Se �k1�pu
k1�pð Þr=ha kpKRKC
!1=n
A m=nð Þ� 1�pð Þ r=hnð Þ½ �: ð10Þ
As with equation (5), equation (10) is a similar form toequation (6), suggesting the following equation forpredicted channel concavity index (�):
� � m=nð Þ � 1� pð Þ r=hnð Þ; ð11Þ
which is equivalent to the empirical channel concavityindex (q) in the case where U(x) equals E(x) and KR and KC
are spatially constant. As shown graphically in Figure 6, thisprediction works well for small variations in U. However, ifU varies across several orders of magnitude significantdeparture from the power law form assumed in equation (9)occurs and the actual concavity index drifts from the valuepredicted by equation (11).[31] Equation (11) demonstrates how the channel concav-
ity index is affected by spatially variably rock uplift, usingthe stochastic threshold approach. Using the simple shearstress model (equation (4)), Kirby and Whipple [2001] foundthat the intrinsic concavity index (�) was (m/n)-(r/hn). Herethe dependence of � on the U(x) relation (equation (8a)) isreduced by the factor (1�p), which is on the order of 0.25( p � 0.75) for typical northern California parameters(Figure 6d). Of course, the value of p is reduced if ke ortc are reduced, diminishing this effect. The stochasticthreshold model predicts less effect on channel concavityindex by spatially variable U than the simpler model. Theeffects of a stochastic distribution of floods and an erosionthreshold should be considered when interpreting suchdata in the future.
7. Discussion
7.1. Critical Shear Stress
[32] We have presented two independent estimates of thecritical shear stress required to initiate bedrock incision.Both suggest that relatively small thresholds (tc � 100–200 Pa, 1–2 orders of magnitude less than the shear stressgenerated by the extreme flood events of Baker and Kale[1998] but consistent with the minimum estimates ofMagilligan [1992]) are appropriate and important for thesefield sites, although the similarity of the two estimates isprobably coincidental. Using a typical Shields threshold ofincipient motion for well-sorted sediment [e.g., Buffingtonand Montgomery, 1997], this range of shear stress shouldcorrespond to a particle diameter of 10–20 cm. In the caseof the Fall Creek analysis, the small tc is expected: becausethe blocks have a small height-to-length ratio, they shouldbe transported relatively easily [Whipple et al., 2000a]. Inthis situation, plucking is likely a two-stage process. First,joints are expanded, and blocks are loosened and preparedfor plucking by weathering processes (wedging of sediment
grains and wood, frost action, etc.). Second, a flood event ofsufficiently high shear stress occurs to put the blocks intomotion. Because the bedrock at Fall Creek is cut perva-sively by open, widely spaced joints, we suspect that thesecond process is rate limiting.[33] The low, estimated tc values for the California
streams merit some discussion. Because these streams aremuch steeper (S � 0.01) than Fall Creek, these shearstresses correspond to high-frequency events. In the highuplift zone, the range of tc values (Table 3b) corresponds todischarges that occur �7–19% of all days (on the order ofmean annual discharge), and in the low uplift zone, 0.3–2%of all days (approximate recurrence interval on the order ofthe 1-year flood). For comparison, discharges equal to orgreater than the October 1981 Fall Creek flood haveoccurred only twice in the 75-year record, correspondingto �0.007% of the days during the period. The particularlyhigh frequency of erosive events in the HUZ can provide aplausible explanation for the apparent increase in theeffectiveness of erosion processes seen in our previouswork (i.e., higher K [Snyder et al., 2000]). As mentionedabove, this shear stress should mobilize 10–20 cm particles,which approximate the size of the typical sediment pro-duced from the pervasively fractured bedrock (joint spacing0.01–1 m) and that are observed on the channel beds. Thismight indicate that the threshold to initiate motion or entrainthe bed particles limits incision in the California streams.[34] Most importantly, the California results indicate that
even a threshold small enough to be exceeded annuallydramatically changes the predicted relationship betweenrock uplift rate and channel steepness index, introducingan important additional nonlinearity to the channel incisionprocess that strongly limits the rate of relief increase withrock uplift rate (Figure 4b). This effect is most significant insystems with less resistant rock (high values of ke and lowtc), such as the northern California streams with heavilyfractured, easily plucked rock; in streams incising harderrocks, we might expect a stronger relationship betweenchannel steepness index and uplift rate (Figure 5a).
7.2. A Nonunique Solution
[35] In recent years, much attention has been paid to thehypothesized role of sediment flux (Qs) in determining ratesof bedrock erosion [e.g., Howard, 1980; Beaumont et al.,1992; Sklar and Dietrich, 1998]. The approach presentedhere implicitly assumes that the role of sediment flux indetermining erosion rates is encompassed by the inclusionof tb and tc in the model. Whipple and Tucker [2002]present a means to compare generalized versions of severalsediment flux models using an approach based on channelgradient and drainage area, as in equation (4). None of thesemodels include an erosion threshold. Several formulationsof these models can provide equally plausible explanationsfor the observed topography in the northern California studyarea, under a restricted set of conditions that we outlinebriefly below. First, the present-day low uplift zone (LUZ)channels must be strongly armored by sediment, and there-fore approaching a transport-limited condition, meaning thatthe channel slope is more governed by the need to transportthe sediment load than by the stream’s intrinsic ability toerode the substrate. Second, the high uplift zone (HUZ)channels must be in a transient condition, with sediment
ETG 17 - 12 SNYDER ET AL.: FLOODS AND THRESHOLDS IN RIVER INCISION
flux lagging behind channel response. In this situation, asthe HUZ streams approach steady state these channels willalso become sediment armored and channel gradient willincrease, yielding a much stronger relationship betweenchannel gradient and uplift rate at steady state. The sedimentprotection explanations require that the HUZ channels willphysically steepen 4� over the next few hundred kiloyearsas sediment flux increases in the HUZ, and the beds of HUZchannels become protected [Whipple and Tucker, 2002]. Inprinciple, these models are testable, because in the LUZ, thelong-term average sediment flux (Qs) should approximatelyequal the carrying capacity (Qc) if the system is approx-imately transport limited. At present, the available data[Snyder et al., 2000, 2003] are insufficient to confirm orrefute the existence of these conditions in the northernCalifornia study area.[36] Unfortunately, we cannot yet discriminate confi-
dently between the various bedrock channel incision modelsto explain the northern California relief-uplift rate relation-ship. To do so would require direct quantitative estimates oflong-term sediment flux and average transport capacity thatcannot easily be made at present. Regardless of the relativeimportance of sediment flux, critical shear stress, and otherfactors such as debris flows [Stock and Dietrich, 1998] andintrabasin orographic effects [Roe et al., 2002] to thespecific case of the Mendocino triple junction region, theresults presented here show that including even minimumvalues of tc and a stochastic distribution of storms yieldsdemonstrably important, first-order effects, that should beincluded in future models and in the evaluation of fieldincision rate data. Moreover, such a model provides asufficient explanation of the Mendocino triple junctionregion data, based only on processes that we know areoccurring. A more complete model will be able to includeboth these and sediment flux effects.
8. Conclusions
[37] Our work in New York demonstrates the importanceof high-magnitude floods in driving incision of bedrock. Byusing a model that includes both a critical shear stress forincision and a well-constrained stochastic precipitation dis-tribution this observation can be applied to models of fluvialerosion over geologic timescales. Our work in northernCalifornia demonstrates that a stochastic threshold modelcan explain the observed topography without need to appealto highly nonlinear erosion models (n > 3). We find thatrelatively low erosion thresholds (tc = 100–200 Pa) areappropriate for the field settings considered here, and havesignificant effects on the relationship between relief androck uplift rate, when compared to models without such athreshold. Therefore efforts to model landscape evolutionwill be most successful in reproducing the temporal andspatial evolution of topography in active mountain belts ifthey use a stochastic threshold model.[38] Although much progress has been made, bedrock
river modeling efforts are still hampered by the dearth offield and experimental data to constrain the unknownparameters (equation (1)). Experimental work by Sklarand Dietrich [2001] is making important contributions toquantifying rock resistance to erosion in environmentsdominated by abrasion. Additional studies are needed in
laboratories and field settings of known bedrock incisionprocesses and rates, so that we can constrain the role ofsediment flux and values of tc, ke and a for differentlithologies and erosion processes [Whipple et al., 2000b].Also, tests of the incision models in well-parameterizedstreams that are actively responding to changes in tectonicor climatic forcings must be done. With more work in well-chosen sites, our ability to model the long-term growth anddecay of topography will be greatly improved, allowing formore rigorous testing of hypothesized feedbacks amongcrustal, surficial, and atmospheric processes [e.g., Molnarand England, 1990; Raymo and Ruddiman, 1992; Smalland Anderson, 1995; Whipple et al., 1999; Willet, 1999].For instance, only by incorporating realistic representationsof flood magnitudes and frequencies, and the physics of theerosion processes, can we begin to make quantitativeinferences about the relationship between climatic variabil-ity and the efficiency of terrestrial erosion [e.g., Molnar andEngland, 1990; Bull, 1991; Peizhen et al., 2001].
Appendix A: Bedrock Channel Incision Models
[40] The basic postulate is
E ¼ ke tb � tcð Þa or ke tab � tac� �
;
E ¼ KAmSn;
K ¼ KRKCKtc; n ¼ ba; m ¼ aa 1� bð Þ:
The basic shear stress model (tc = 0) is
KR ¼ kek�aaw kat ;
KC ¼ ka 1�bð Þq ;
Ktc ¼ 1:
Empirical relations are as follows:
Physical parameters
kt ¼ rgNa
Discharge-drainage area
Q ¼ kqAc
Width-discharge
w ¼ kwQb
At-station width-discharge
w=wb ¼ Q=Qbð Þs
‘‘Bankfull’’ discharge-runoff
Qb ¼ RbA:
The stochastic threshold model [Tucker and Bras, 2000;Tucker, submitted manuscript, 2002] is
KR ¼ kek�aaw kat ;
KC ¼ Tr
Tr þ Tb
� �1�eb
PgbRebb exp
1
P
� �� gb þ 1ð Þ;
Ktc ¼� gb þ 1;
Rc
P
� �� Rc
P
� �gb
expRc
P
� �� gþ 1ð Þ :
SNYDER ET AL.: FLOODS AND THRESHOLDS IN RIVER INCISION ETG 17 - 13
The exponents are
a ¼ 3
5; b ¼ 7
10
for the Manning relation, and
gb ¼ aa 1� sð Þ;
eb ¼ aa b� sð Þ:
[41] Acknowledgments. Arthur L. Bloom called our attention tothe Ithaca site and provided guidance in the field. We also wish tothank Laurie Snyder and John Wood for field work on Fall Creek;Nicole Gasparini for assistance with the Poisson pulse model; WilliamCoon of the U.S. Geological Survey in Ithaca for help with estimatingroughness coefficients; and Richard Palmer for sharing photographs ofthe 1981 flood. An earlier version of this paper benefited from reviewsby A. L. Bloom, John Southard, and Kip Hodges. We thank GregoryHancock and an anonymous reviewer for suggestions that improved thismanuscript.
ReferencesBaker, V. R., and V. S. Kale, The role of extreme floods in shaping bedrockchannels, in Rivers Over Rock: Fluvial Processes in Bedrock Channels,Geophys. Monogr. Ser., vol. 107, edited by K. J. Tinkler and E. E. Wohl,pp. 153–165, AGU, Washington, D. C., 1998.
Baldwin, J. A., K. X. Whipple, and G. E. Tucker, Implications of the shear-stress river incision model for the timescale of post-orogenic decay oftopography, J. Geophys., 108, doi:2001JB000550, in press, 2003.
Barnes, H. H., Roughness characteristics of natural channels, U.S. Geol.Surv. Water Supply Pap.,r 1849, 213 pp., 1967.
Beaumont, C., P. Fullsack, and J. Hamilton, Erosional control of activecompressional orogens, in Thrust Tectonics, edited by K. R. McClay,pp. 1–18, Chapman and Hall, New York, 1992.
Benda, L., and T. Dunne, Stochastic forcing of sediment supply to channelnetworks from landsliding and debris flow, Water Resour. Res., 33(12),2849–2863, 1997.
Buffington, J. M., and D. R. Montgomery, A systematic analysis of eightdecades of incipient motion studies, with special reference to gravel-bedded rivers, Water Resour. Res., 33(8), 1993–2029, 1997.
Bull, W. B., Geomorphic Responses to Climatic Change, 326 pp., OxfordUniv. Press, New York, 1991.
Coon, W. F., Estimation of roughness coefficients for natural stream chan-nels with vegetated banks, U.S. Geol. Survey Water Supply Pap., 2441,133 pp., 1998.
Eagleson, P. S., Climate, soil, and vegetation, 2, The distribution of annualprecipitation derived from observed storm frequencies, Water Resour.Res., 14(5), 713–721, 1978.
Gomez, B., and M. Church, An assessment of bed load sediment transportformulae of gravel bed rivers, Water Resour. Res., 25(6), 1161–1186,1989.
Hack, J. T., Studies of longitudinal stream profiles in Virginia and Mary-land, U.S. Geol. Surv. Prof. Pap., 294-B, 42–97, 1957.
Hack, J. T., Stream profile analysis and stream-gradient index, J. Res. U.S.Geol. Surv., 1(4), 421–429, 1973.
Hancock, G. S., R. S. Anderson, and K. X. Whipple, Beyond power:Bedrock incision process and form, in Rivers Over Rock: Fluvial Pro-cesses in Bedrock Channels, Geophys. Monogr. Ser., vol. 107, edited byK. J. Tinkler and E. E. Wohl, pp. 35–60, AGU, Washington, D. C.,1998.
Hawk, K. L., and P. S. Eagleson, Climatology of station storm rainfall inthe continental United States: Parameters of the Bartlett-Lewis andPoisson rectangular pulses models, Mass. Inst. of Technol., Cambridge,1992.
Howard, A. D., Thresholds in river regimes, in Thresholds in Geomorphol-ogy, edited by D. R. Coates and J. D. Vitek, pp. 227–258, Allen andUnwin, Concord, Mass., 1980.
Howard, A. D., Long profile development of bedrock channels: Interactionof weathering, mass wasting, bed erosion, and sediment transport, in
Rivers Over Rock: Fluvial Processes in Bedrock Channels, Geophys.Monogr. Ser., vol. 107, edited by K. J. Tinkler and E. E. Wohl, pp.297–320, AGU, Washington, D. C., 1998.
Howard, A. D., and G. Kerby, Channel changes in badlands, Geol. Soc. Am.Bull., 94, 739–752, 1983.
Howard, A. D., M. A. Seidl, and W. E. Dietrich, Modeling fluvial erosionon regional to continental scales, J. Geophys. Res., 99, 13,971–13,986,1994.
Kirby, E., and K. X. Whipple, Quantifying differential rock-uplift rates viastream profile analysis, Geology, 29, 415–418, 2001.
Leopold, L. B., and T. Maddock Jr., The hydraulic geometry of streamchannels and some physiographic implications, U.S. Geol. Surv. Prof.Pap., 252, 57 pp., 1953.
Magilligan, F. J., Thresholds and the spatial variability of flood powerduring extreme floods, Geomorphology, 5, 373–390, 1992.
Merritts, D. J., The Mendocino triple junction: Active faults, episodiccoastal emergence, and rapid uplift, J. Geophys. Res., 101, 6051–6070, 1996.
Merritts, D., and W. B. Bull, Interpreting Quaternary uplift rates at theMendocino triple junction, northern California, from uplifted marine ter-races, Geology, 17, 1020–1024, 1989.
Merritts, D., and K. R. Vincent, Geomorphic response of coastal streams tolow, intermediate, and high rates of uplift, Mendocino junction region,northern California, Geol. Soc. Am. Bull., 101, 1373–1388, 1989.
Molnar, P., and P. England, Late Cenozoic uplift of mountain ranges andglobal climate change: Chicken or egg?, Nature, 346, 29–34, 1990.
Mullins, H. T., E. J. Hinchey, R. W. Wellner, D. B. Stephens, W. T. An-derson, T. R. Dwyer, and A. C. Hine, Seismic stratigraphy of the FingerLakes: A continental record of Heinrick event H-1 and Laurentide icesheet instability, in Subsurface Geologic Investigations of New York Fin-ger Lakes: Implications for Late Quaternary Deglaciation and Environ-mental Change, edited by H. T. Mullins and N. Eyles, Spec. Pap. Geol.Soc. Am., 311, 1–35, 1996.
Peizhen, Z., P. Molnar, and W. R. Downs, Increased sedimentation rates andgrain size 2-4 Myr ago due to the influence of climate change on erosionrates, Nature, 410, 891–897, 2001.
Raymo, M. E., and W. F. Ruddiman, Tectonic forcing of late Cenozoicclimate, Nature, 359, 117–122, 1992.
Restrepo-Posada, P. J., and P. S. Eagleson, Identification of independentrainstorms, J. Hydrol., 55, 303–319, 1982.
Roe, G. H., D. R. Montgomery, and B. Hallet, Effects of orographic pre-cipitation variations on steady-state river profiles and relief, Geology, 30,143–146, 2002.
Sklar, L., and W. E. Dietrich, River longitudinal profiles and bedrock inci-sion models: Stream power and the influence of sediment supply, inRivers Over Rock: Fluvial Processes in Bedrock Channels, Geophys.Monogr. Ser., vol. 107, edited by K. J. Tinkler and E. E. Wohl, pp.237–260, AGU, Washington, D. C., 1998.
Sklar, L., and W. E. Dietrich, Relating rates of fluvial bedrock erosion torock strength: An experimental study (abstract), Eos Trans. AmericanGeophysical Union, 80(46), Fall Meet. Suppl., F448, 1999.
Sklar, L., and W. E. Dietrich, Sediment and rock strength controls on riverincision into bedrock, Geology, 29, 1087–1090, 2001.
Small, E. E., and R. S. Anderson, Geomorphically driven Late Cenozoicrock uplift in the Sierra Nevada, California, Science, 270, 277–280,1995.
Snyder, N. P., K. X. Whipple, G. E. Tucker, and D. J. Merritts, Landscaperesponse to tectonic forcing: DEM analysis of stream profiles in theMendocino triple junction region, northern California, Geol. Soc. Am.Bull., 112, 1250–1263, 2000.
Snyder, N. P., K. X. Whipple, G. E. Tucker, and D. J. Merritts, Channelresponse to tectonic forcing: Analysis of stream morphology and hydrol-ogy in the Mendocino triple junction region, northern California, Geo-morphology, in press, 2003.
Stock, J. D., and W. E. Dietrich, Channel incision by debris flows: Amissing erosion law?, Eos Trans. AGU, 79(45), Fall Meet. Suppl.,F366, 1998.
Stock, J. D., and D. R. Montgomery, Geologic constraints on bedrock riverincision using the stream power law, J. Geophys. Res., 104, 4983–4993,1999.
Tinkler, K. J., and E. E. Wohl (Eds.), Rivers Over Rock: Fluvial Processesin Bedrock Channels, Geophys. Monogr. Ser., vol. 107, 323 pp., AGU,Washington, D. C., 1998.
Tucker, G. E., and R. L. Bras, A stochastic approach to modeling the role ofrainfall variability in drainage basin evolution, Water Resour. Res., 36(7),1953–1964, 2000.
Whipple, K. X., and G. E. Tucker, Dynamics of the stream-power riverincision model: Implications for the height limits of mountain ranges,landscape response timescales, and research needs, J. Geophys. Res.,104(B8), 17,661–17,674, 1999.
ETG 17 - 14 SNYDER ET AL.: FLOODS AND THRESHOLDS IN RIVER INCISION
Whipple, K. X., and G. E. Tucker, Implications of sediment-flux dependentriver incision models for landscape evolution, J. Geophys. Res., 107(B2),2039, doi:10.1029/2000JB000044, 2002.
Whipple, K. X., E. Kirby, and S. H. Brocklehurst, Geomorphic limits toclimate-induced increases in topographic relief,Nature, 401, 39–43, 1999.
Whipple, K. X., R. A. Anderson, and G. S. Hancock, River incision intobedrock: Mechanics and relative efficacy of plucking, abrasion, and ca-vitation, Geol. Soc. Am. Bull., 112, 490–503, 2000a.
Whipple, K. X., N. P. Snyder, and K. Dollenmayer, Rates and processes ofbedrock incision by the Upper Ukak River since the 1912 Novarupta ashflow in the Valley of Ten Thousand Smokes, Alaska, Geology, 28, 835–838, 2000b.
Willet, S. D., Orogeny and orography: The effects of erosion on the struc-ture of mountain belts, J. Geophys. Res., 104(B12), 28,957–28,981,1999.
Willgoose, G., R. L. Bras, and I. Rodriguez-Iturbe, A coupled channelnetwork growth and hillslope evolution model, 1, Theorys,Water Resour.Res., 27(7), 1671–1684, 1991.
�����������������������D. J. Merritts, Geosciences Department, Franklin and Marshall College,
Lancaster, PA 17604-3003, USA.N. P. Snyder, U.S. Geological Survey Pacific Science Center, 1156 High
Street, Santa Cruz, CA 95064, USA. ([email protected])G. E. Tucker, School of Geography and the Environment, University of
Oxford, Oxford OX1 3TB, UK.K. X. Whipple, Department of Earth, Atmospheric and Planetary
Sciences, Massachusetts Institute of Technology, Cambridge, MA 02139-4307, USA.
SNYDER ET AL.: FLOODS AND THRESHOLDS IN RIVER INCISION ETG 17 - 15


![Poisonous fishes and plants in the tropics. n.p. [Translation 111].](https://static.documents.pub/doc/80x56/568bde321a28ab2034b893c6/poisonous-fishes-and-plants-in-the-tropics-np-translation-111.jpg)

