36
1 STRATEGIES TO RECRUIT STRATEGIES TO RECRUIT STUDENTS FROM STUDENTS FROM B B R R A A Z Z I I L L
| Date post: | 17-Dec-2015 |
| Category: |
Documents |
| Upload: | delilah-wilkins |
| View: | 214 times |
| Download: | 1 times |

1
STRATEGIES TO RECRUIT STRATEGIES TO RECRUIT
STUDENTS FROMSTUDENTS FROM BBRRAAZZIILL

2
AgendaWelcome by Jim Paul, Education Team Leader - USCSOpening Remarks by Danny Devito, Minister Counselor for Commercial Affairs - USFCSThe Brazilian Education Market by Thais Burmeister Pires, Education Advisor – Education USAWho are the Brazilian International and How to Recruit by Tatiana Visnevski Mendes, President of BELTA – Brazilian Education & Language Travel AssociationThe Student Visa Issue, Myth and True by Amy Moser, Visa Officer – State DepartmentWrap up and Q&As by Paulo Rodrigues, Education Specialist - USFCS

3
BRAZIL AT A BRAZIL AT A GLANCEGLANCEDanny DevitoDanny Devito

4
General Facts
GDP 2006: $1.1 trillion
10th largest economy in the world – experiencing stable and sustainable growth
190 million people
2006 U.S. Exports to Brazil: $19 billion
2006 Brazil Exports to U.S.: $26 billion
Trade balance with USA ($7 billion in Brazilian favor)

5
Brazil – USA
GDP of Brazil = Washington > $1.1 trillion < TexasGDP of Brazil = Washington > $1.1 trillion < Texas

6
Between 2002 and 2007 the Brazilian currency
appreciated over 113% against the USD
Between 2006 and 2007 the appreciation was over 20% - Appreciation was against the USD and not, for example, the Euro
Brazilian imports increased by over 32% between 2006
and 2007
Despite large increase in imports, Brazil had 40 billion
USD trade surplus in 2007 and doubled its foreign
reserves to 190 billion USD
For Brazilian students the 20 percent appreciation
against the USD means that tuition and living expenses
went down by over 20 percent in the U.S.
Good News

7
Example of Tuition Cost Then and Now
For a hypothetical program with tuition worth USD10,000
Sep-02 Today Difference
38,900 17,600 21,300
Moreover:
• There has been an increase in income;
• Consistent decrease of interest rates; and
• Increase in credit availability at affordable cost.

8
THE BRAZILIAN THE BRAZILIAN EDUCATION EDUCATION
MARKETMARKET
Thais B. PiresThais B. Pires

9
# OF SCHOOLS# OF SCHOOLS
Source: MEC (Brazilian Ministry of Education), 2007
Year Total Public Private2002 1,637 195 1,4422003 1,859 207 1,6522004 2,013 224 1,789
Year Total Public Private2002 100.0 11.9 88.12003 100.0 11.1 88.92004 100.0 11.1 88.9
Absolute Number of Schools
As Percentage (%)
# of Schools
0
500
1000
1500
2000
2002 2003 2004
Year
Public
Private

10
# OF PROGRAMS# OF PROGRAMS
Year Total Public Private2002 14,399 5,252 9,1472003 16,453 5,662 10,7912004 17,769 6,115 11,654
Year Total Public Private2002 100.0 36.5 63.52003 100.0 34.4 65.62004 100.0 34.4 65.6
Absolute Number of Programs
As Percentage (%)
# of Programs
0
2,000
4,000
6,000
8,000
10,000
12,000
14,000
2002 2003 2004
Year
Public
Private
Source: MEC (Brazilian Ministry of Education), 2007

11
# OF ENROLLMENTS# OF ENROLLMENTS
Year Total Public Private2002 3,479,913 1,051,655 2,428,2582003 3,887,771 1,137,119 2,750,6522004 4,163,733 1,178,328 2,985,405
Year Total Public Private2002 100.0 30.2 69.82003 100.0 29.2 70.82004 100.0 28.3 71.7
As Percentage (%)
Absolute Number of Enrolments# of Enrolments
0
500,000
1,000,000
1,500,000
2,000,000
2,500,000
3,000,000
3,500,000
2002 2003 2004
Year
Public
Private
Source: MEC (Brazilian Ministry of Education), 2007

12
ESL
Total number of English Schools (franchising): Approx.: 5,000
Bi-National Centers – Total number of students: Approx.: 200,000

13
Some of Reasons for declining interest in the U.S.
Strong competition from other countries, mainly UK, Canada, Australia, New Zealand, and South Africa
Real and perceived problems related to visa approvals
US tuition fees higher than competing countries
Expanding home country capacity of public and private education institutions
Distance learning – alternative access to U.S. degrees

14
The United States is becoming popular again
Low Dollar
Pent-up demand
Lower security concerns
More understanding of Visa process

15Source: IIE (Institute of International Education) – Open Doors 2007
Figure 2A: Top 20 Leading Places of Origin of International Students, 2005/06 & 2006/07
2006/07 % %Rank Place of Origin 2005/06 2006/07of Int'l Total Change
WORLD TOTAL 564.766 582.984 - 3,21 India 76.503 83.833 14,4 9,62 China, PRC 62.582 67.723 11,6 8,23 Korea, Rep. of (South) 59.022 62.392 10,7 5,74 Japan 38.712 35.282 6,1 -8,95 Taiwan 27.876 29.094 5,0 4,46 Canada 28.202 28.280 4,9 0,37 Mexico 13.931 13.826 2,4 -0,88 Turkey 11.622 11.506 2,0 -1,09 Thailand 8.765 8.886 1,5 1,410 Germany 8.829 8.656 1,5 -2,011 United Kingdom 8.274 8.438 1,4 2,012 Saudi Arabia 3.448 7.886 1,4 128,713 Nepal 6.061 7.754 1,3 27,914 Hong Kong, China 7.849 7.722 1,3 -1,615 Indonesia 7.575 7.338 1,3 -3,116 Brazil 7.009 7.126 1,2 1,717 Colombia 6.835 6.750 1,2 -1,218 France 6.640 6.704 1,1 1,019 Kenya 6.559 6.349 1,1 -3,220 Vietnam 4.597 6.036 1,0 31,3

16Source: IIE (Institute of International Education) – Open Doors 2007
International Students Totals by Place of Origin, 2005/06 &
2006/07

17Source: IIE (Institute of International Education) – Open Doors 2007
INTERNATIONAL STUDENTS BY ACADEMIC LEVEL AND PLACE OF ORIGIN, 2006/07
Under- % UnderPlace of Origin graduate graduate Graduate %Graduate Other % Other OPT *
South America 15.301 49,4 11.655 37,6 2.194 7,1 1.832Argentina 939 33,4 1.513 53,8 251 8,9 110Bolivia 653 65,8 246 24,8 50 5,0 44Brazil 3.520 49,4 2.653 37,2 478 6,7 475Chile 437 27,8 888 56,6 110 7,0 135Colombia 3.031 44,9 2.796 41,4 473 7,0 450Ecuador 1.380 62,4 561 25,4 148 6,7 122Paraguay 207 60,9 93 27,4 19 5,6 21Peru 1.950 52,7 1.339 36,2 256 6,9 156Uruguay 178 37,4 247 51,9 33 6,9 18Venezuela 2.691 59,5 1.187 26,2 349 7,7 296* OPT = Optional Practical Training

18Source: IIE (Institute of International Education) – Open Doors 2007
Host Regions and Destinations of U.S. Study Abroad Students, 2004/05 &
2005/06

19
Evolution since 1996
YEAR # of Students from
Brazil % of Total Foreign
Students in US
2006/07 7,126 1.2%
2005/06 7,009 1.2%
2004/05 7,244 1.2%
2003/04 7,799 1.4%
2002/03 8,388 1.4%
2001/02 8,972 1.5%
2000/01 8,846 1.6%
1999/00 8,860 1.7%
1998/99 8,052 1.6%
1997/98 6,982 1.5%
1996/97 6,168 1.3%
Source: IIE (Institute of International Education)

20
Evolution since 1996
Source: IIE (Institute of International Education)
Year # of Students from Brazil in the U.S.
% of Total Foreign Students in the U.S.
# of U.S. Study Abroad Students Going to Brazil
2006/07 7,126 1.2% n/a
2005/06 7,009 1.2% 2,328 (up 16.8%)
2004/05 7,244 1.3% 1,994
2003/04 7,799 1.4% 1,554
2002/03 8,388 1.4% 1,345
2001/02 8,972 1.5% 1,064
2000/01 8,846 1.6% 760
1999/00 8,860 1.7% 717
1998/99 8,052 1.6% 594
1997/98 6,982 1.5% 555
1996/97 6,168 1.3% 424
1995/96 5,497 1.2% 386
1994/95 5,017 1.1% 345

21
# Students from Brazil to the US 1993-2006
0
2,000
4,000
6,000
8,000
10,000
93/94 94/95 95/96 96/97 97/98 98/99 99/00 00/01 01/02 02/03 03/04 04/05 05/06
Year
Evolution since 1993

22
Where is everybody else?
Numbers just shown do not include language program students, which represent 70% of international Brazilian students
Brazil is among the top 6 largest suppliers of English language students to the US

23
WHO ARE THEY?WHO ARE THEY?THE PROFILE OF THE PROFILE OF INTERNATIONAL INTERNATIONAL
BRAZILIAN STUDENTSBRAZILIAN STUDENTS
Tatiana V MendesTatiana V Mendes

24
3.1%
12.6%
26.9%
57,1%
21 to 25
16 to 20
26 to 30
up to the age of 10
AGE
Source: BELTA – Brazilian Education & Language Travel Association

25
3.1%
28.5%
68.2%
Class A/B
Class A
Class B
SOCIAL CLASS
Source: BELTA – Brazilian Education & Language Travel Association

26
WHAT DO THEY BUY?
12.6%
20.6%
34.9%
53.9%
74,6%
Language
High School
Summer Work/AuPair
Technical
College
Source: BELTA – Brazilian Education & Language Travel Association

27
Based on 2004 data when 42,000 Brazilian students travelled abroad.
WHERE DO THEY GO?
12%
16%
9%
16%
10%
25%
12%
Others
UK
New Zealand
United States
Spain
Canada
Australia
Source: BELTA – Brazilian Education & Language Travel Association

28
7.9%
1.5%
3.1%
4.7%
6.3%
9.5%
11.1%
14.2%
17.4%
25.3%
30.1%
39.6%
58.7%
65.0%
88.8%Language
High School
Work Option
Language/Paid Internship
Internship/Paid
Vacation groups
Language/Non Paid Internship
Specialization
Language for Business
Preparatory for Exams
Masters
Undergraduate
For Educators
Elderly Education
Others
WHAT DO THEY WANT?
Source: BELTA – Brazilian Education & Language Travel Association

29
12.0%
3.7%
8.5%
12.2%
12.8%
13.3%
14.1%
22.9%
Australia
Canada
United States
New Zealand
UK
Spain
Germany
Others
WHERE DO THEY WANT TO GO?
Source: BELTA – Brazilian Education & Language Travel Association
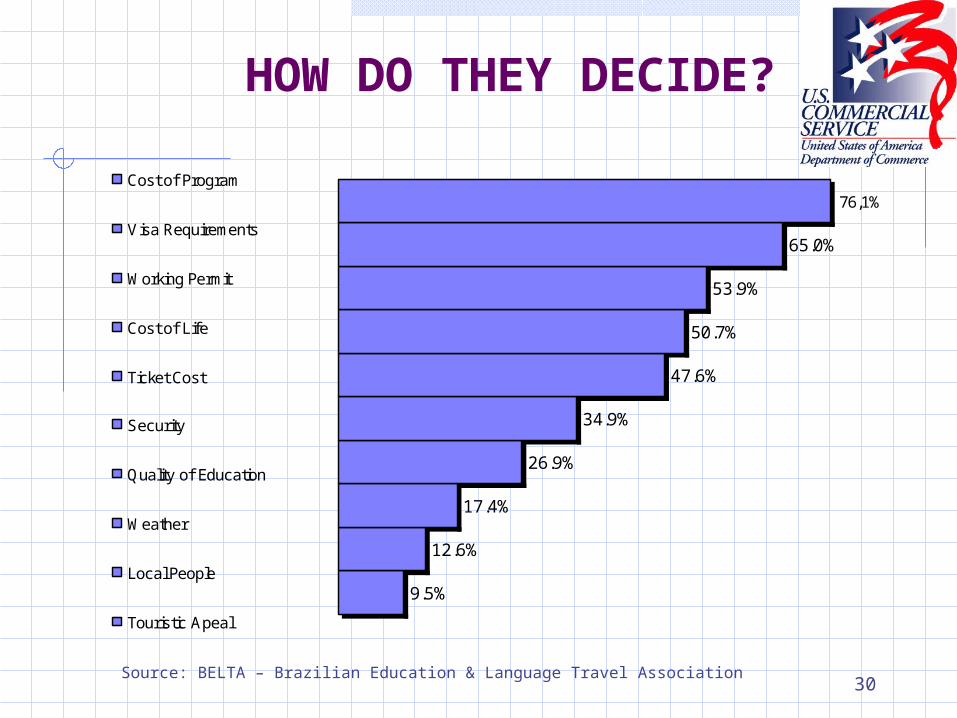
30
9.5%
12.6%
17.4%
26.9%
34.9%
47.6%
50.7%
53.9%
65.0%
76,1%Cost of Program
Visa Requirements
Working Permit
Cost of Life
Ticket Cost
Security
Quality of Education
Weather
Local People
Touristic Apeal
HOW DO THEY DECIDE?
Source: BELTA – Brazilian Education & Language Travel Association

31
THE STUDENT VISA THE STUDENT VISA ISSUE, MYTH AND ISSUE, MYTH AND
TRUETRUE
Amy MoserAmy Moser

32
The Visa Situation
• F1 and J1 applicants have shorter waiting line to get an interview - approx. 15 days
• Approx. 8 percent of interview slots reserved for F1 and J1 applicants
• Cost of the visa application ($131 + $40 + travel expenses*)
• College students with 4-year visa – there’s no need to schedule interview

33
CONSULATE (F1) 01-JAN-04 TO 31-DEC-04 01-JAN-05 TO 31-DEC-05 01-JAN-06 TO 31-DEC-06
Brasilia (BRA) 419 516 497
Recife (RCF) 602 539 555
Rio de J aneiro (RDJ ) 1189 937 987
Sao Paulo (SPL) 3997 3916 3734
TOTAL 6207 5908 5773
CONSULATE (J 1) 01-JAN-04 TO 31-DEC-04 01-JAN-05 TO 31-DEC-05 01-JAN-06 TO 31-DEC-06
Brasilia (BRA) 626 783 964
Recife (RCF) 916 1356 1454
Rio de J aneiro (RDJ ) 2296 2964 3578
Sao Paulo (SPL) 8252 11566 11866
TOTAL 12090 16669 17862
Combined F-1 and J-1 18297 22577 23635
Total # of F1s and J1s
Source: US Embassy - Brazil

34
WRAP UPWRAP UP

35
Major Education Events
EDUCATION USA – South America
Website: http://www.educationusa.org.br/
Schedule: Five capital cities in October , 2008
EXPOBELTAWebsite: http://www.expobelta.org.br
Schedule: six capital cities in March 29th – April 7th, 2008

36
Thank you!
For more information please contact:
Paulo, [email protected], 5511-5186-7186Tatiana V. Mendes, [email protected]. 5511-3254-4333
Thais B. C. Pires, [email protected], 5511-3067-2913Jim Paul, [email protected], 1-617-565-4304


