This document contains forward-looking statements within the meaning of the federal securities laws. We intend these forward-looking statements to be covered by the safe harbor provisions of the federal securities laws. In particular, any projections regarding our future revenues, expenses, earnings, capital expenditures, effective tax rates, client trading activity, benefits of the thinkorswim acquisition, accounts or stock price, as well as the assumptions on which such expectations are based, are forward-looking statements. These statements reflect only our current expectations and are not guarantees of future performance or results. These statements involve risks, uncertainties and assumptions that could cause actual results or performance to differ materially from those contained in the forward-looking statements. These risks, uncertainties and assumptions include general economic and political conditions, interest rates, market fluctuations and changes in client trading activity, increased competition, systems failures and capacity constraints, ability to service debt obligations, ability to realize the expected benefits from the thinkorswim acquisition, regulatory and legal matters and uncertainties and other risk factors described in our latest Annual Report on Form 10-K, filed with the SEC on Nov. 13, 2009, and our latest Quarterly Report on Form 10-Q filed thereafter. These forward-looking statements speak only as of the date on which the statements were made. We undertake no obligation to update or revise publicly any forward-looking statements, whether as a result of new information, future events or otherwise.
3OUR MISSION
To Be The Better Investment Firm For
Today’s Investor
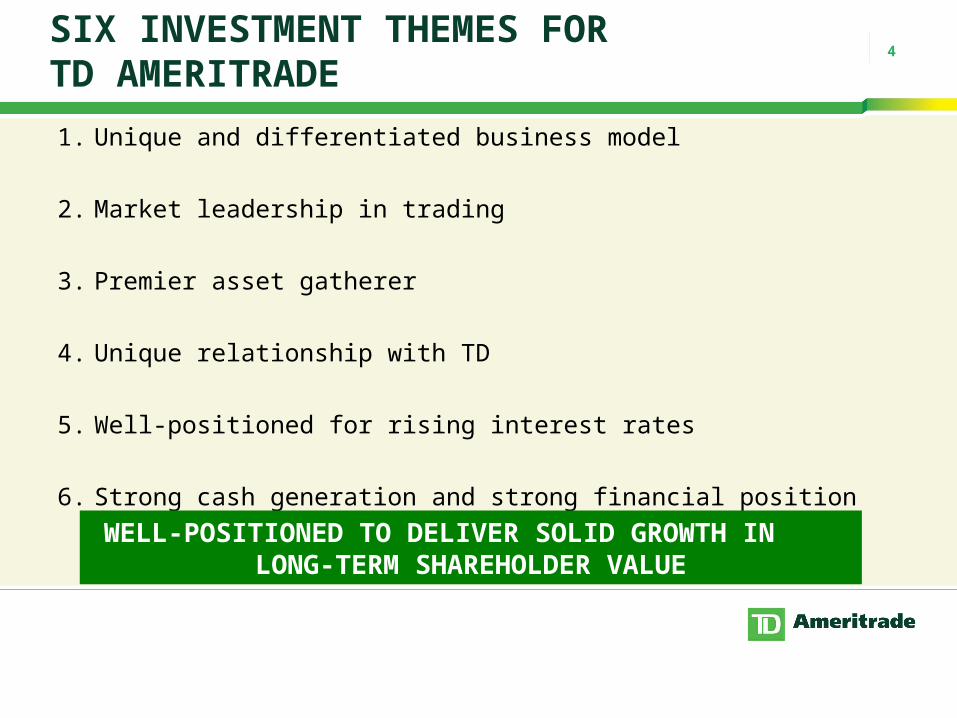
4SIX INVESTMENT THEMES FOR TD AMERITRADE
1. Unique and differentiated business model
2. Market leadership in trading
3. Premier asset gatherer
4. Unique relationship with TD
5. Well-positioned for rising interest rates
6. Strong cash generation and strong financial positionWELL-POSITIONED TO DELIVER SOLID GROWTH IN
LONG-TERM SHAREHOLDER VALUE
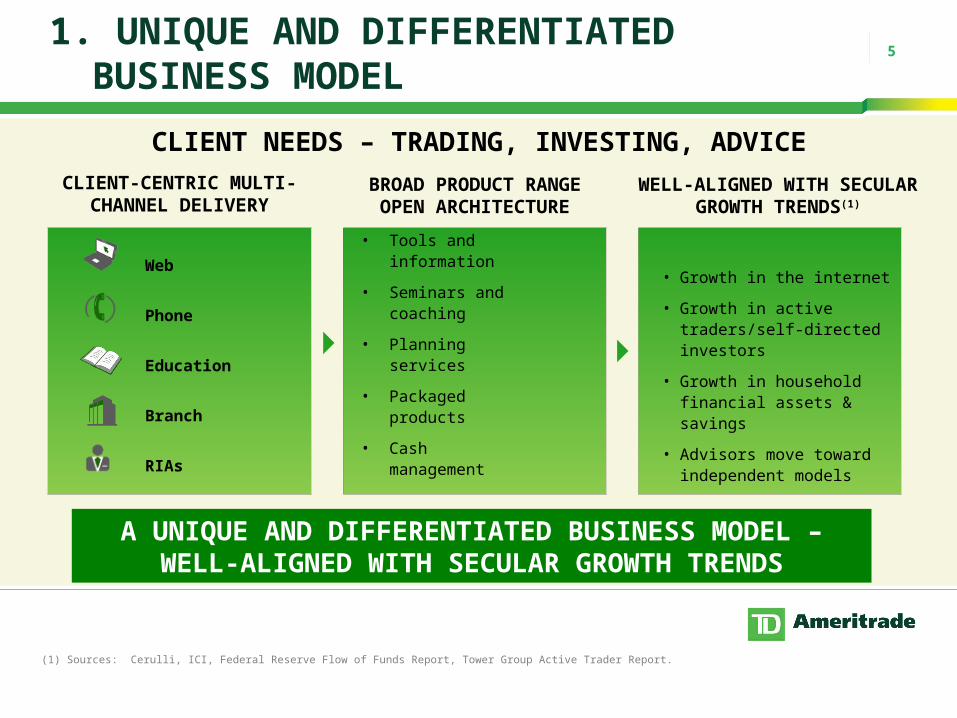
51. UNIQUE AND DIFFERENTIATED
BUSINESS MODEL
CLIENT NEEDS – TRADING, INVESTING, ADVICE
CLIENT-CENTRIC MULTI-CHANNEL DELIVERY
BROAD PRODUCT RANGEOPEN ARCHITECTURE
Web
Phone
Education
Branch
RIAs
• Tools and information
• Seminars and coaching
• Planning services
• Packaged products
• Cash management
A UNIQUE AND DIFFERENTIATED BUSINESS MODEL – WELL-ALIGNED WITH SECULAR GROWTH TRENDS
WELL-ALIGNED WITH SECULAR GROWTH TRENDS(1)
• Growth in the internet
• Growth in active traders/self-directed investors
• Growth in household financial assets & savings
• Advisors move toward independent models
(1) Sources: Cerulli, ICI, Federal Reserve Flow of Funds Report, Tower Group Active Trader Report.
6
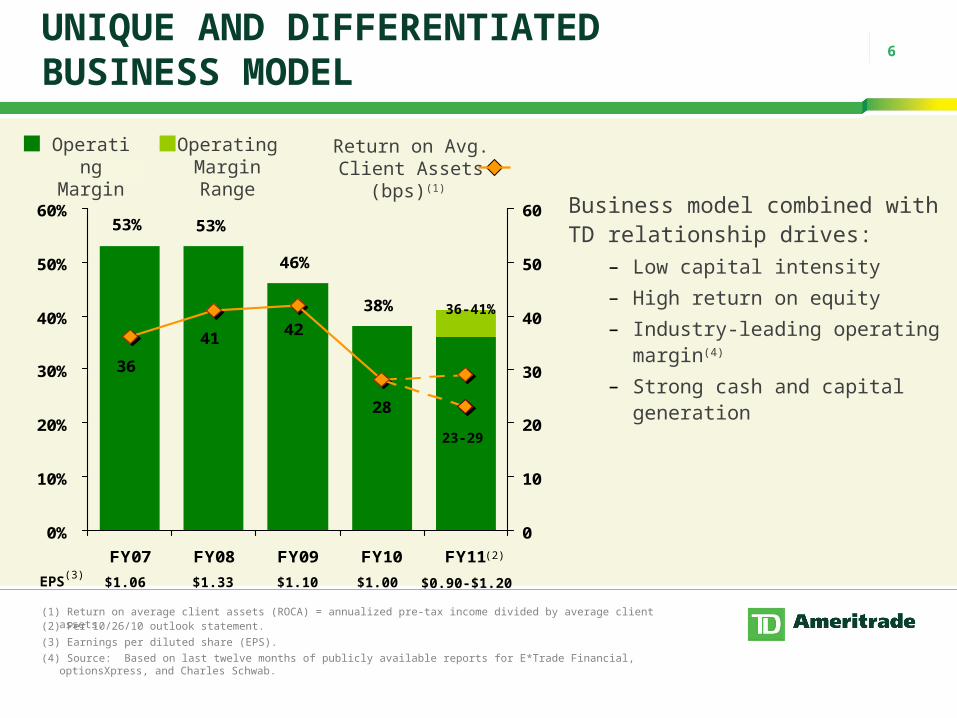
38%
53% 53%
46%
4241
36
28
0%
10%
20%
30%
40%
50%
60%
FY07 FY08 FY09 FY10 FY11
0
10
20
30
40
50
60
Operating Margin
Return on Avg. Client Assets (bps)(1)
(1) Return on average client assets (ROCA) = annualized pre-tax income divided by average client assets.
EPS(3)
$1.06 $1.33 $1.10 $1.00
(4) Source: Based on last twelve months of publicly available reports for E*Trade Financial, optionsXpress, and Charles Schwab.
(3) Earnings per diluted share (EPS).
UNIQUE AND DIFFERENTIATED BUSINESS MODEL
Business model combined with TD relationship drives:
– Low capital intensity
– High return on equity
– Industry-leading operating margin(4)
– Strong cash and capital generation
$0.90-$1.20
36-41%
23-29
(2)
(2) Per 10/26/10 outlook statement.
Operating Margin Range
7
0
100
200
300
400
FY07 FY08 FY09 FY10 FY11
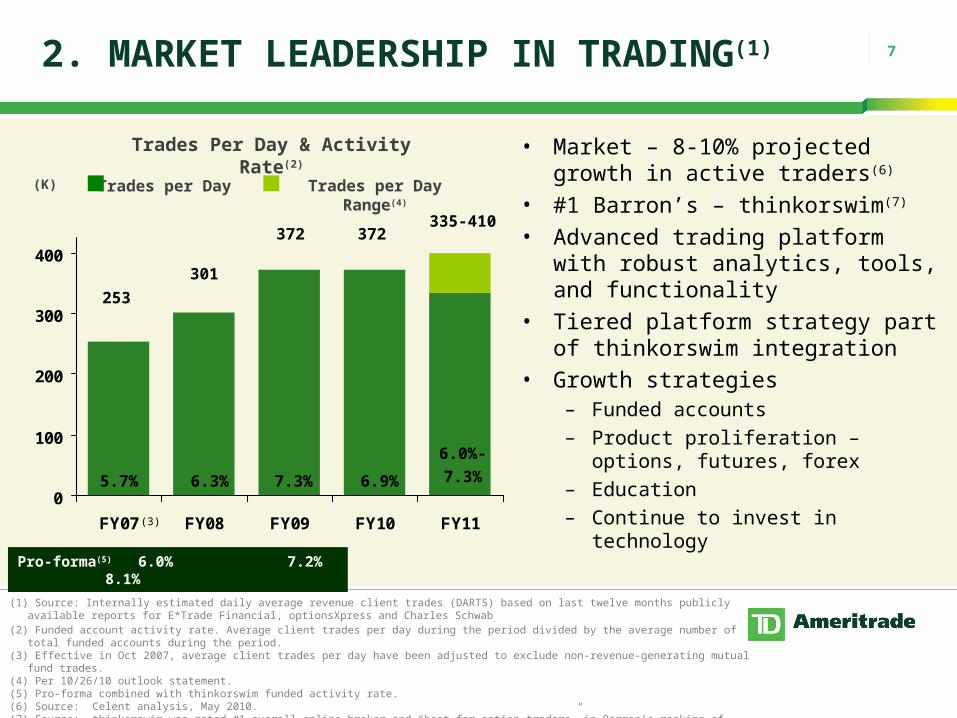
Trades Per Day & Activity Rate(2)
(1) Source: Internally estimated daily average revenue client trades (DARTS) based on last twelve months publicly available reports for E*Trade Financial, optionsXpress and Charles Schwab.
(2) Funded account activity rate. Average client trades per day during the period divided by the average number of total funded accounts during the period.(3) Effective in Oct 2007, average client trades per day have been adjusted to exclude non-revenue-generating mutual fund trades.(4) Per 10/26/10 outlook statement. (5) Pro-forma combined with thinkorswim funded activity rate.(6) Source: Celent analysis, May 2010.(7) Source: thinkorswim was rated #1 overall online broker and “best for option traders” in Barron’s ranking of online brokers 3/15/2010.
253
301
372 372
5.7% 6.3% 7.3% 6.9%
Pro-forma(5) 6.0% 7.2% 8.1%
(K)
(3)
335-410
6.0%-
7.3%
2. MARKET LEADERSHIP IN TRADING(1)
• Market – 8-10% projected growth in active traders(6)
• #1 Barron’s – thinkorswim(7)
• Advanced trading platform with robust analytics, tools, and functionality
• Tiered platform strategy part of thinkorswim integration
futures, forex– Education– Continue to invest in technology
Trades per Day Trades per Day Range(4)
8
$0
$10
$20
$30
$40
FY07 FY08 FY09 FY10 FY11
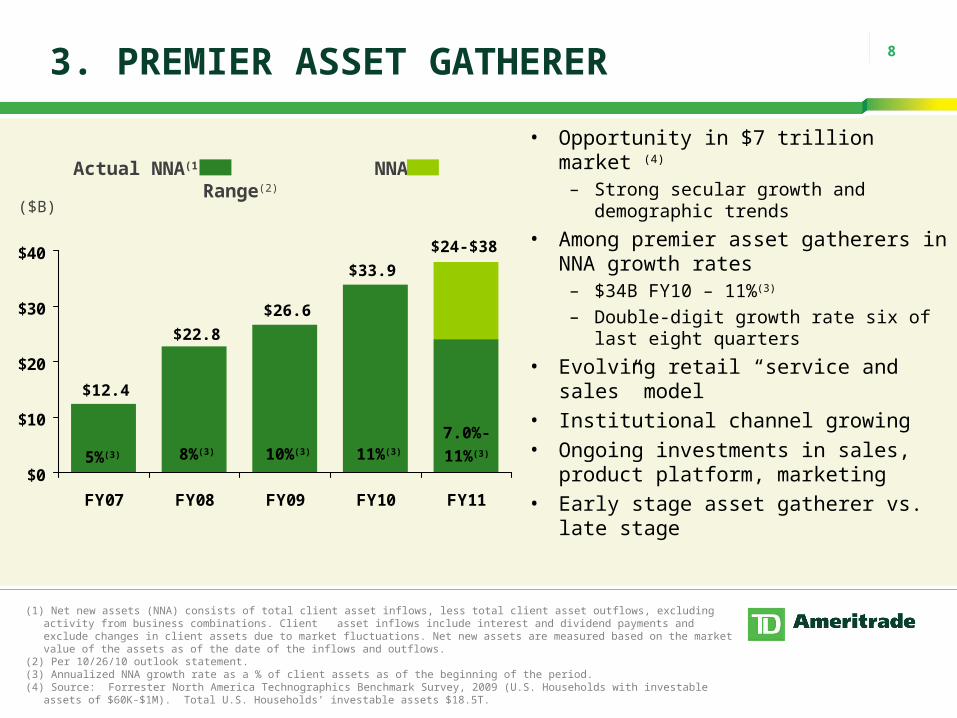
Actual NNA(1) NNA Range(2)
(1) Net new assets (NNA) consists of total client asset inflows, less total client asset outflows, excluding activity from business combinations. Client asset inflows include interest and dividend payments and exclude changes in client assets due to market fluctuations. Net new assets are measured based on the market value of the assets as of the date of the inflows and outflows.
(2) Per 10/26/10 outlook statement.(3) Annualized NNA growth rate as a % of client assets as of the beginning of the period.(4) Source: Forrester North America Technographics Benchmark Survey, 2009 (U.S. Households with investable assets of $60K-$1M). Total U.S.
Households’ investable assets $18.5T.
$12.4
$22.8
$26.6
$33.9
5%(3) 8%(3) 11%(3)
($B)
10%(3)
7.0%-
11%(3)
$24-$38
• Opportunity in $7 trillion market (4)
– Strong secular growth and demographic trends
• Among premier asset gatherers in NNA growth rates
– $34B FY10 – 11%(3)
– Double-digit growth rate six of last eight quarters
• Evolving retail “service and sales” model
• Institutional channel growing • Ongoing investments in sales, product
platform, marketing• Early stage asset gatherer vs. late
stage
3. PREMIER ASSET GATHERER
9
• TD Ameritrade sweeps $44B of client cash (as of 9/30/10) from brokerage accounts into TD Bank– Economics and rewards of retail deposit banking without the risks or capital
requirements of banking
• TD Asset Management provides money market mutual funds ($9B as of 9/30/10) to TD Ameritrade clients– TD retains 6bps and TD Ameritrade retains balance of management fee
• Pursuing cross-selling opportunities– TD Ameritrade to provide investment services through TD branches and
banking products to brokerage clients (U.S.)
– TD Ameritrade to provide access to U.S. markets to TD Waterhouse U.K./Canada clients
(1) Client cash is held in FDIC-insured deposit accounts (IDA) at TD Bank, N.A. and TD Bank USA, N.A. TD Ameritrade, TD Bank, N.A.,TD Bank USA, N.A., TD Asset Management, TD Waterhouse U.K., and TD Waterhouse Canada are affiliated through The Toronto-Dominion Bank.
(2) As of September 30, 2010, TD Bank owned approximately 46% of TD Ameritrade, but TD Bank cannot vote any shares over 45% under terms of the stockholders agreement.
4. UNIQUE RELATIONSHIP WITH TD(1)
TD BANK OWNS ~ 45% OF TD AMERITRADE(2)
10
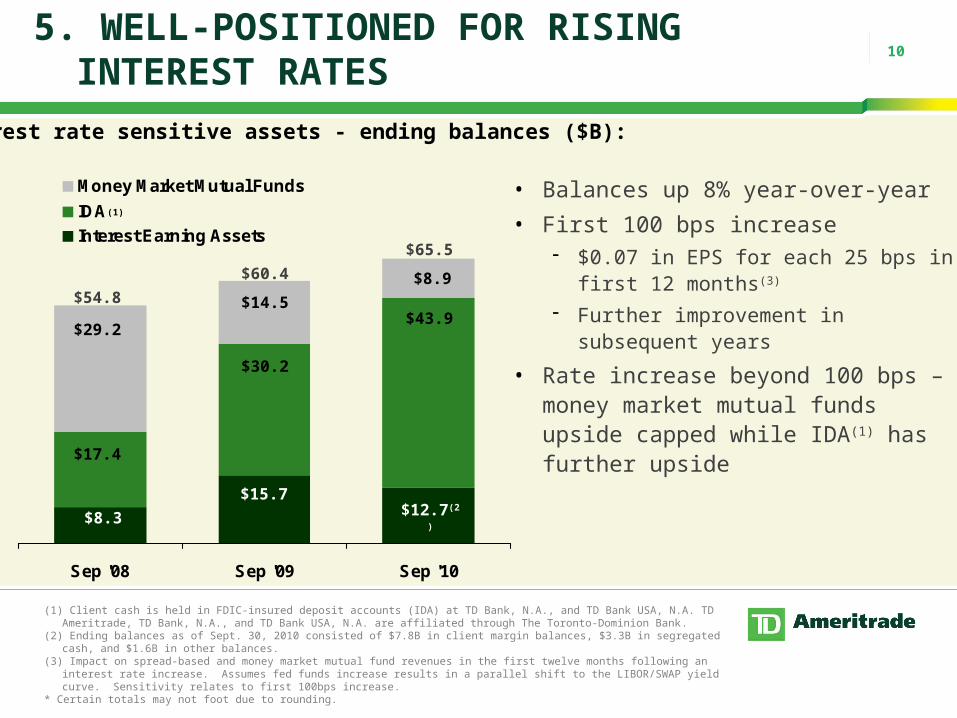
• Balances up 8% year-over-year
• First 100 bps increase $0.07 in EPS for each 25 bps in first
12 months(3)
Further improvement in subsequent years
• Rate increase beyond 100 bps –money market mutual funds upside capped while IDA(1) has further upside
(1) Client cash is held in FDIC-insured deposit accounts (IDA) at TD Bank, N.A., and TD Bank USA, N.A. TD Ameritrade, TD Bank, N.A., and TD Bank USA, N.A. are affiliated through The Toronto-Dominion Bank.
(2) Ending balances as of Sept. 30, 2010 consisted of $7.8B in client margin balances, $3.3B in segregated cash, and $1.6B in other balances.(3) Impact on spread-based and money market mutual fund revenues in the first twelve months following an interest rate increase. Assumes fed
funds increase results in a parallel shift to the LIBOR/SWAP yield curve. Sensitivity relates to first 100bps increase.* Certain totals may not foot due to rounding.
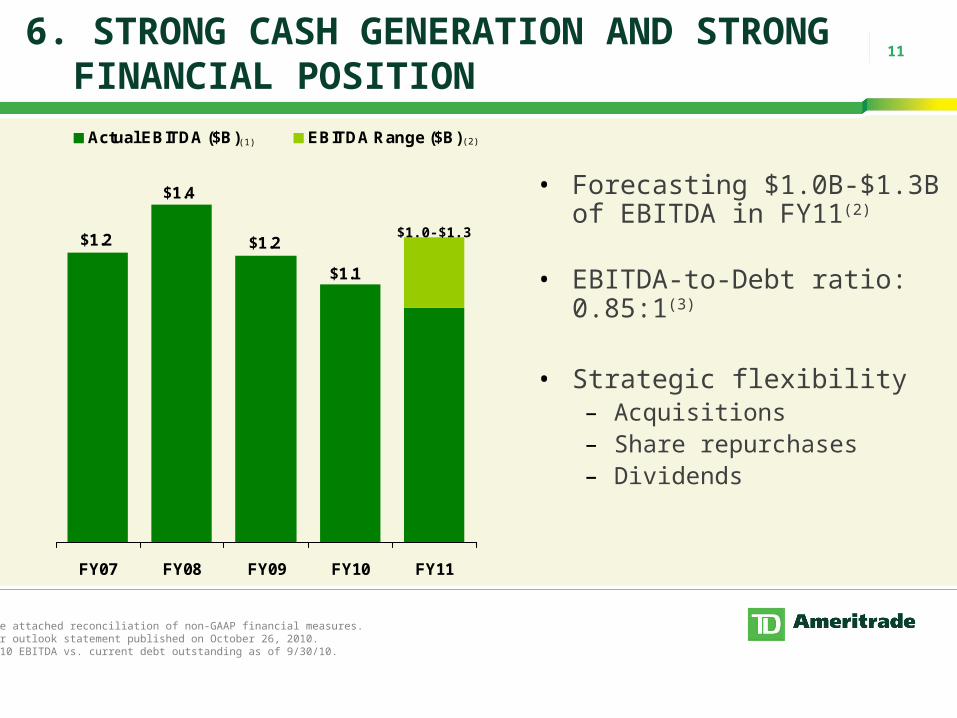
(1) See attached reconciliation of non-GAAP financial measures.(2) Per outlook statement published on October 26, 2010.(3) FY10 EBITDA vs. current debt outstanding as of 9/30/10.
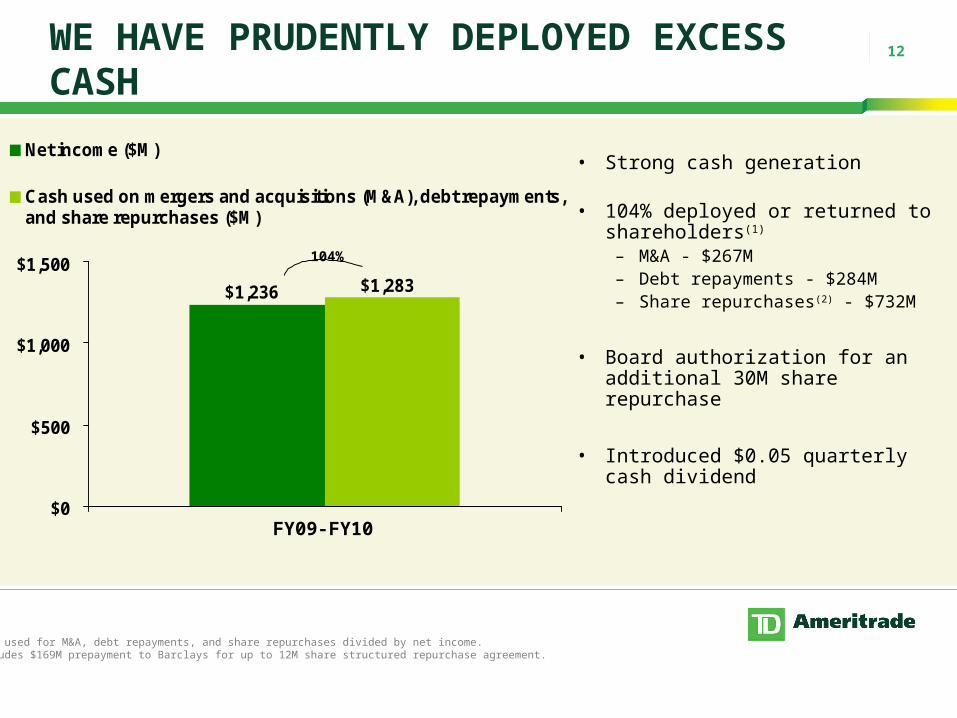
• Board authorization for an additional 30M share repurchase
• Introduced $0.05 quarterly cash dividend
$1,236 $1,283
$0
$500
$1,000
$1,500
Net income ($M)
Cash used on mergers and acquisitions (M&A), debt repayments,and share repurchases ($M)
104%
FY09-FY10
(1) Cash used for M&A, debt repayments, and share repurchases divided by net income.(2) Excludes $169M prepayment to Barclays for up to 12M share structured repurchase agreement.
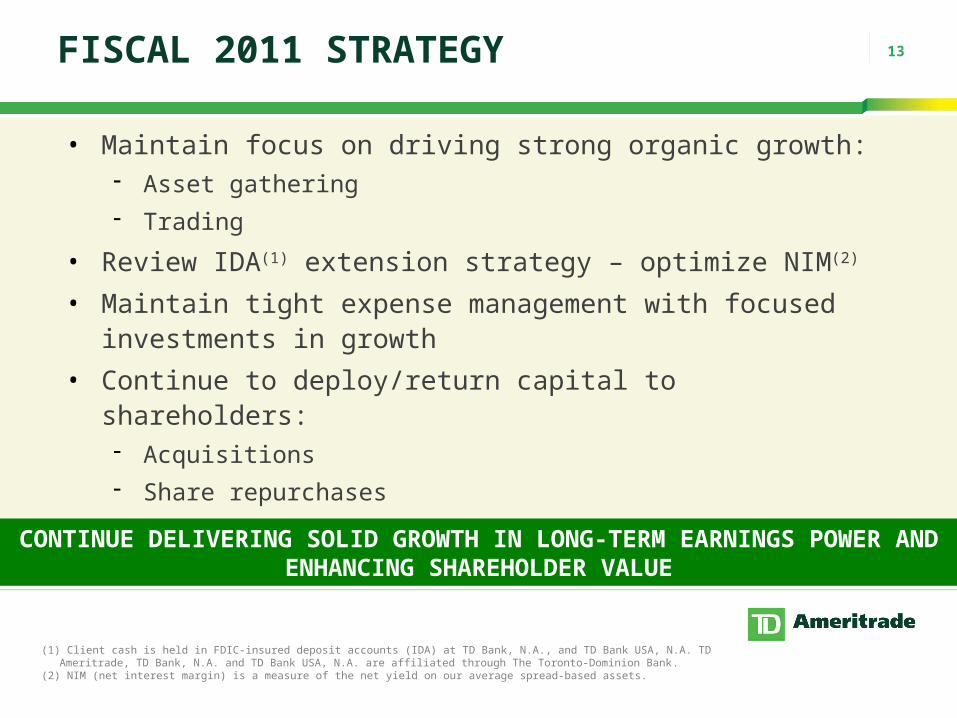
13FISCAL 2011 STRATEGY
• Maintain focus on driving strong organic growth: Asset gathering
• Maintain tight expense management with focused investments in growth
• Continue to deploy/return capital to shareholders: Acquisitions
Share repurchases
Introduced $0.05 quarterly cash dividend
CONTINUE DELIVERING SOLID GROWTH IN LONG-TERM EARNINGS POWER AND ENHANCING SHAREHOLDER VALUE
(1) Client cash is held in FDIC-insured deposit accounts (IDA) at TD Bank, N.A., and TD Bank USA, N.A. TD Ameritrade, TD Bank, N.A. and TD Bank USA, N.A. are affiliated through The Toronto-Dominion Bank.
(2) NIM (net interest margin) is a measure of the net yield on our average spread-based assets.
14CREATING LONG-TERM SHAREHOLDER VALUE
1. Unique and differentiated business model
2. Market leadership in trading
3. Premier asset gatherer
4. Unique relationship with TD
5. Well-positioned for rising interest rates
6. Strong cash generation and strong financial position
WELL-POSITIONED TO DELIVER SOLID GROWTH IN LONG-TERM SHAREHOLDER VALUE
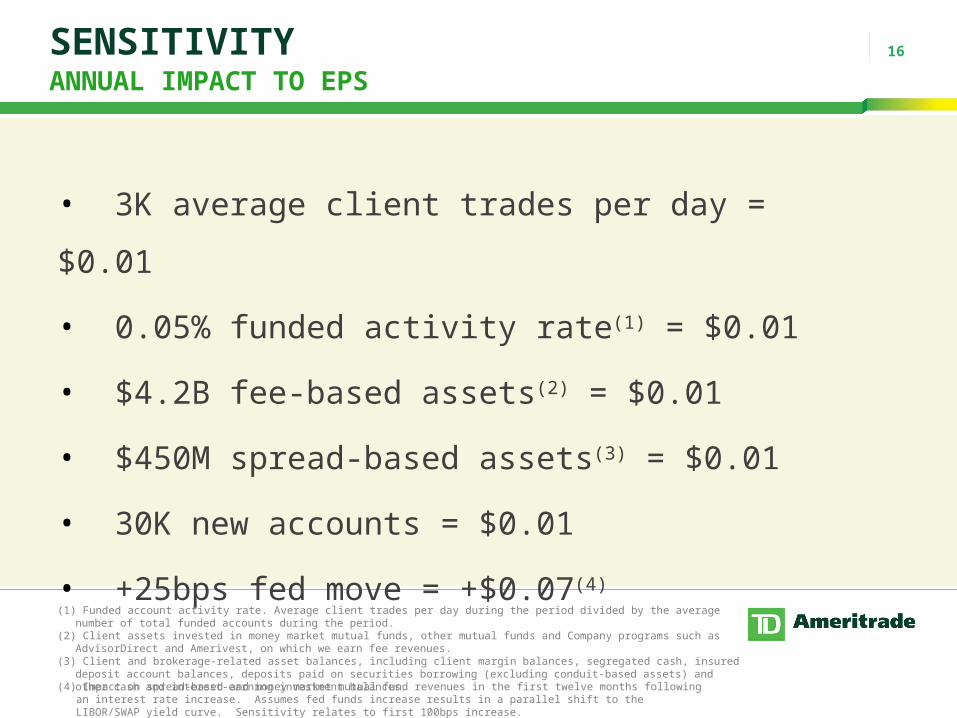
(4) Impact on spread-based and money market mutual fund revenues in the first twelve months following an interest rate increase. Assumes fed funds increase results in a parallel shift to the LIBOR/SWAP yield curve. Sensitivity relates to first 100bps increase.
(1) Funded account activity rate. Average client trades per day during the period divided by the average number of total funded accounts during the period.
(2) Client assets invested in money market mutual funds, other mutual funds and Company programs such as AdvisorDirect and Amerivest, on which we earn fee revenues.
(3) Client and brokerage-related asset balances, including client margin balances, segregated cash, insured deposit account balances, deposits paid on securities borrowing (excluding conduit-based assets) and other cash and interest-earning investment balances.
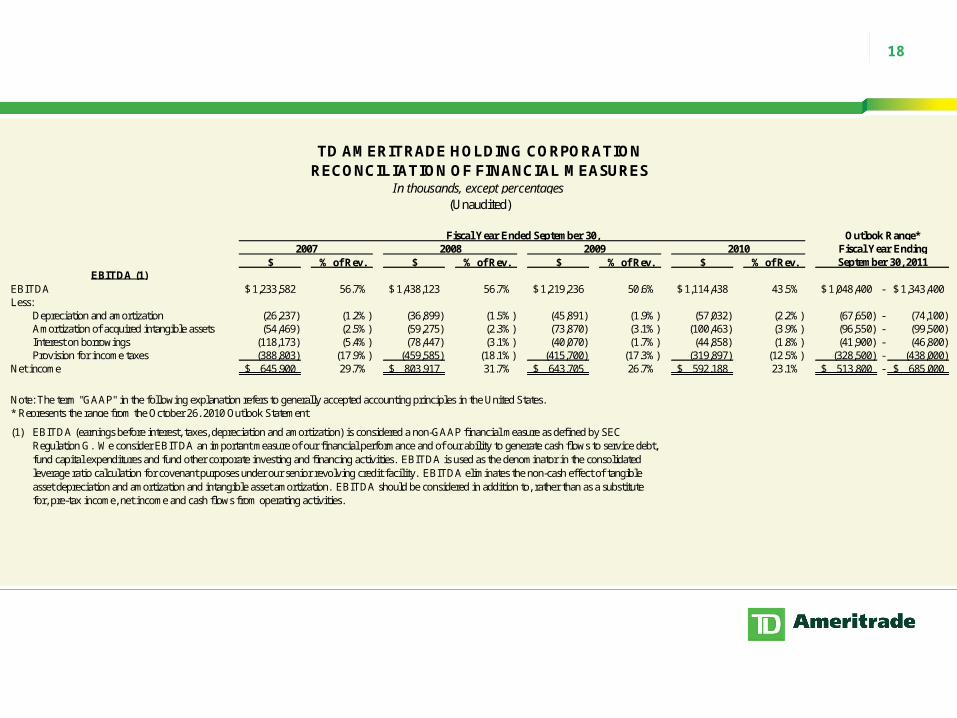
Net income 645,900$ 29.7% 803,917$ 31.7% 643,705$ 26.7% 592,188$ 23.1% 513,800$ - 685,000$
Note: The term "GAAP" in the following explanation refers to generally accepted accounting principles in the United States.* Represents the range from the October 26, 2010 Outlook Statement.
(1)
TD AMERITRADE HOLDING CORPORATIONRECONCILIATION OF FINANCIAL MEASURES
In thousands, except percentages(Unaudited)
Fiscal Year Ended September 30,2010
Outlook Range*Fiscal Year Ending200920082007September 30, 2011
EBITDA (earnings before interest, taxes, depreciation and amortization) is considered a non-GAAP financial measure as defined by SEC Regulation G. We consider EBITDA an important measure of our financial performance and of our ability to generate cash flows to service debt, fund capital expenditures and fund other corporate investing and financing activities. EBITDA is used as the denominator in the consolidated leverage ratio calculation for covenant purposes under our senior revolving credit facility. EBITDA eliminates the non-cash effect of tangible asset depreciation and amortization and intangible asset amortization. EBITDA should be considered in addition to, rather than as a substitute for, pre-tax income, net income and cash flows from operating activities.