Page 1
1
Teacher Pensions and Labor Market Behavior:A Descriptive Analysis
Michael Podgursky, University of Missouri - ColumbiaMark Ehlert, University of Missouri- Columbia
IES Research Conference Washington, DC June 8, 2007.
Page 2
2
Why study teacher retirements?
• Teacher retirements generate vacancies• Teacher retirements generate costs
– Teacher pensions– Retiree health insurance
• Incentives in retirement systems have strong effects on labor supply and mobility– Pension system incentives are potent
• Retirement systems can affect the quantity and quality of the teaching workforce
Page 3
3
Schools face 'death spiral' Editorial/Opinion
2/14/2006Until last week, Los Angeles school officials had thought their unfunded health
care obligation for retirees was $5 billion. Then they scrubbed the numbers. The new estimate: $10 billion. That's bad news for taxpayers who will foot the bill and
for children whose education will be limited by the cost.…
Page 4
4
Michigan's education time bomb: Costly, loophole-ridden retirement system threatens public schools
Ron French | Detroit News | May 10, 2007
Michigan's school retirement system is riddled with loopholes and slipshod policies costing taxpayers hundreds of millions of dollars and driving the state's public education system toward financial crisis.
Page 5
5
Research literature
• Large labor economics literature on pensions and retirements
• Very small literature on teachers– Furgeson, Strauss, Vogt (2006), PA teachers– Brown (2006), CA teachers
• Absence of basic data – Payroll costs (esp. retiree HI)– Parameters of systems (NEA and NASRA incomplete)– Incentive structure of teacher pensions– Teacher labor market data
• SASS TFS• State studies (SEA records linked to pension data)
Page 6
6
Incentives in Pension Systems
• In public sector DB pension systems accrual of pension wealth is highly non-linear and back-loaded
• State systems generally have sharp “spikes” in accrual rates
– Pull teachers to spike– Push out after
• Not inherent in DB pension systems.– “cash balance” (IBM and other firms)
Page 7
7
Figure 2A. Annual deferred income: Missouri
age of first pension draw indicated
53
65646362616059
5857565554
53
54
55
56
57
58
59
606060606060606060606060606060
-50%
0%
50%
100%
150%
200%
25 26 27 28 29 30 31 32 33 34 35 36 37 38 39 40 41 42 43 44 45 46 47 48 49 50 51 52 53 54 55 56 57 58 59 60 61 62 63 64 65
age at separation (entry age = 25)
pe
rce
nt
of
sa
lary
Increment to PV of Pension Wealth from Working an Additional Year
Source: Costrell and Podgursky (2007)
“Spikes” are common
Loss of PensionWealth
Page 8
8
Figure 2B. Annual deferred income: Arkansasage of first pension draw indicated
60606060606060606060606060606060606060
50
535251
-100%
0%
100%
200%
300%
400%
500%
25 26 27 28 29 30 31 32 33 34 35 36 37 38 39 40 41 42 43 44 45 46 47 48 49 50 51 52 53 54 55 56 57 58 59 60 61 62 63 64 65
age at separation (entry age = 25)
pe
rce
nt
of
sa
lary
Source: Costrell and Podgursky (2007)
Page 9
9
Figure 2C. Annual deferred income: Massachusettsage of first pension draw indicated
626160
59
54
585756
55
656463
62
616059585756545454545454545454555555555555555555
55
-100%
-50%
0%
50%
100%
150%
200%
250%
300%
25 26 27 28 29 30 31 32 33 34 35 36 37 38 39 40 41 42 43 44 45 46 47 48 49 50 51 52 53 54 55 56 57 58 59 60 61 62 63 64 65
age at separation (entry age = 25)
pe
rce
nt
of
sa
lary
prior to 2001
since 2001
Source: Costrell and Podgursky (2007)
Page 10
10
Figure 2D. Annual deferred income: Californiaage of first pension draw indicated
62
61
56
5657 58 59
63 64 65
60
5757 57 57 57 57 57 57 57 57 57 57 57 57 57 57 57 57 57
57
57 57 5757 5757
61 62
-50%
0%
50%
100%
150%
200%
25 26 27 28 29 30 31 32 33 34 35 36 37 38 39 40 41 42 43 44 45 46 47 48 49 50 51 52 53 54 55 56 57 58 59 60 61 62 63 64 65
age at separation (entry age = 25)
pe
rce
nt
of
sa
lary
prior to 1999
since 1999
Source: Costrell and Podgursky (2007)
Page 11
11
Figure 6. Annual deferred income, as % of earningsage of first pension draw indicated
55
64
636261
60
59
585756
55
55
55
55
55
60606060606060606060606060606060606060
-50%
0%
50%
100%
150%
200%
25 26 27 28 29 30 31 32 33 34 35 36 37 38 39 40 41 42 43 44 45 46 47 48 49 50 51 52 53 54 55 56 57 58 59 60 61 62 63 64 65
age at separation (entry age = 25) (Assumptions: see Figure 3)
pe
rce
nt
of
sa
lary
Ohio
Page 12
12
1990-91A + E ≥ 45Full-TimeTeachersN= 31,060
2005-06
21,240Retirements
Missouri Longitudinal Teacher Data File
Page 13
13
Frequency Distribution of Age + Missouri Experience"Rule of 80"
0.0
1.0
2.0
3.0
4.0
5.0
6.0
7.0
8.0
9.0
47
49
52
54
56
58
60
62
64
66
68
70
72
74
76
78
80
82
84
86
88
90
92
94
96
98
100
102
104
106
108
110
112
114
116
118
120
122
125
127
134
Age + MOEXP
Pe
rce
nt
80
Distribution of Age + Experience
Page 14
14
0
2
4
6
8
10
12
50 o
r younger
51
52
53
54
55
56
57
58
59
60
61
62
63
64
65
66
67
68
69
70 o
r old
er
Age
Perc
en
t
Median Age
Distribution of Age
Page 15
15
0
2
4
6
8
10
12
14
16
15
or fe
we
r
16
17
18
19
20
21
22
23
24
25
26
27
28
29
30
31
32
33
34
35
36
37
38
39
40
or m
ore
MOEXP
Perc
en
t
Median Experience
29
Distribution of Experience
Page 16
16
0.0
10.0
20.0
30.0
40.0
50.0
60.0
70.0
80.0
90.0
100.0
50
or yo
un
ge
r
51
52
53
54
55
56
57
58
59
60
61
62
63
64
65
66
67
68
69
70
or o
lde
r
Age Group
Cu
mu
lati
ve
Pe
rce
nt
Male
Female
Cumulative Distribution of Age: Male vs Female
Page 17
17
0.000
10.000
20.000
30.000
40.000
50.000
60.000
70.000
80.000
90.000
100.000
50
or yo
un
ger
51
52
53
54
55
56
57
58
59
60
61
62
63
64
65
66
67
68
69
70
or o
lde
r
Age Group
Cu
mu
lati
ve
Pe
rce
nt
RURAL
URBAN
Cumulative Distribution of Age: Rural vs Urban
Page 18
18
0.00
10.00
20.00
30.00
40.00
50.00
60.00
70.00
80.00
90.00
100.00
50
or yo
un
ger
51
52
53
54
55
56
57
58
59
60
61
62
63
64
65
66
67
68
69
70
or o
lde
r
Age Group
Cu
mu
lati
ve
Pe
rce
nt
WHITE
BLACK
Cumulative Distribution of Age: White vs Black
Page 19
19
0.0
10.0
20.0
30.0
40.0
50.0
60.0
70.0
80.0
90.0
100.0
50 o
r youn
ger
51
52
53
54
55
56
57
58
59
60
61
62
63
64
65
66
67
68
69
70 o
r old
er
Age Group
Cu
mu
lati
ve
Pe
rce
nt
ELEMENTARY
SECONDARY
Cumulative Distribution of Age: Elementary vs Secondary
Page 20
20
Structure of 2000-01 SASS Teacher Follow Up Survey
SASSTeacherFollow-UpSurvey2000-01
Current TeacherSurvey
Former TeacherSurvey
Retired?
Collecting TeacherRetirement Pension
Page 21
21
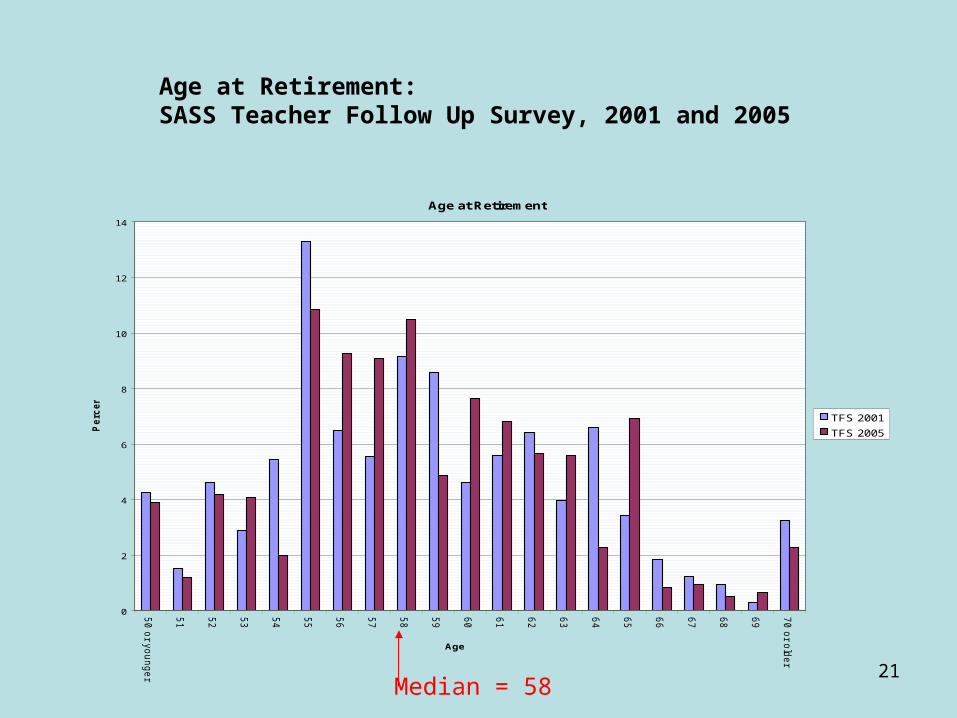
Age at Retirement: SASS Teacher Follow Up Survey, 2001 and 2005
Age at Retirement
0
2
4
6
8
10
12
14
50
or y
ou
ng
er
51
52
53
54
55
56
57
58
59
60
61
62
63
64
65
66
67
68
69
70
or o
lde
r
Age
Pe
rce
nt
TFS 2001
TFS 2005
Source: Schools and Staffing Surveys: 2001 & 2005 Teacher Follow Up Survey
Median = 58
Page 22
22
Teaching Experience at Retirement: SASS Teacher Follow Up Survey, 2001 and 2005
Teaching Experience at Retirement
0
1
2
3
4
5
6
7
8
9
10
11
12
13
15
or fe
we
r
16
17
18
19
20
21
22
23
24
25
26
27
28
29
30
31
32
33
34
35
36
37
38
39
40
or m
ore
Total Years of Experience
Pe
rce
nt
TFS 01
TFS 05
Source: Schools and Staffing Surveys: 2001 & 2005 Teacher Follow Up Survey
Page 23
23
Cumulative Distribution of Teacher Retirement Ages:Teacher Follow Up Surveys, Schools and Staffing Surveys, 2001 and 2005
0
10
20
30
40
50
60
70
80
90
100
50
or y
ou
ng
er
51
52
53
54
55
56
57
58
59
60
61
62
63
64
65
66
67
68
69
70
or o
lde
r
Age
Cu
mu
lati
ve
Pe
rce
nt
TFS 2001
TFS 2005
Source: Schools and Staffing Surveys: 2001 & 2005 Teacher Follow Up Survey
58
Page 24
24
Retirement Age in Missouri and the US:Missouri and SASS Teacher Follow Up Survey 2001.
0.0
10.0
20.0
30.0
40.0
50.0
60.0
70.0
80.0
90.0
100.0
50
or y
ou
ng
er
51
52
53
54
55
56
57
58
59
60
61
62
63
64
65
66
67
68
69
70
or o
lde
r
Age
Cu
mu
lati
ve
Pe
rce
nt
MO
TFS 2001
Source: Schools and Staffing Surveys: 2001 & 2005 Teacher Follow Up Survey
Page 25
25
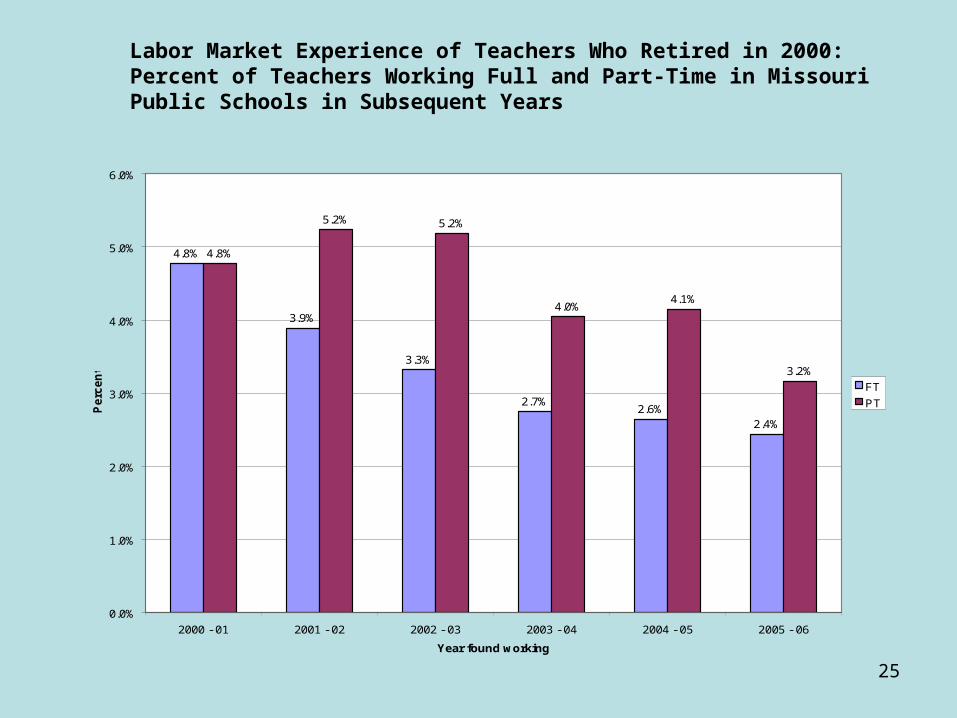
Labor Market Experience of Teachers Who Retired in 2000:Percent of Teachers Working Full and Part-Time in Missouri Public Schools in Subsequent Years
4.8%
3.9%
3.3%
2.7%2.6%
2.4%
4.8%
5.2% 5.2%
4.0%4.1%
3.2%
0.0%
1.0%
2.0%
3.0%
4.0%
5.0%
6.0%
2000 - 01 2001 - 02 2002 - 03 2003 - 04 2004 - 05 2005 - 06
Year found working
Pe
rce
nt
FT
PT
Page 26
26
Retirement Age in Missouri and the US:Missouri and SASS Teacher Follow Up Survey 2001.
0.0
10.0
20.0
30.0
40.0
50.0
60.0
70.0
80.0
90.0
100.0
50 or younger
51 52 53 54 55 56 57 58 59 60 61 62 63 64 65 66 67 68 69 70 or older
Age
Cu
mu
lati
ve P
erce
nt
MO Age -Retired
MO Age -Retired &QuitWorking
TFS 2001
Source: Schools and Staffing Surveys: 2001 & 2005 Teacher Follow Up
Page 27
27
Structure of 2003-04 SASS Teacher Follow Up Survey
SASSTeacherFollow-UpSurvey2003-04
Current TeacherSurvey
Former TeacherSurvey
Collecting Teacher Pension?
5.3%(4.9% of total pop.)
91.6%
8.4%
Page 28
28
• Full paper at www.caldercenter.org