54
1 Thailand’s Economic Crisis in 1997
| Date post: | 25-Dec-2015 |
| Category: |
Documents |
| Upload: | debra-mckinney |
| View: | 218 times |
| Download: | 2 times |

1
Thailand’s Economic Crisis in 1997

2
References
• Peter Warr (ed.) (2005), Thailand Beyond the Crisis – Ch.1: Boom, Bust and Beyond, by
Peter Warr
– Ch.2: Anatomy of the Thai Economic Crisis, by Ammar Siamwalla

3
• High economic growth during 1986 – 1995 in Thailand as part of the “East Asian Miracle”• Large influx of FDI and short-term capital inflows
Background

4
High economic growth in 1990s
Year Economic Growth
1991 8.6%1992 8.0%1993 8.4%1994 9.0%1995 8.8%1996 5.9%

5
• High growth of exports of manufactured products• Trade and current account deficits, but BOP surpluses accumulated reserves

6
Year Current Account Nominal GDP Current Account
(Mill. Baht) (Bill. Baht) as % of GDP
1990 -186,184 2,183.5 -8.53%
1991 -193,263 2,506.6 -7.71%
1992 -160,074 2,830.9 -5.65%
1993 -161,129 3,165.2 -5.09%
1994 -203,153 3,629.3 -5.60%
1995 -338,346 4,186.2 -8.08%
1996 -372,159 4,611.0 -8.07%
Thailand's Current Account and GDP
7
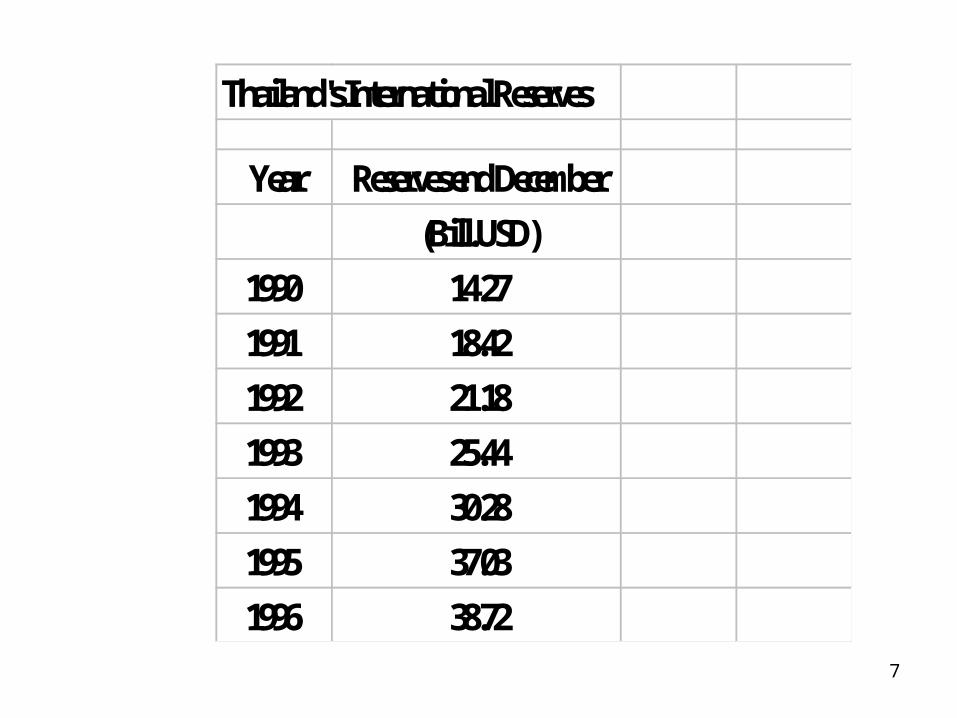
Thailand's International Reserves
Year Reserves end December
(Bill. USD)
1990 14.27
1991 18.42
1992 21.18
1993 25.44
1994 30.28
1995 37.03
1996 38.72

8
• Bank of Thailand (BOT) in early 1990s liberalized the financial system: (to be regional financial center)
relaxed interest ceilingsreduced exchange controlopen the Bangkok International Banking Facility (BIBF or offshore banking) Non-resident baht account
The Crisis

9
• Foreign money at lower interest rates and fixed exchange rate, leading to heavy borrowing by private sector (both banks and non-bank), mainly short-term debts• Investment boom, and speculation in real estate and stock market• BOT failed to implement strict prudential regulation, and credit control on financial institutions

10
• Stagnant exports in 1996 – 20% growth in previous years, down to no growth– slowdown of manufactured labor-intensive exports– shook confidence among investors and creditors and “triggered” the crisis

11
• Stock prices started declining in second half of 1996, affecting finance companies revenue: first sign of “bubble burst”• In November 1996, first waves of attack on the baht by foreign speculators, hoping for baht devaluation• BOT defended the baht, losing some foreign reserves• BOT took some measures to discourage short-term capital inflow
12
• Second wave of attacks on the baht in February 1997
• BOT raised interest rates to make it more costly for speculators, but this adversely affected finance companies
• Third wave of baht attacks in May 1997 prompted BOT to control baht borrowing by foreigners

13
• BOT “swap” by buying $ spot and selling it forward, showing no loss in gross reserves
• Last attack on the baht in June 1997 left BOT with almost no net reserves
• BOT was forced to float the baht on July 2; its value sharply depreciated from 27 immediately to 30 baht/USD and to almost 60 baht/USD in January 1998 (managed float system)

14
• The cheaper baht made foreign debts more expensive in baht terms for both banks and nonbanks with $ debts, badly affected their balance sheets, and leading to lending reduction and financial chaos
15
• Many finance companies were “suspended”, causing panic of deposit withdrawals
• BOT used the “Financial Institution Development Fund” (FIDF) to solve the problem, but failed and most finance companies were finally closed
• Five banks were taken over by FIDF/BOT

16
• 91 finance companies (FCs) before 1997, lending at higher interest rates than banks and borrow by issuing promissory notes (IUOs)
• March 1997: BOT asked 10 FCs to increase capital or merge
a run on them and other FCs more loans from FIDF
• June 1997: BOT suspended 16 FCs; deposits (promissory notes) replaced with extended maturity
huge run on both FCs and banks

17
• August 1997: BOT suspended 42 more FCs (2 July baht float hurt their balance sheets heavy borrowing from FIDF)
• December 1997: 56 FCs (out of the suspended 58) were closed permanently; their assets acquired by FIDF were transferred to the Financial Sector Restructuring, and eventually sold for much less than their face value

18
• For commercial banks (CBs), more serious and difficult problem due to larger size and bigger impact: one bank closed, 4 banks taken over by FIDF
• Banks’ balance sheets affected by collapse in real estate + credit risks from baht depreciation (bank clients with $ debts) Non-performing loans (NPLs) peaked
at > 40% of total loans
19
• Banks’ balance sheets affected by collapse in real estate + credit risks from baht depreciation (bank borrowers with $ debts)Non-performing loans (NPLs) peaked
at > 40% of total loans banks unwilling to lend more, firms
unable to borrow “strategic NPLs” by firms in need of
cash

20
• NPLs created a need for banks to increase their capital (equity): most banks had to rely on government funding
• Solving the NPL problem: Very high NPLs in the crisis because: Thai banks lend on collateral (land,
buildings) and personal trust (connection), hence risks could be high

21
• Solving the NPL problem: Very high NPLs in the crisis because: Thai banks lend on collateral (land,
buildings) and personal trust (connection), hence risks could be high
Most Thai firms are highly leveraged, relying on short-term loans from banks
In 1990s firms owed large debts in $Threfore, both banks and firms are
vulnerable to the crisis
22
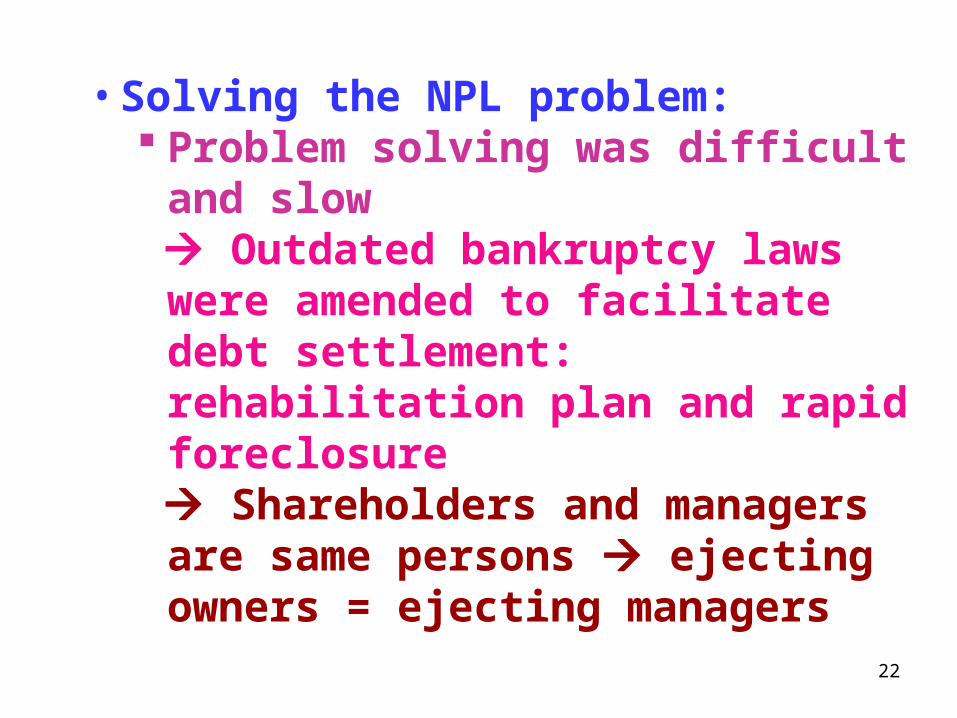
• Solving the NPL problem: Problem solving was difficult and slow Outdated bankruptcy laws were
amended to facilitate debt settlement: rehabilitation plan and rapid foreclosure
Shareholders and managers are same persons ejecting owners = ejecting managers

23
• Solving the NPL problem: Problem solving was difficult and slow Thai banks prefer debt restructuring
rather than debt writeoffs to avoid high burden in recapitalization debtors recovered too slowly
Many firms had a large number of creditors (TPI had 140 creditors!)
24
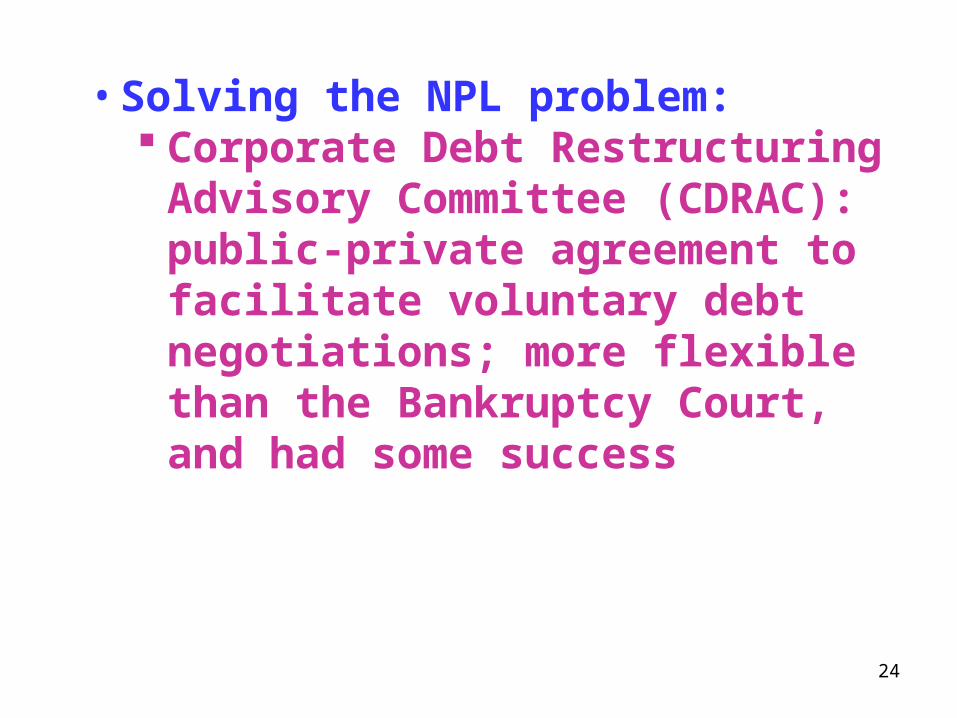
• Solving the NPL problem: Corporate Debt Restructuring Advisory
Committee (CDRAC): public-private agreement to facilitate voluntary debt negotiations; more flexible than the Bankruptcy Court, and had some success

25
• Solving the NPL problem: Thai Asset Management Corporation
(TAMC), set up in 2001 to buy multi-creditor NPLs from state-owned banks, using government bonds, to facilitate debt repayment and improve banks’ financial position

26
• Several banks ended up with more foreign and/or government ownership; some were merged to become bigger banks

27
• Private investment down from 33% of GDP to 10% during 1996 - 98
• Sharp drops of production in most sectors, particularly finance, construction, manufacturing and some services; not much decline in agriculture
• Big declines of GDP and employment• Unemployment and excess capacities
28
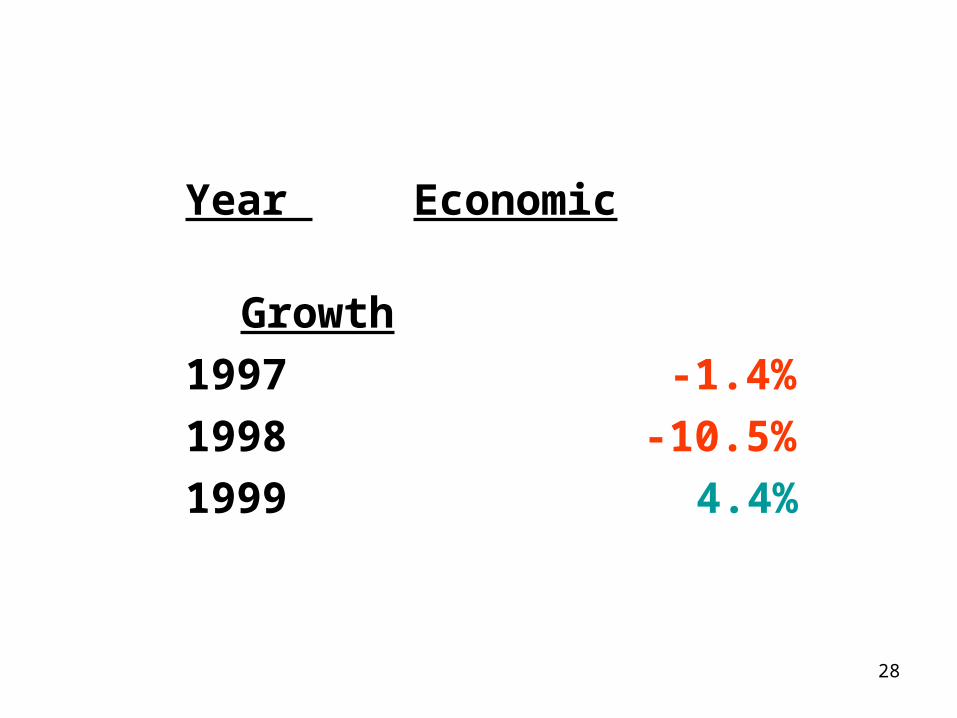
Year Economic
Growth
1997 -1.4%
1998 -10.5%
1999 4.4%

29
Contribution to Growth of Real GDP
1996 1997 1998 1999 2000
Expenditure Side:
Private consumption 3.2 -0.7 -6.3 2.3 2.7
Government consumption 1.0 -0.2 0.3 0.3 0.2
Investment 3.0 -8.7 -15.2 -0.7 1.1
Private 0.0 -9.8 -11.8 -0.4 1.9
Public 0.0 1.1 -3.3 -0.3 -0.8
Exports -2.6 3.0 3.8 5.0 10.1
Imports 0.3 5.6 9.6 -4.1 -11.2
Change in inventories -0.7 -0.7 -2.2 2.3 1.1
GDP 5.9 -1.4 -10.5 4.4 4.8
30
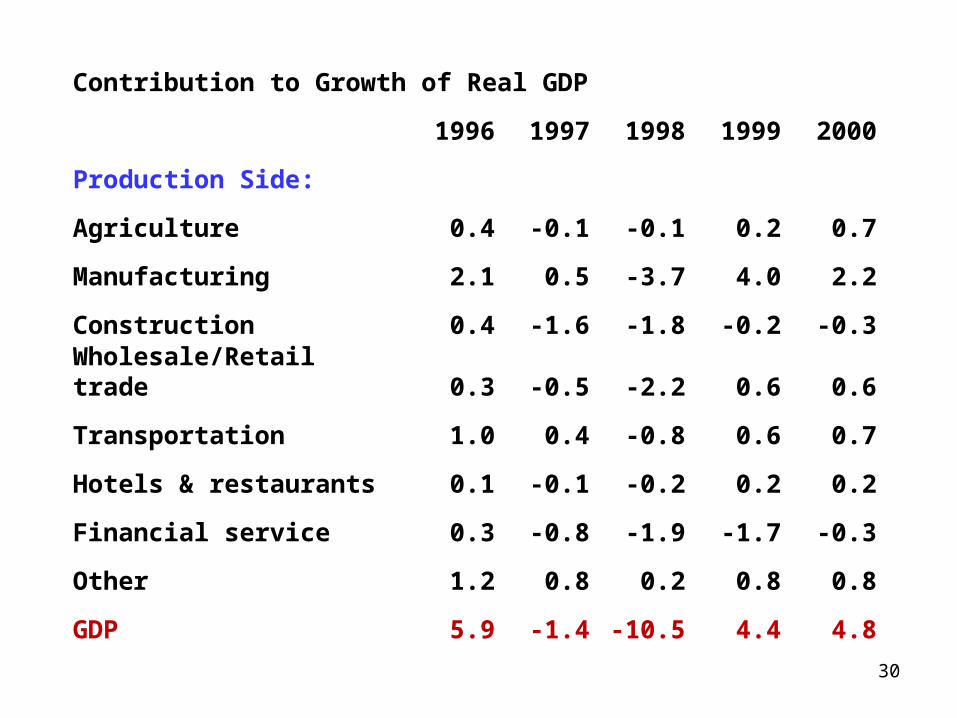
Contribution to Growth of Real GDP
1996 1997 1998 1999 2000
Production Side:
Agriculture 0.4 -0.1 -0.1 0.2 0.7
Manufacturing 2.1 0.5 -3.7 4.0 2.2
Construction 0.4 -1.6 -1.8 -0.2 -0.3
Wholesale/Retail trade 0.3 -0.5 -2.2 0.6 0.6
Transportation 1.0 0.4 -0.8 0.6 0.7
Hotels & restaurants 0.1 -0.1 -0.2 0.2 0.2
Financial service 0.3 -0.8 -1.9 -1.7 -0.3
Other 1.2 0.8 0.2 0.8 0.8
GDP 5.9 -1.4 -10.5 4.4 4.8

31

32
• Loans from IMF and friendly countries ($17 bill.) in late 1997
• IMF’s loan condition: strict fiscal and monetary policies worsened the situation, but later relaxed
• “Contagion” effect: crisis spread to Indonesia, Malaysia, Singapore, and South Korea
• Political repercussion: PM Chawalit gave way to Chuan

33

34
Causes of the Crisis
Two groups: • External factors (3)• Domestic factors (4)

35
External factor no. 1
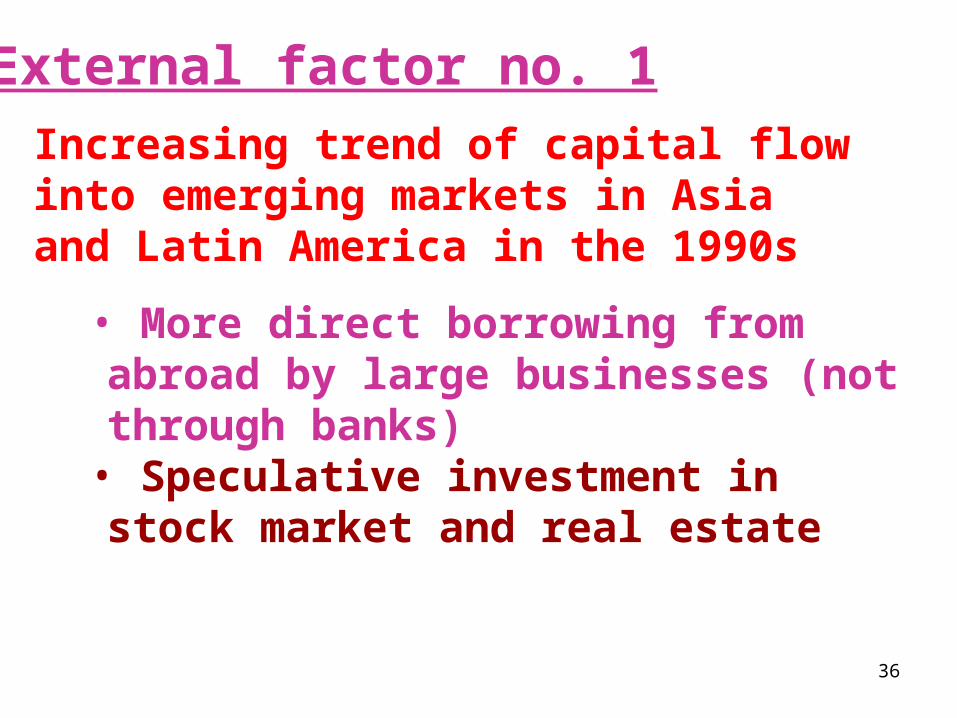
Increasing trend of capital flow into emerging markets in Asia and Latin America in the 1990s
• Financial liberalization by Thailand: no interest rate ceilings, Bangkok International Banking Facility (BIBF), non-resident baht account
36
• More direct borrowing from abroad by large businesses (not through banks)
• Speculative investment in stock market and real estate
Increasing trend of capital flow into emerging markets in Asia and Latin America in the 1990s
External factor no. 1
37
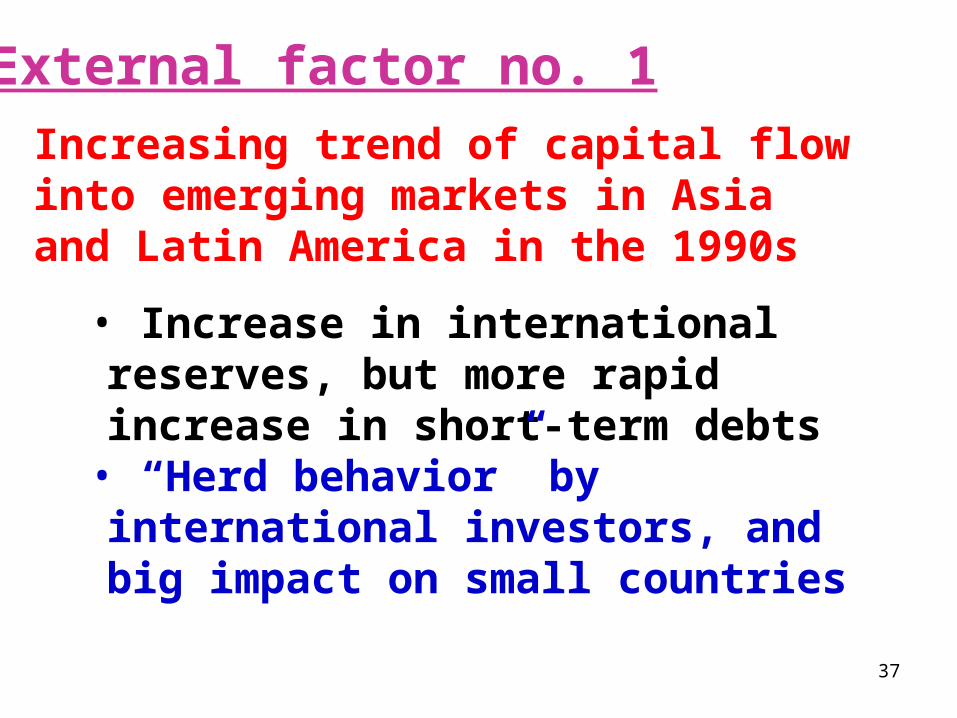
• Increase in international reserves, but more rapid increase in short-term debts
• “Herd behavior” by international investors, and big impact on small countries
Increasing trend of capital flow into emerging markets in Asia and Latin America in the 1990s
External factor no. 1

38
External Factor no. 2
Continuous deficits in the current account, exceeding 5% of GDP before the crisis, affecting the confidence in repayment ability

39
External factor no. 3
Stagnant exports in 1996 because:
• The baht was overvalued: “real appreciation” of baht (higher price of nontraded goods to traded goods)
• Slowdown in export markets for electronics
• Competition from China• The era of “cheap labor” is over

40
Domestic factor no. 1
Weakness in business fund raising
• Borrowing from banks using land and buildings as collateral, heavy reliance on bank short-term loans
• Banks gave credit without proper risk assessment (no analysis of feasibility and cash flow of investment projects)
• “Crony capitalism”: loans to friends and people with good connection

41
Domestic factor no. 1
Weakness in business fund raising
• Firms borrowed too much relative to equity (highly leveraged)
• Borrowing for speculation in stock and real estate markets
• Later when land prices fell, causing problems for both creditors and debtors

42
Domestic factor no. 2
Inappropriate macroeconomic policies
• Tried to do the impossible:– fixed exchange rate– free capital movement– effective monetary policy
(+sterilization = neutralizing the effect of capital inflow on money supply)

43
Domestic factor no. 2
Inappropriate macroeconomic policies
• Why not devalue the baht before the crisis? high import content of exports high foreign debts (by private sector) increase import prices and inflation

44
Domestic factor no. 2
Inappropriate macroeconomic policies
• Insist on fixing the baht value, leading to speculative attacks on the baht
(with low risk of losing money) eventual floating of the baht
• Why not control capital flows, like Malaysia?
45
Domestic Factor no. 3
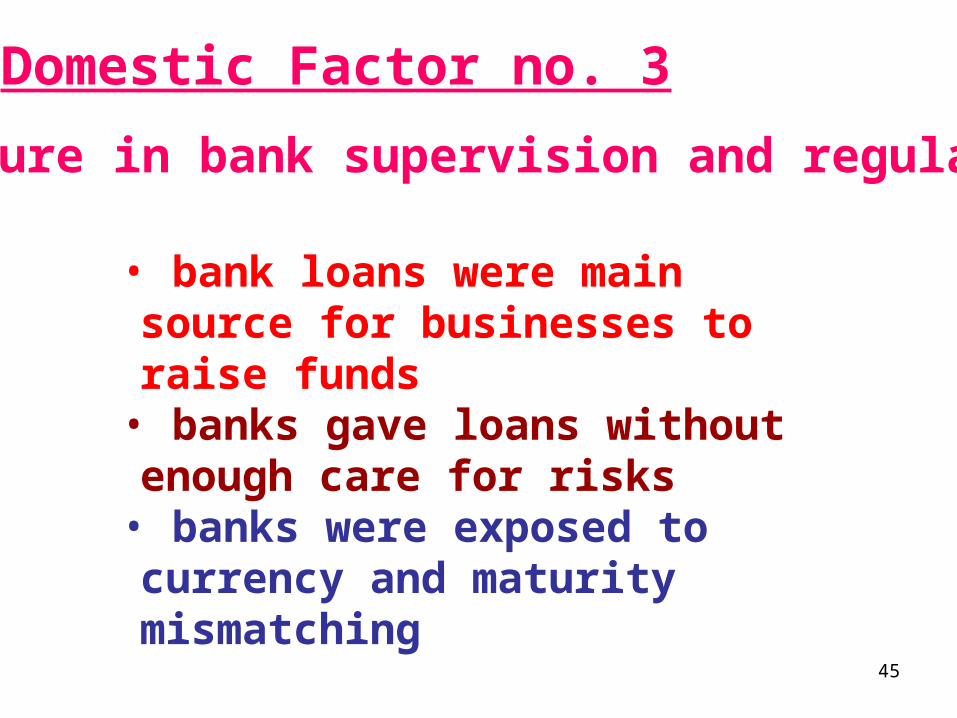
Failure in bank supervision and regulation
• bank loans were main source for businesses to raise funds
• banks gave loans without enough care for risks
• banks were exposed to currency and maturity mismatching

46
Domestic Factor no. 3
Failure in bank supervision and regulation
• BOT policy of “no new banks, no bank failure” ===> the “moral hazard” problem where banks felt that their survival was guaranteed by government

47
Domestic Factor no. 3
Failure in bank supervision and regulation
• Poor standards in loan classification, loan loss provision, and data dissemination
• Widespread problem in non-performing loans (NPLs) and BOT’s weak supervision
• Disunity and rivalry among BOT top management (read Nukul Commission)

48
Domestic Factor no. 4
Weaknesses in political and social systems
• politics in transition period of “democracy” with instability: within 6 years, Thailand had 4 governments, 10 finance ministers, and 4 BOT governors

49
Domestic Factor no. 4
Weaknesses in political and social systems
• Complacency in society: ignored risks in short-term financial gains, with no regard for long run sustainable economic development

50
Situation after the crisis• From 2000, the economy started to slowly recover
2000: 4.8%2001: 2.2%2002: 5.3%2003: 7.0%2004: 6.2%
• NPLs declined and financial institutions improved

51
Situation after the crisis
• Baht depreciation boosted exports, Imports declined as investment was low, and surpluses in trade and current accounts since 1998 (up to 2005)• Export-led recovery of aggregate demand in 1999-2000
52
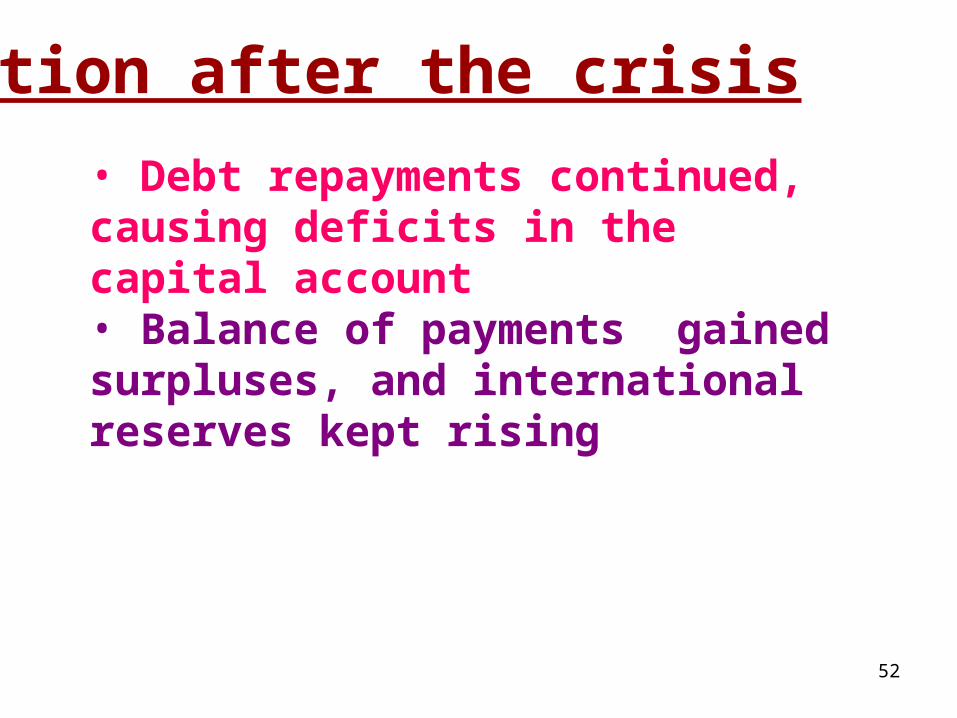
Situation after the crisis
• Debt repayments continued, causing deficits in the capital account• Balance of payments gained surpluses, and international reserves kept rising

53
Thailand’s Balance of Payments 1997-2006, (bill. Baht)
1997 1998 1999 2000 2001 2002
Exports 1,790 2,181 2,150 2,731 2,808 2,838
Imports -1,875 -1,678 -1,800 -2,514 -2,696 -2,719
Trade balance -85 503 350 217 112 118
Net services 45 89 120 154 164 184
Current A/C -40 592 470 372 276 302
Capital A/C -162 -413 -298 -405 -213 -182
BOP -299 58 173 -58 58 181

54
2003 2004 2005 2006
Exports 3,233 3,823 4,400 4,849
Imports -3,078 -3,764 -4,738 -4,769
Trade balance 156 59 -338 80
Net services 174 51 27 38
Current A/C 329 110 -311 118
Capital A/C -334 149 507 302
BOP 2 230 221 478
Thailand’s Balance of Payments 1997-2006, (bill. Baht)


